| Param | Original file | Final file |
|---|---|---|
| Filename | modeM0/AS1A04_124T01_9000001766_11960cztM0_level2.evt | modeM0/AS1A04_124T01_9000001766_11960cztM0_level2_quad_clean.evt |
| Size (bytes) | 499,777,920 | 127,200,960 |
| Size | 476.6 MB | 121.3 MB |
| Events in quadrant A | 3,697,225 | 846,204 |
| Events in quadrant B | 3,961,288 | 860,889 |
| Events in quadrant C | 3,054,611 | 843,023 |
| Events in quadrant D | 3,938,331 | 805,839 |
| Mode SS | |||
|---|---|---|---|
| Quadrant | BADHDUFLAG | Total packets | Discarded packets |
| A | 0 | 144 | 0 |
| B | 0 | 144 | 0 |
| C | 0 | 144 | 0 |
| D | 0 | 144 | 0 |
| Mode M9 | |||
|---|---|---|---|
| Quadrant | BADHDUFLAG | Total packets | Discarded packets |
| A | 0 | 2 | 0 |
| B | 0 | 2 | 0 |
| C | 0 | 2 | 0 |
| D | 0 | 2 | 0 |
| Mode M0 | |||
|---|---|---|---|
| Quadrant | BADHDUFLAG | Total packets | Discarded packets |
| A | 0 | 15955 | 2 |
| B | 0 | 16683 | 1 |
| C | 0 | 14538 | 1 |
| D | 0 | 17009 | 1 |
| Quadrant | Total seconds | Saturated seconds | Saturation percentage |
|---|---|---|---|
| A | 7132 | 116 | 1.626472% |
| B | 7132 | 187 | 2.621985% |
| C | 7132 | 24 | 0.336511% |
| D | 7132 | 187 | 2.621985% |
Noise dominated data is calculated using 1-second bins in cleaned event files. If a bin has >2000 counts, and if more than 50% of those come from <1% of pixels, then it is considered to be noise-dominated and hence unusable.
| Quadrant | # 1 sec bins | Bins with >0 counts | Bins with >2000 counts | High rate bins dominated by noise | Noise dominated (total time) | Noise dominated (detector-on time) | Marked lightcurve |
|---|---|---|---|---|---|---|---|
| A | 7338 | 7133 | 10 | 10 | 0.14% | 0.14% | 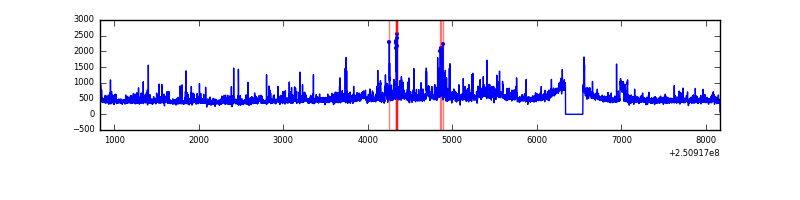 |
| B | 7338 | 7134 | 71 | 71 | 0.97% | 1.00% | 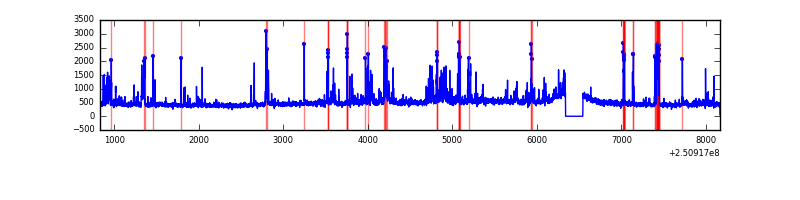 |
| C | 7338 | 7134 | 2 | 2 | 0.03% | 0.03% | 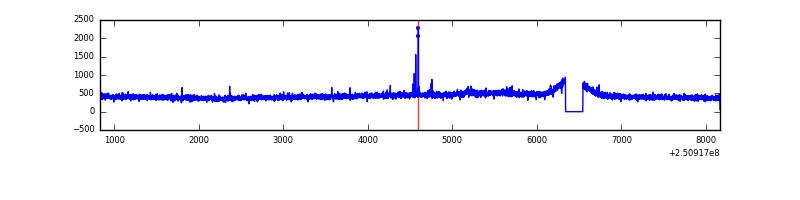 |
| D | 7338 | 7134 | 119 | 119 | 1.62% | 1.67% | 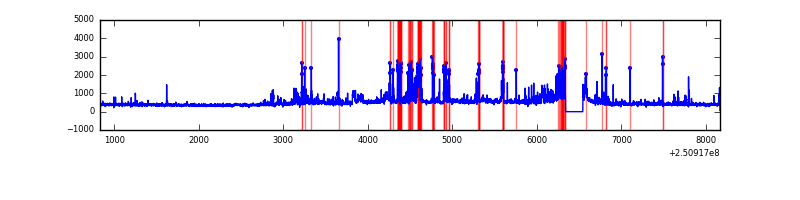 |
Top three noisy pixels from each quadrant. If the there are fewer than three noisy pixels in the level2.evt file, extra rows are filled as -1
| Pixel properties | Quadrant properties | ||||||
|---|---|---|---|---|---|---|---|
| Quadrant | DetID | PixID | Counts | Sigma | Mean | Median | Sigma |
| A | 6 | 254 | 240718 | 1461.84 | 803 | 785 | 164.1 |
| A | 1 | 162 | 113582 | 687.24 | 803 | 785 | 164.1 |
| A | 1 | 178 | 59989 | 360.71 | 803 | 785 | 164.1 |
| B | 4 | 239 | 538397 | 3478.37 | 806 | 786 | 154.6 |
| B | 10 | 244 | 103626 | 665.38 | 806 | 786 | 154.6 |
| B | 15 | 204 | 102866 | 660.46 | 806 | 786 | 154.6 |
| C | 0 | 207 | 9882 | 50.6 | 779 | 782 | 179.9 |
| C | 8 | 222 | 7288 | 36.17 | 779 | 782 | 179.9 |
| C | 13 | 61 | 5947 | 28.72 | 779 | 782 | 179.9 |
| D | 1 | 52 | 368302 | 1848.22 | 763 | 744 | 198.9 |
| D | 8 | 195 | 210050 | 1052.47 | 763 | 744 | 198.9 |
| D | 13 | 122 | 141275 | 706.64 | 763 | 744 | 198.9 |
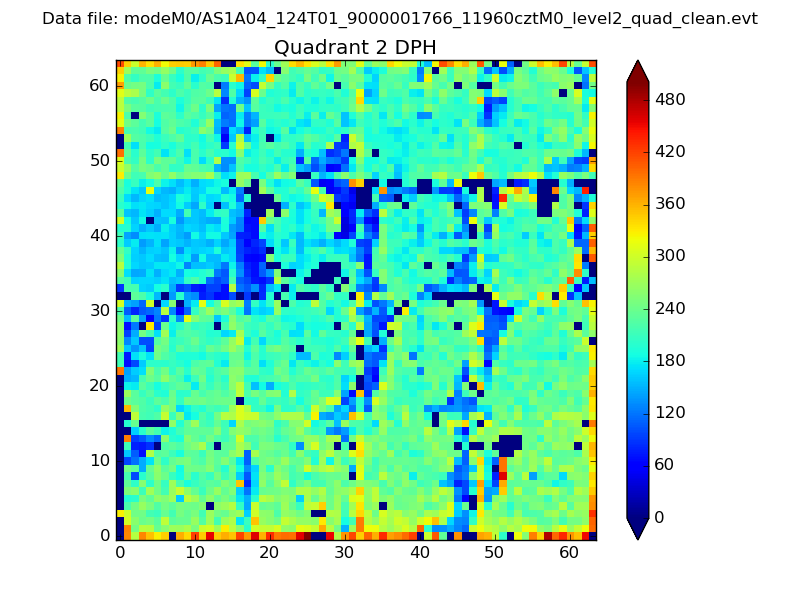
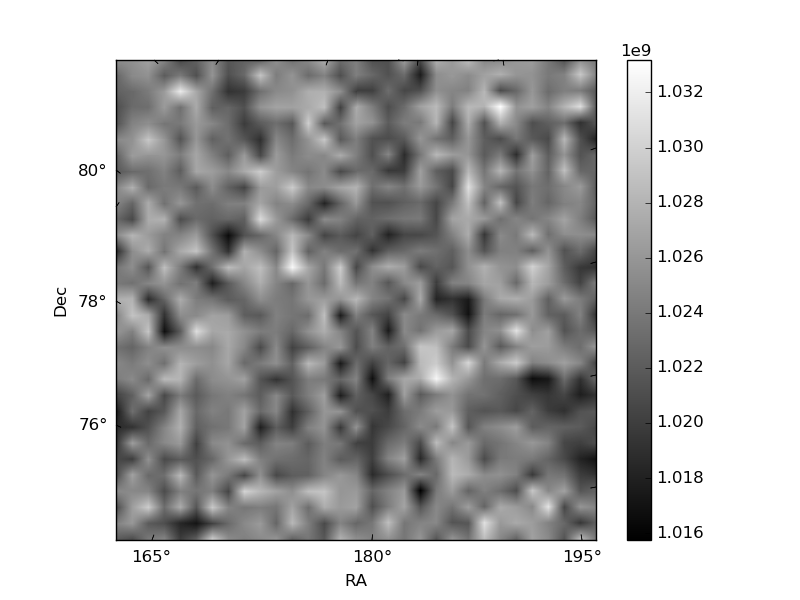
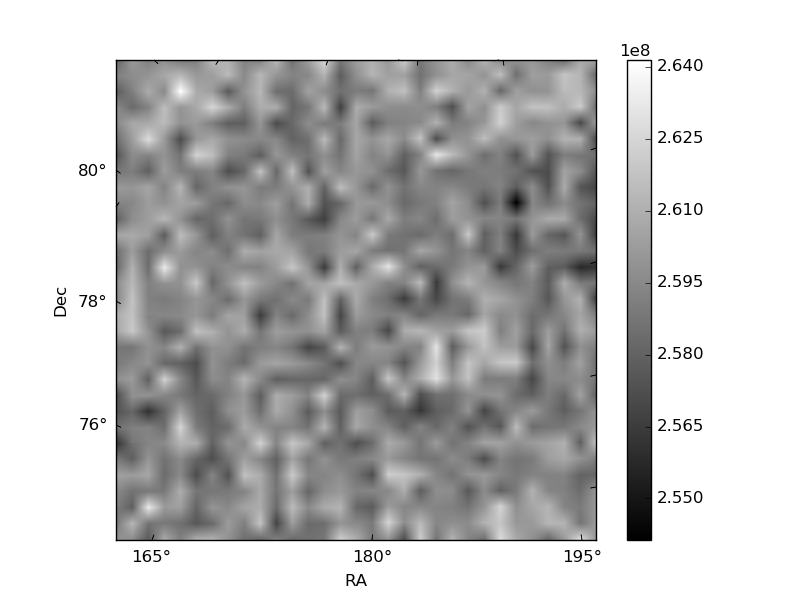
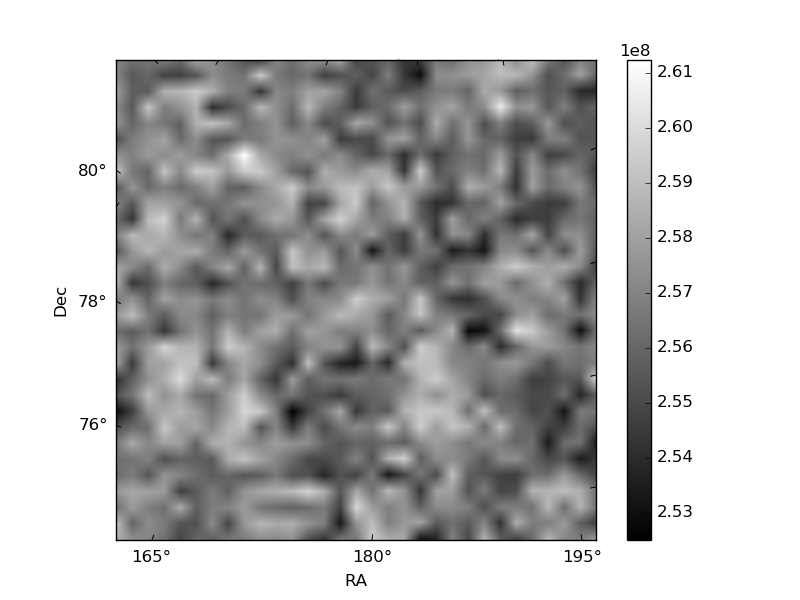
Histogram calculated using DETX and DETY for each event in the final _common_clean file
| Quadrant A | 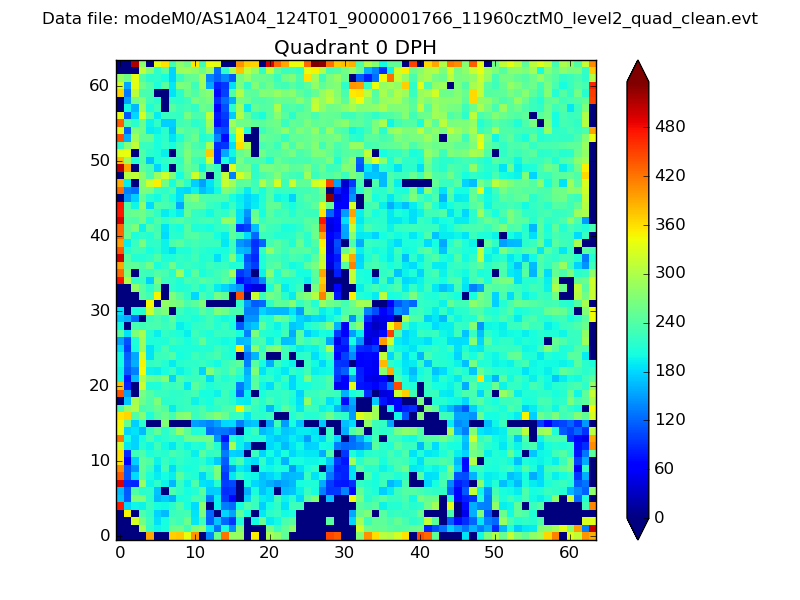 |
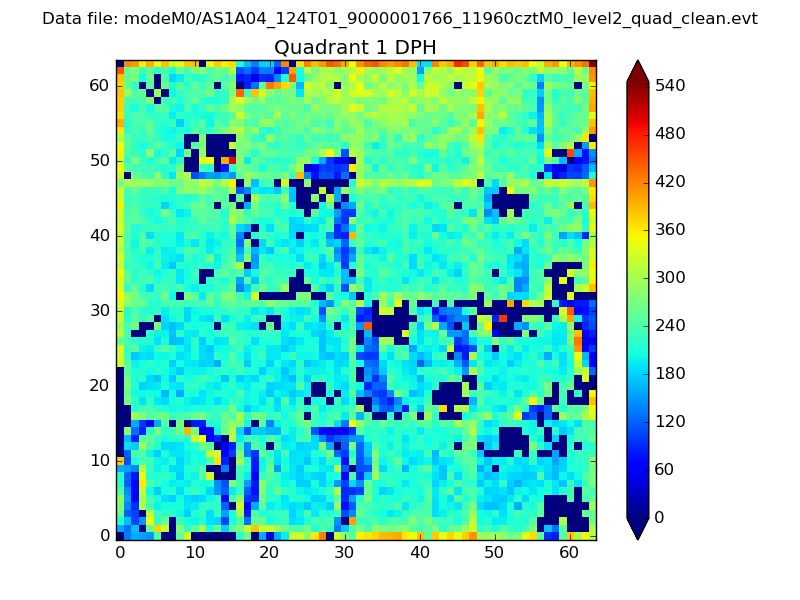 |
Quadrant B |
|---|---|---|---|
| Quadrant D | 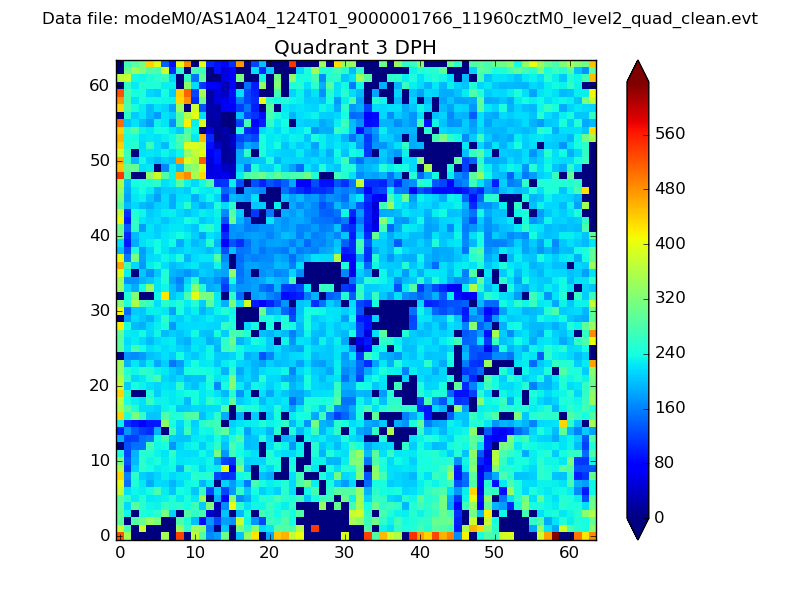 |
 |
Quadrant C |
| Plot type | Count rate plots | Images |
|---|---|---|
| Comparison with Poisson distribution Blue bars denote a histogram of data divided into 1 sec bins. Red curve is a Poisson curve with rate = median count rate of data. |
 |
 |
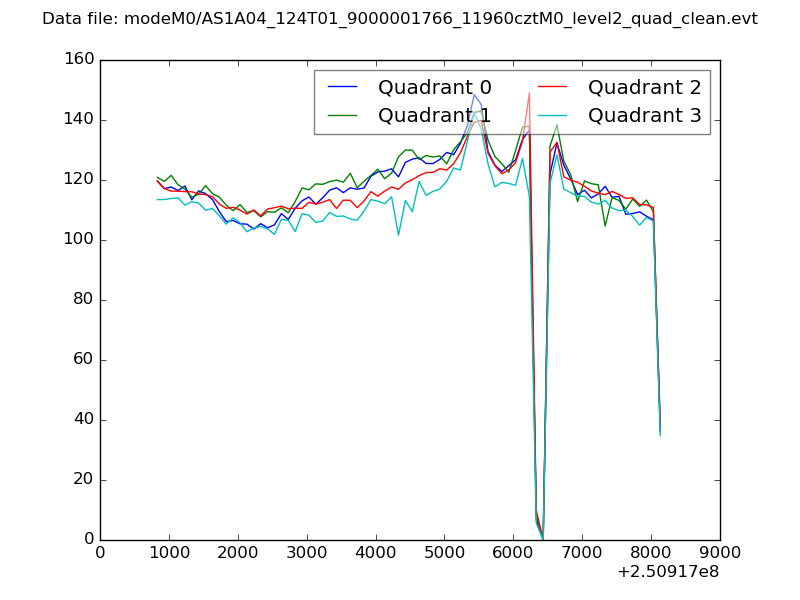
| Quadrant-wise count rates Data is divided into 100 sec bins |
 |
|
| Module-wise count rates for Quadrant A Data is divided into 100 sec bins |
 |
 |
| Module-wise count rates for Quadrant B Data is divided into 100 sec bins |
 |
 |
| Module-wise count rates for Quadrant C Data is divided into 100 sec bins |
 |
 |
| Module-wise count rates for Quadrant D Data is divided into 100 sec bins |
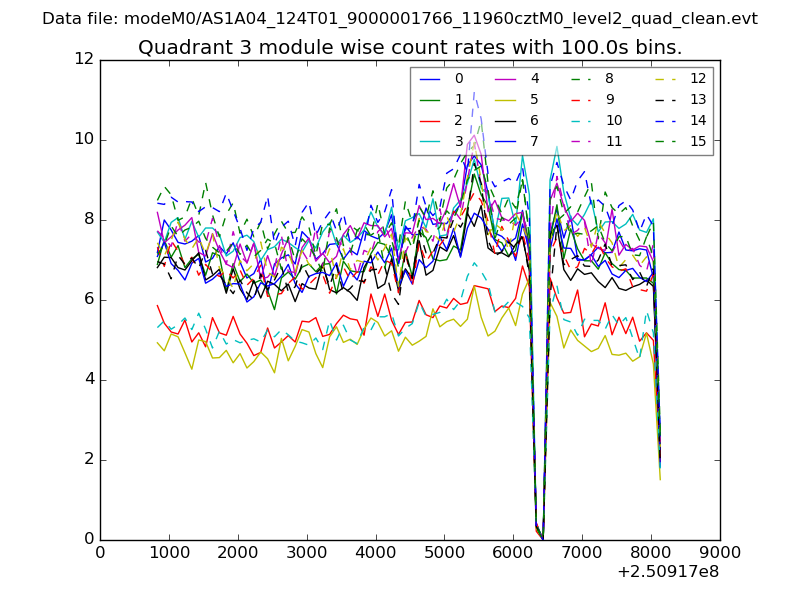 |
 |
| Parameter | Plot |
|---|---|
| CZT HV Monitor | 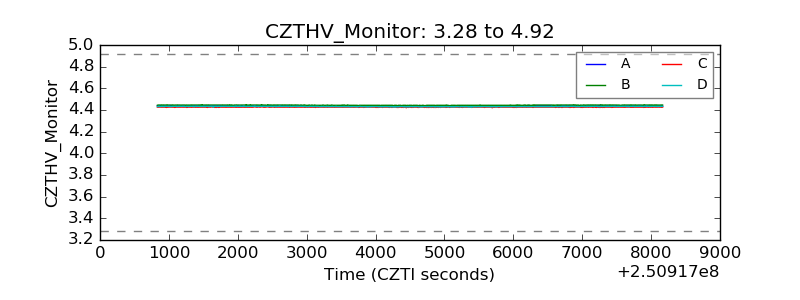 |
| D_VDD | 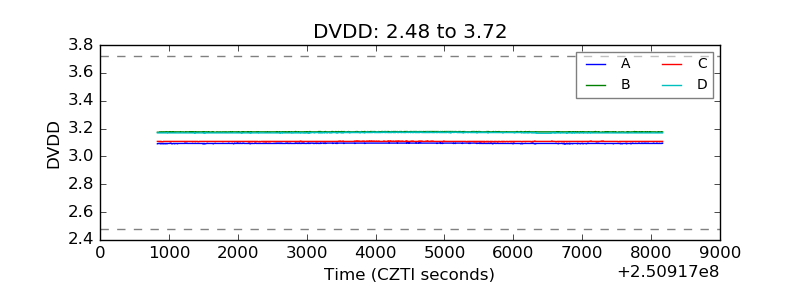 |
| Temperature 1 |  |
| Veto HV Monitor | 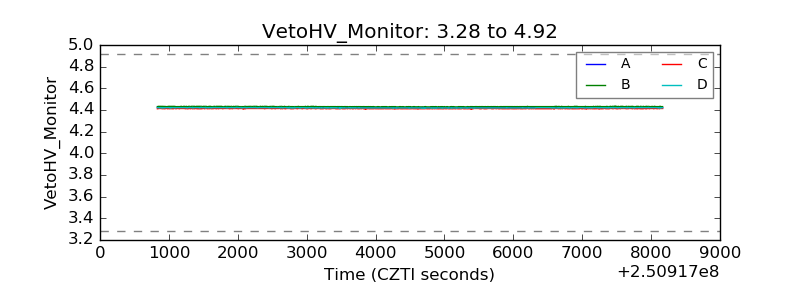 |
| Veto LLD | 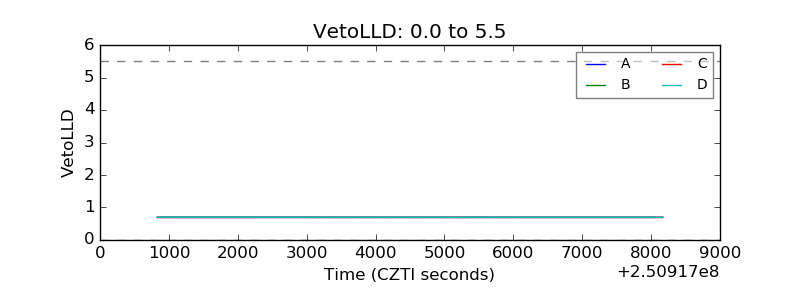 |
| Alpha Counter | 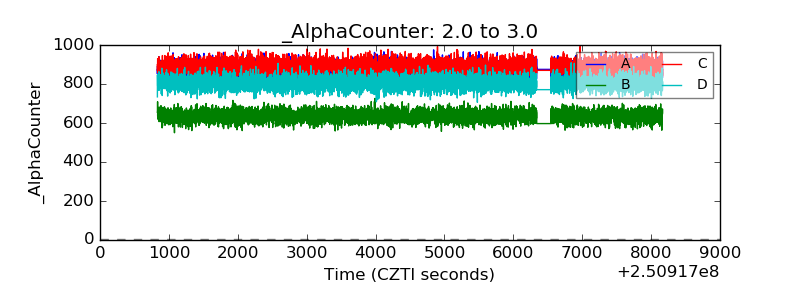 |
| _CPM_Rate | 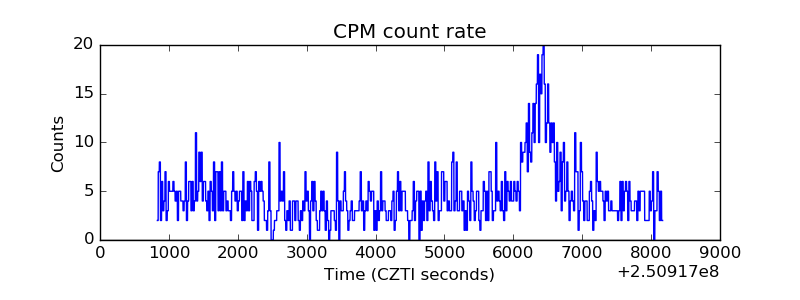 |
| CZT Counter | 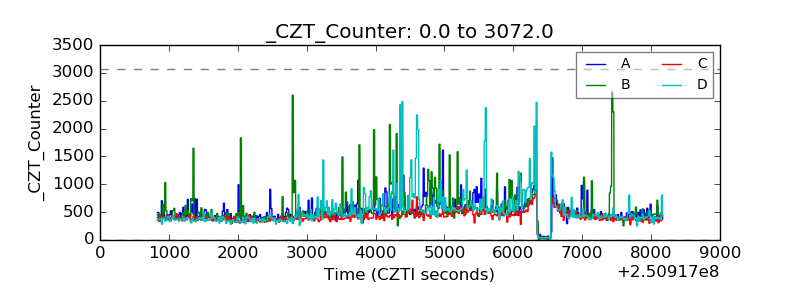 |
| +2.5 Volts monitor |  |
| +5 Volts monitor |  |
| _ROLL_ROT | 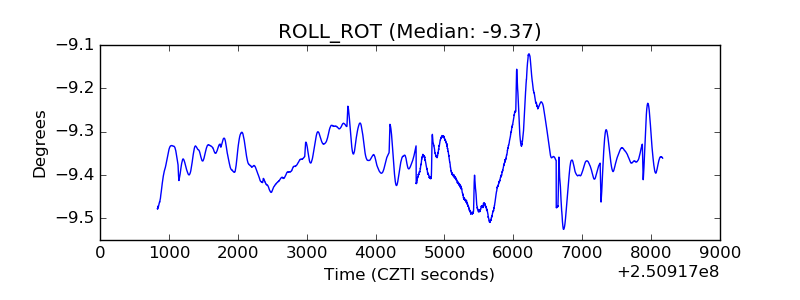 |
| _Roll_DEC |  |
| _Roll_RA | 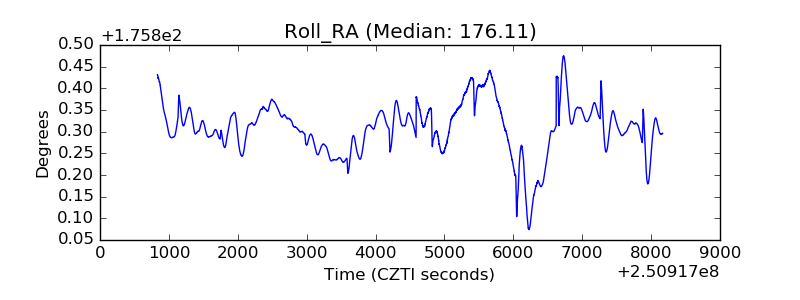 |
| Veto Counter | 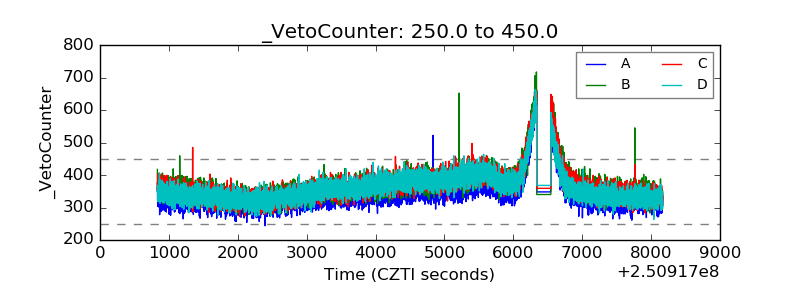 |