| Param | Original file | Final file |
|---|---|---|
| Filename | modeM0/AS1A04_124T01_9000001766_11961cztM0_level2.evt | modeM0/AS1A04_124T01_9000001766_11961cztM0_level2_quad_clean.evt |
| Size (bytes) | 502,634,880 | 128,188,800 |
| Size | 479.3 MB | 122.3 MB |
| Events in quadrant A | 3,643,874 | 854,020 |
| Events in quadrant B | 4,284,085 | 858,060 |
| Events in quadrant C | 3,091,361 | 850,292 |
| Events in quadrant D | 3,711,312 | 816,246 |
| Mode SS | |||
|---|---|---|---|
| Quadrant | BADHDUFLAG | Total packets | Discarded packets |
| A | 0 | 146 | 0 |
| B | 0 | 146 | 0 |
| C | 0 | 146 | 0 |
| D | 0 | 146 | 0 |
| Mode M9 | |||
|---|---|---|---|
| Quadrant | BADHDUFLAG | Total packets | Discarded packets |
| A | 0 | 3 | 0 |
| B | 0 | 3 | 0 |
| C | 0 | 3 | 0 |
| D | 0 | 3 | 0 |
| Mode M0 | |||
|---|---|---|---|
| Quadrant | BADHDUFLAG | Total packets | Discarded packets |
| A | 0 | 15607 | 2 |
| B | 0 | 17506 | 1 |
| C | 0 | 14704 | 1 |
| D | 0 | 15974 | 1 |
| Quadrant | Total seconds | Saturated seconds | Saturation percentage |
|---|---|---|---|
| A | 7242 | 116 | 1.601767% |
| B | 7242 | 288 | 3.976802% |
| C | 7242 | 40 | 0.552334% |
| D | 7242 | 93 | 1.284176% |
Noise dominated data is calculated using 1-second bins in cleaned event files. If a bin has >2000 counts, and if more than 50% of those come from <1% of pixels, then it is considered to be noise-dominated and hence unusable.
| Quadrant | # 1 sec bins | Bins with >0 counts | Bins with >2000 counts | High rate bins dominated by noise | Noise dominated (total time) | Noise dominated (detector-on time) | Marked lightcurve |
|---|---|---|---|---|---|---|---|
| A | 7533 | 7243 | 2 | 2 | 0.03% | 0.03% | 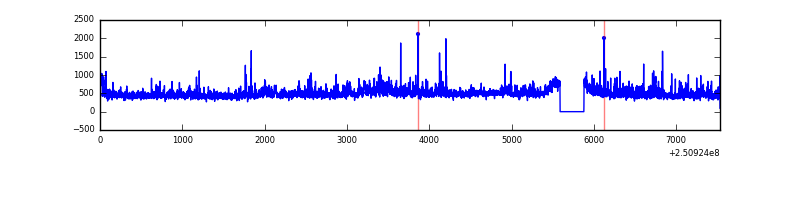 |
| B | 7533 | 7243 | 151 | 151 | 2.00% | 2.08% | 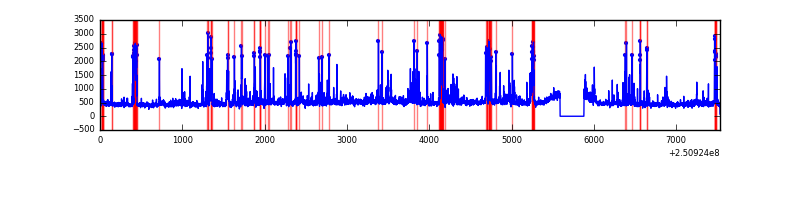 |
| C | 7533 | 7244 | 1 | 1 | 0.01% | 0.01% |  |
| D | 7533 | 7243 | 24 | 24 | 0.32% | 0.33% | 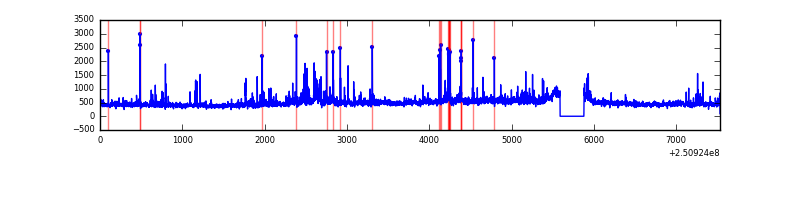 |
Top three noisy pixels from each quadrant. If the there are fewer than three noisy pixels in the level2.evt file, extra rows are filled as -1
| Pixel properties | Quadrant properties | ||||||
|---|---|---|---|---|---|---|---|
| Quadrant | DetID | PixID | Counts | Sigma | Mean | Median | Sigma |
| A | 1 | 162 | 121957 | 727.32 | 816 | 797 | 166.6 |
| A | 6 | 254 | 104099 | 620.12 | 816 | 797 | 166.6 |
| A | 1 | 178 | 64584 | 382.91 | 816 | 797 | 166.6 |
| B | 4 | 239 | 691595 | 4422.14 | 813 | 791 | 156.2 |
| B | 3 | 64 | 136328 | 867.63 | 813 | 791 | 156.2 |
| B | 15 | 204 | 133505 | 849.56 | 813 | 791 | 156.2 |
| C | 14 | 234 | 10165 | 51.49 | 789 | 790 | 182.1 |
| C | 13 | 61 | 5974 | 28.47 | 789 | 790 | 182.1 |
| C | 0 | 207 | 3607 | 15.47 | 789 | 790 | 182.1 |
| D | 8 | 195 | 300396 | 1472.66 | 779 | 760 | 203.5 |
| D | 13 | 104 | 100282 | 489.13 | 779 | 760 | 203.5 |
| D | 13 | 122 | 71693 | 348.62 | 779 | 760 | 203.5 |
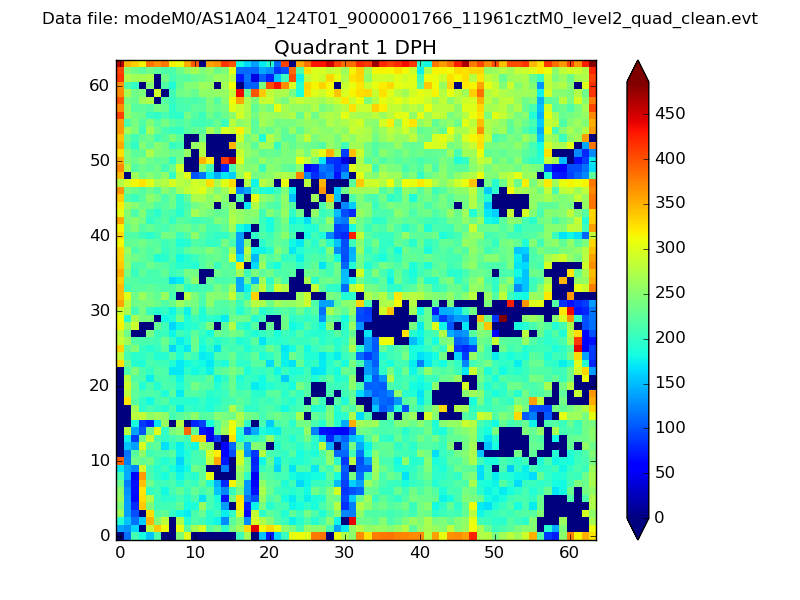
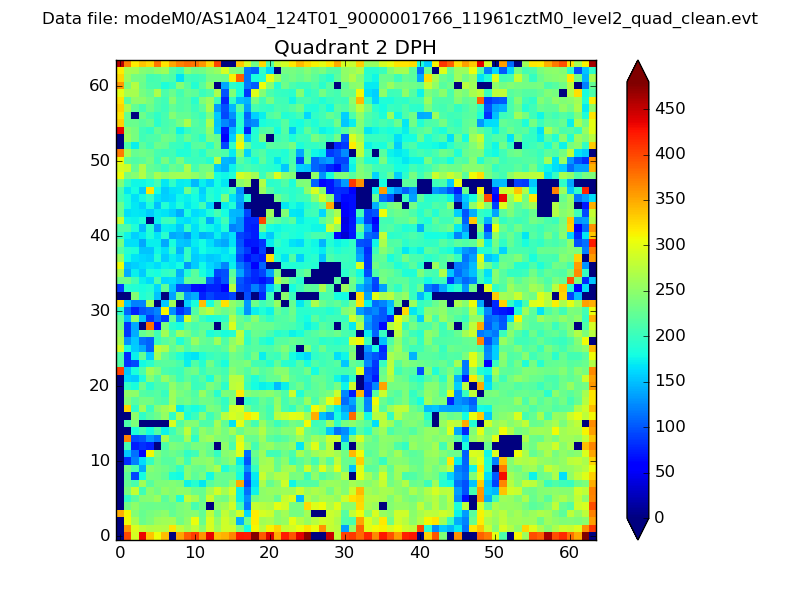
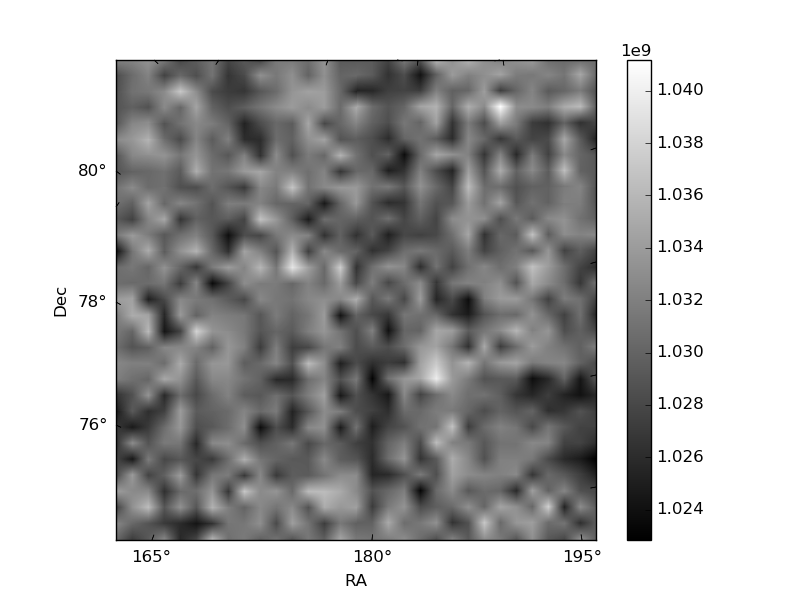
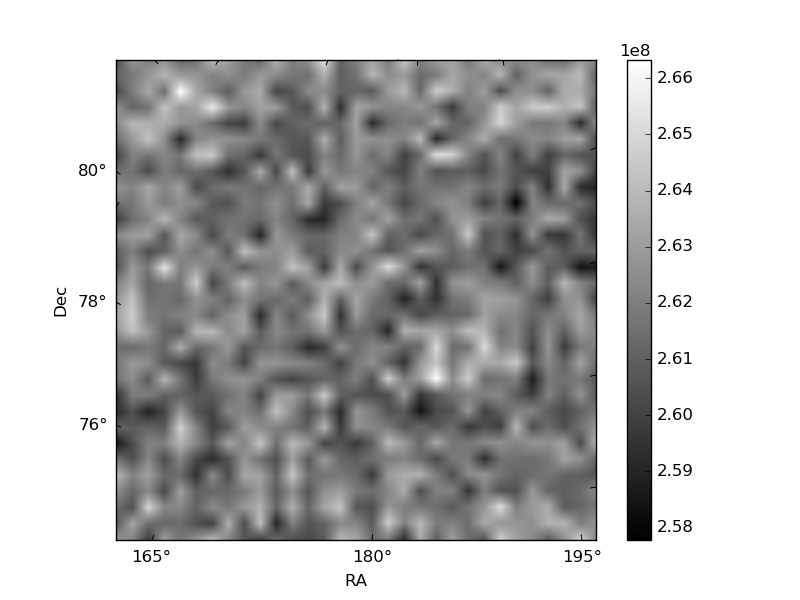
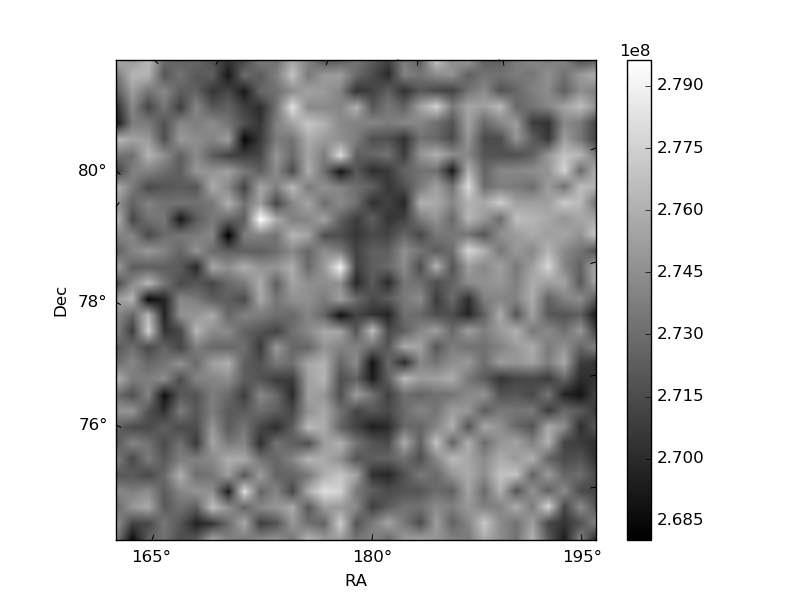
Histogram calculated using DETX and DETY for each event in the final _common_clean file
| Quadrant A | 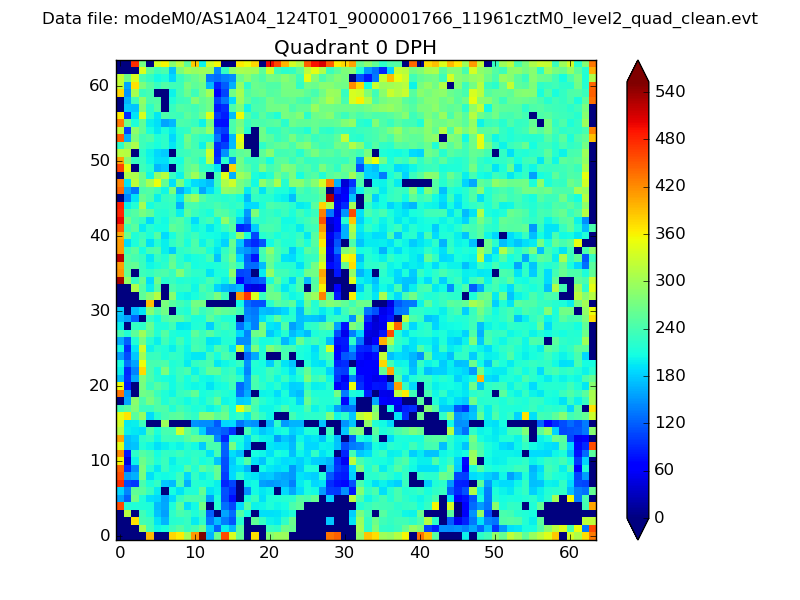 |
 |
Quadrant B |
|---|---|---|---|
| Quadrant D | 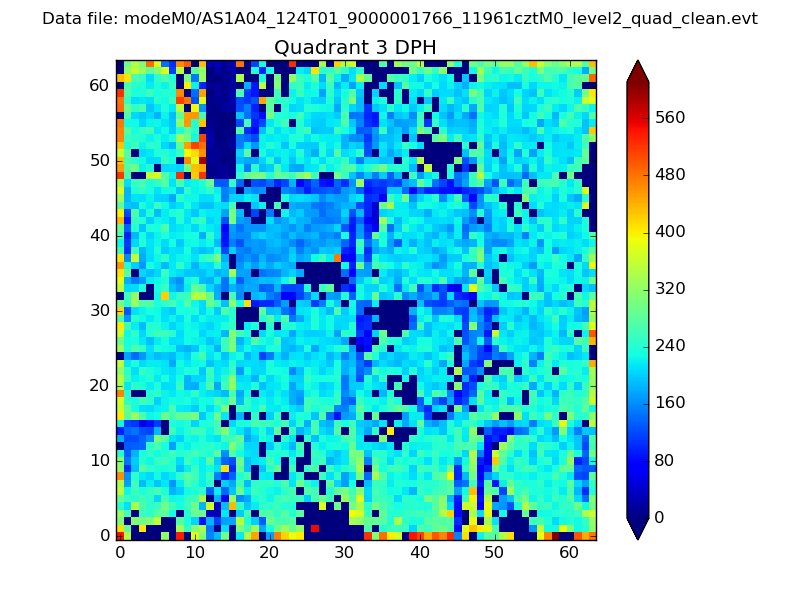 |
 |
Quadrant C |
| Plot type | Count rate plots | Images |
|---|---|---|
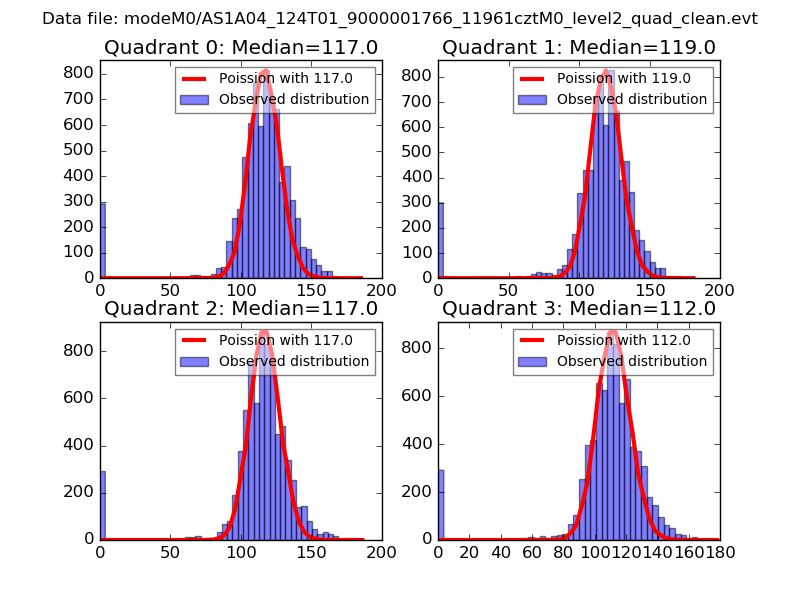
| Comparison with Poisson distribution Blue bars denote a histogram of data divided into 1 sec bins. Red curve is a Poisson curve with rate = median count rate of data. |
 |
 |
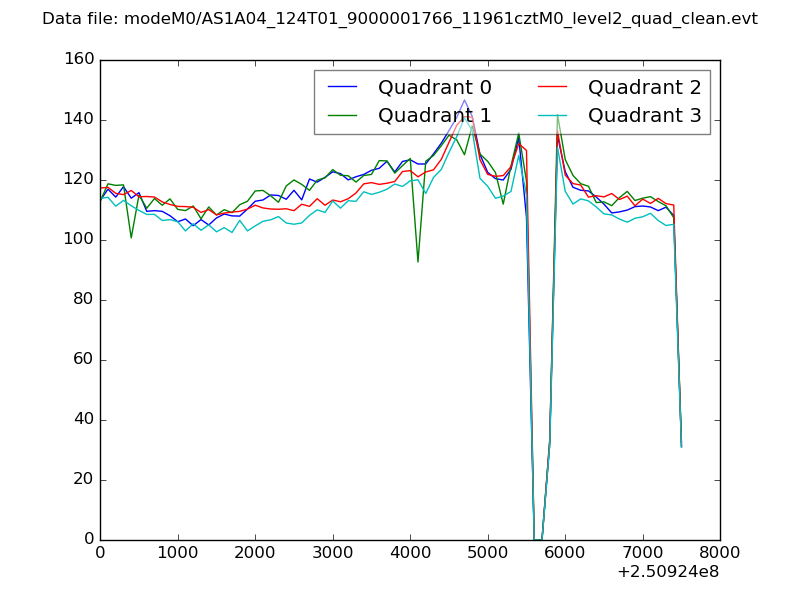
| Quadrant-wise count rates Data is divided into 100 sec bins |
 |
|
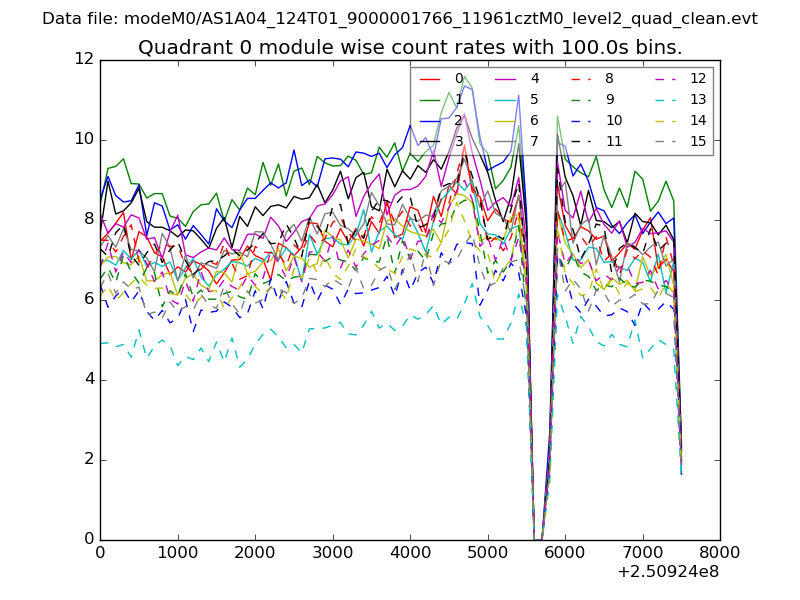
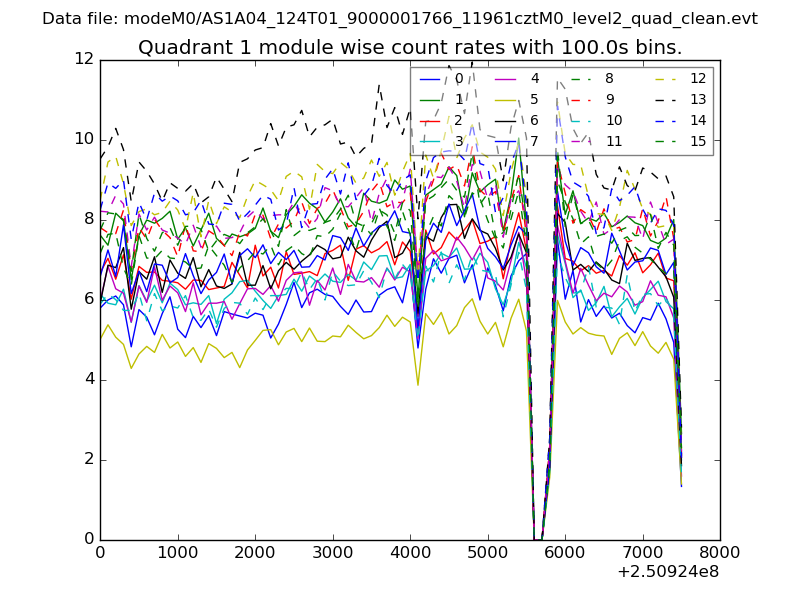
| Module-wise count rates for Quadrant A Data is divided into 100 sec bins |
 |
 |
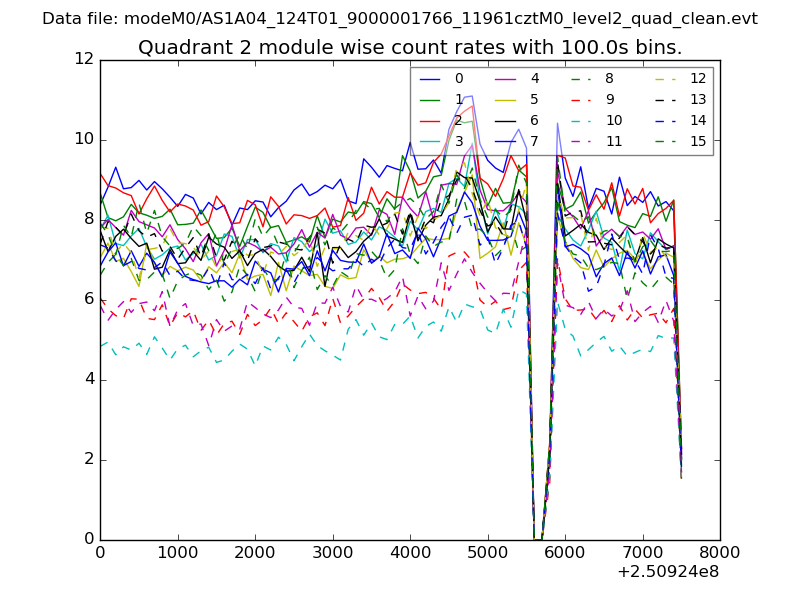
| Module-wise count rates for Quadrant B Data is divided into 100 sec bins |
 |
 |
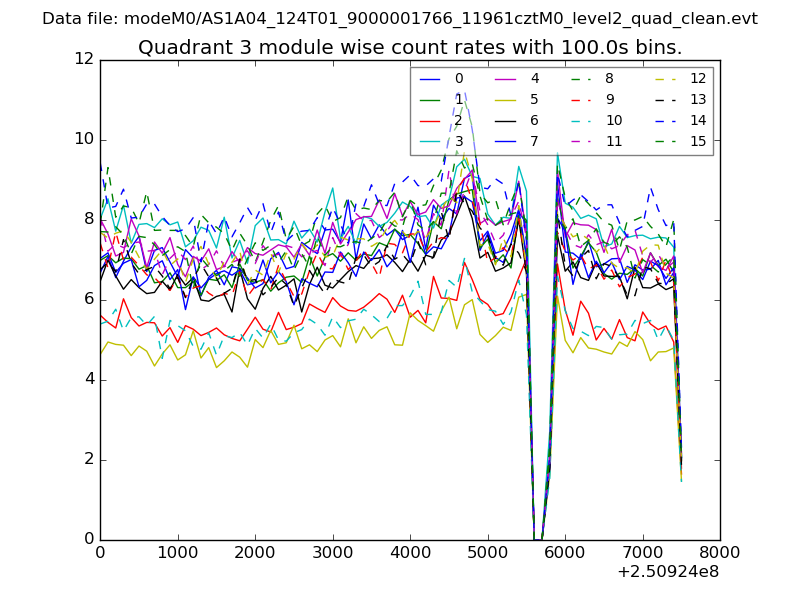
| Module-wise count rates for Quadrant C Data is divided into 100 sec bins |
 |
 |
| Module-wise count rates for Quadrant D Data is divided into 100 sec bins |
 |
 |
| Parameter | Plot |
|---|---|
| CZT HV Monitor | 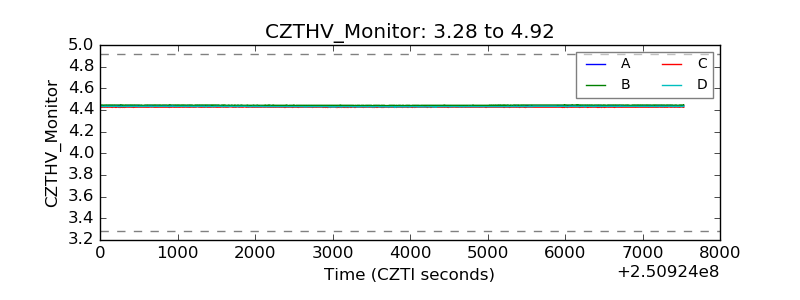 |
| D_VDD | 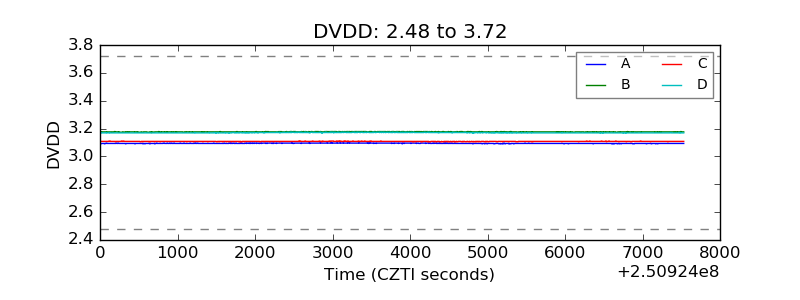 |
| Temperature 1 |  |
| Veto HV Monitor | 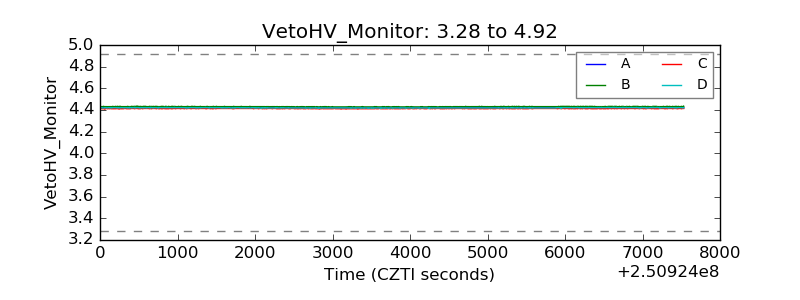 |
| Veto LLD | 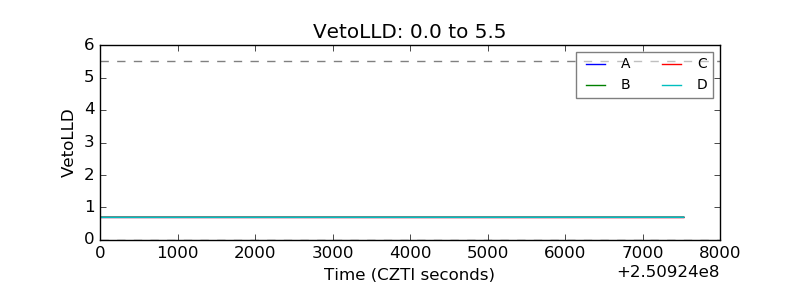 |
| Alpha Counter | 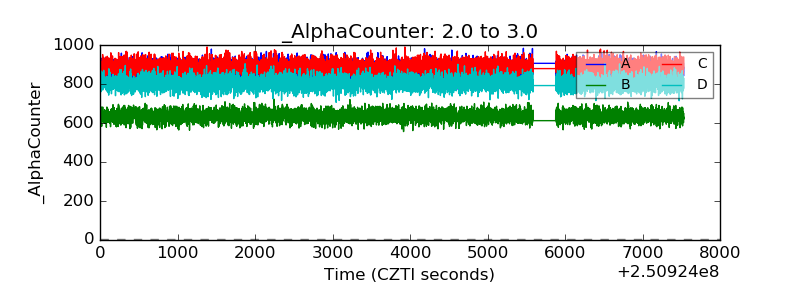 |
| _CPM_Rate | 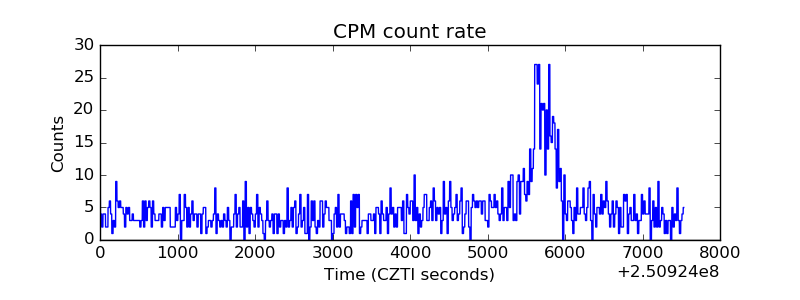 |
| CZT Counter | 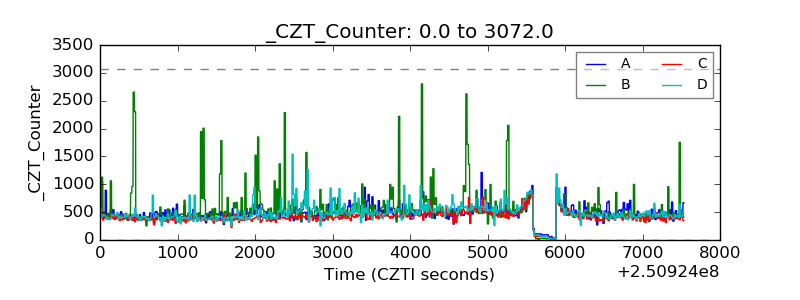 |
| +2.5 Volts monitor |  |
| +5 Volts monitor |  |
| _ROLL_ROT | 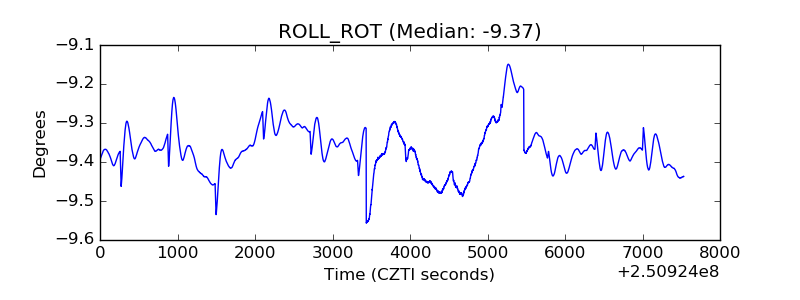 |
| _Roll_DEC | 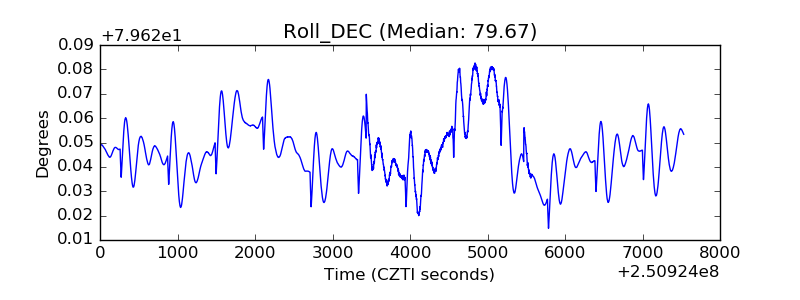 |
| _Roll_RA | 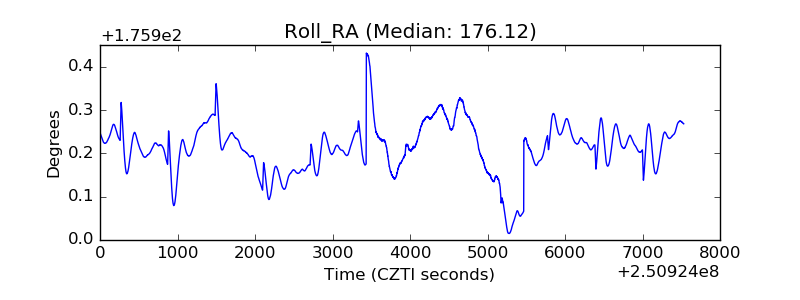 |
| Veto Counter | 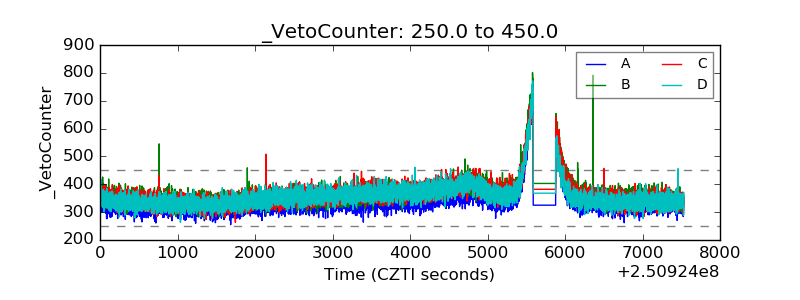 |