| Param | Original file | Final file |
|---|---|---|
| Filename | modeM0/AS1A04_124T01_9000001766_11964cztM0_level2.evt | modeM0/AS1A04_124T01_9000001766_11964cztM0_level2_quad_clean.evt |
| Size (bytes) | 1,182,700,800 | 279,711,360 |
| Size | 1.1 GB | 266.8 MB |
| Events in quadrant A | 7,953,281 | 1,887,314 |
| Events in quadrant B | 9,664,906 | 1,891,270 |
| Events in quadrant C | 6,795,196 | 1,852,385 |
| Events in quadrant D | 10,327,434 | 1,741,825 |
| Mode SS | |||
|---|---|---|---|
| Quadrant | BADHDUFLAG | Total packets | Discarded packets |
| A | 0 | 322 | 0 |
| B | 0 | 322 | 0 |
| C | 0 | 322 | 0 |
| D | 0 | 322 | 0 |
| Mode M9 | |||
|---|---|---|---|
| Quadrant | BADHDUFLAG | Total packets | Discarded packets |
| A | 0 | 12 | 0 |
| B | 0 | 12 | 0 |
| C | 0 | 12 | 0 |
| D | 0 | 12 | 0 |
| Mode M0 | |||
|---|---|---|---|
| Quadrant | BADHDUFLAG | Total packets | Discarded packets |
| A | 0 | 34071 | 2 |
| B | 0 | 38988 | 2 |
| C | 0 | 32118 | 2 |
| D | 0 | 41059 | 2 |
| Quadrant | Total seconds | Saturated seconds | Saturation percentage |
|---|---|---|---|
| A | 15940 | 191 | 1.198243% |
| B | 15940 | 569 | 3.569636% |
| C | 15940 | 67 | 0.420326% |
| D | 15940 | 761 | 4.774153% |
Noise dominated data is calculated using 1-second bins in cleaned event files. If a bin has >2000 counts, and if more than 50% of those come from <1% of pixels, then it is considered to be noise-dominated and hence unusable.
| Quadrant | # 1 sec bins | Bins with >0 counts | Bins with >2000 counts | High rate bins dominated by noise | Noise dominated (total time) | Noise dominated (detector-on time) | Marked lightcurve |
|---|---|---|---|---|---|---|---|
| A | 17066 | 15941 | 7 | 7 | 0.04% | 0.04% | 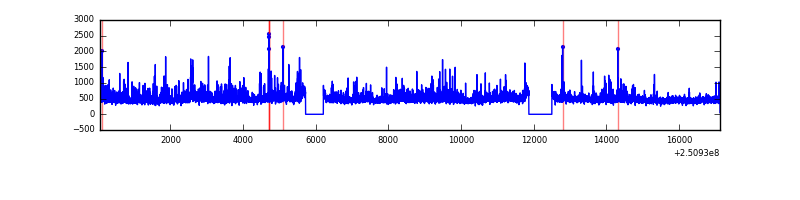 |
| B | 17066 | 15941 | 335 | 335 | 1.96% | 2.10% | 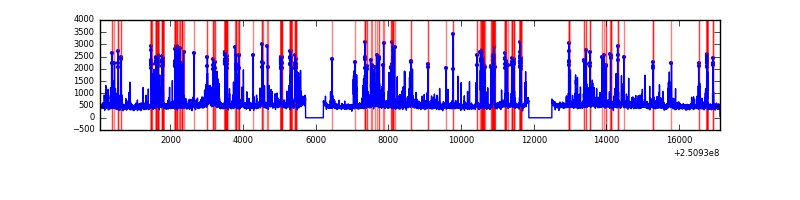 |
| C | 17066 | 15942 | 1 | 1 | 0.01% | 0.01% | 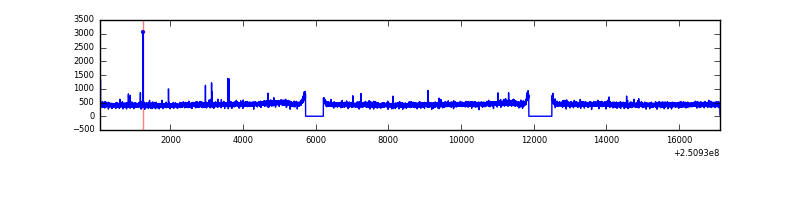 |
| D | 17066 | 15941 | 601 | 601 | 3.52% | 3.77% | 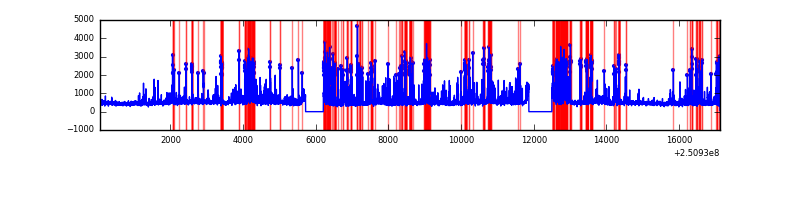 |
Top three noisy pixels from each quadrant. If the there are fewer than three noisy pixels in the level2.evt file, extra rows are filled as -1
| Pixel properties | Quadrant properties | ||||||
|---|---|---|---|---|---|---|---|
| Quadrant | DetID | PixID | Counts | Sigma | Mean | Median | Sigma |
| A | 1 | 162 | 288249 | 785.23 | 1794 | 1758 | 364.8 |
| A | 8 | 15 | 175045 | 474.95 | 1794 | 1758 | 364.8 |
| A | 6 | 254 | 155301 | 420.84 | 1794 | 1758 | 364.8 |
| B | 4 | 239 | 1851482 | 5479.87 | 1786 | 1738 | 337.6 |
| B | 15 | 204 | 337699 | 995.29 | 1786 | 1738 | 337.6 |
| B | 11 | 51 | 140842 | 412.1 | 1786 | 1738 | 337.6 |
| C | 14 | 234 | 13026 | 28.29 | 1737 | 1739 | 398.9 |
| C | 13 | 61 | 12775 | 27.66 | 1737 | 1739 | 398.9 |
| C | 0 | 207 | 11635 | 24.8 | 1737 | 1739 | 398.9 |
| D | 1 | 52 | 2015087 | 4989.9 | 1693 | 1644 | 403.5 |
| D | 8 | 195 | 750108 | 1854.91 | 1693 | 1644 | 403.5 |
| D | 10 | 199 | 312453 | 770.27 | 1693 | 1644 | 403.5 |
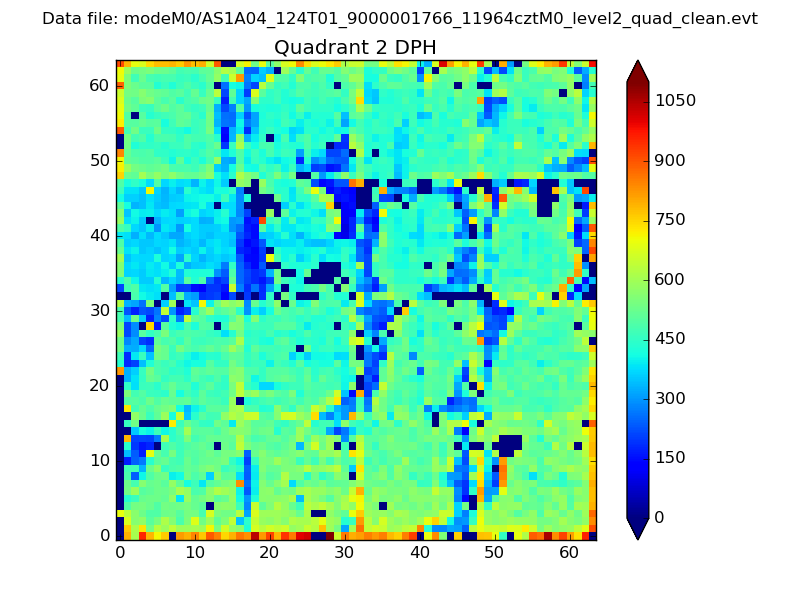
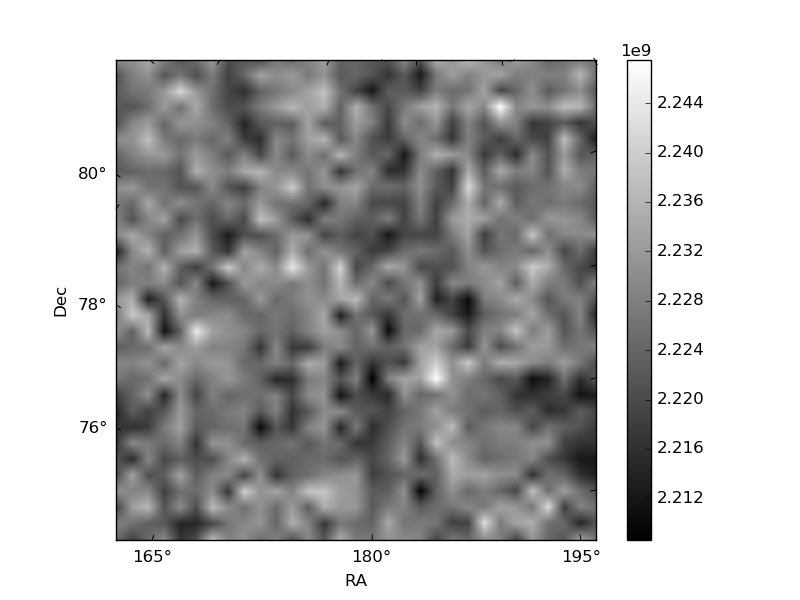
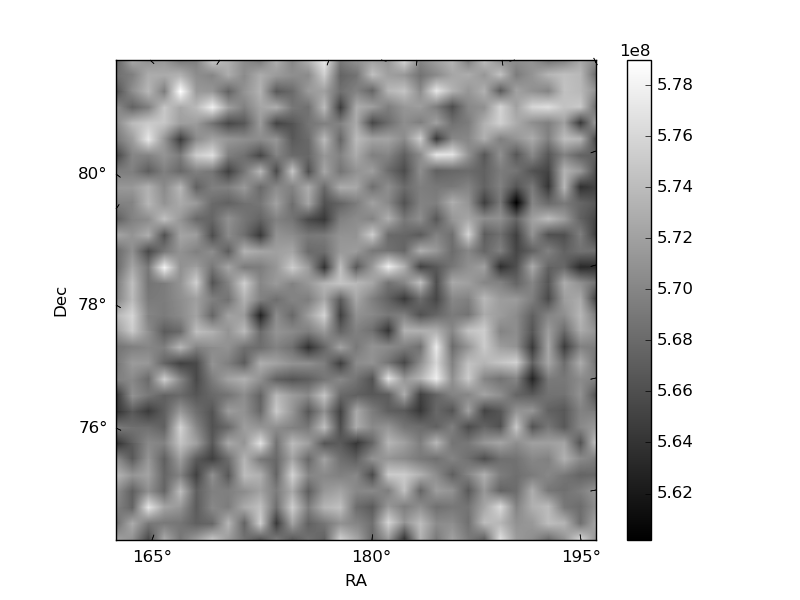
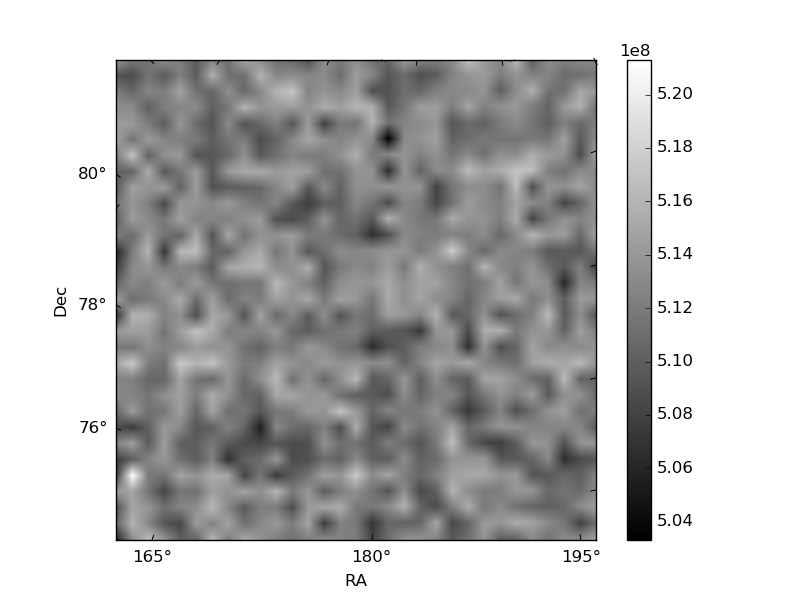
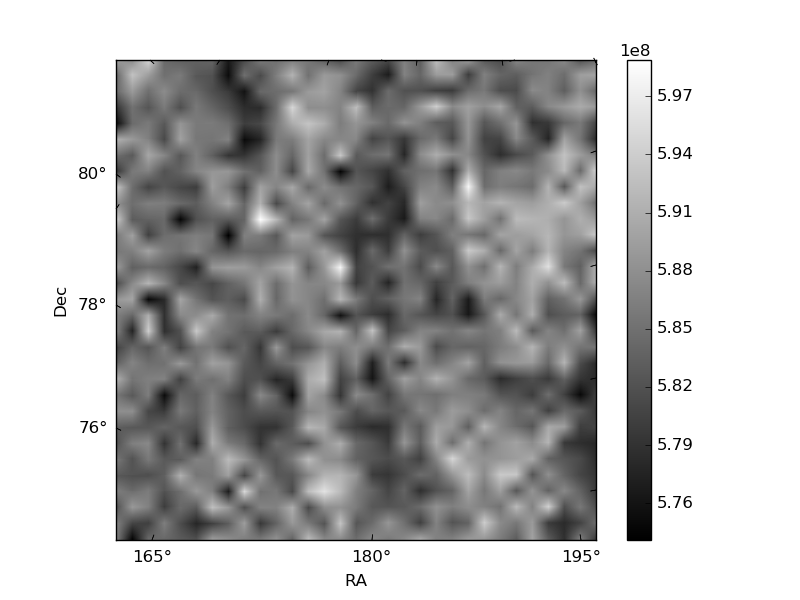
Histogram calculated using DETX and DETY for each event in the final _common_clean file
| Quadrant A | 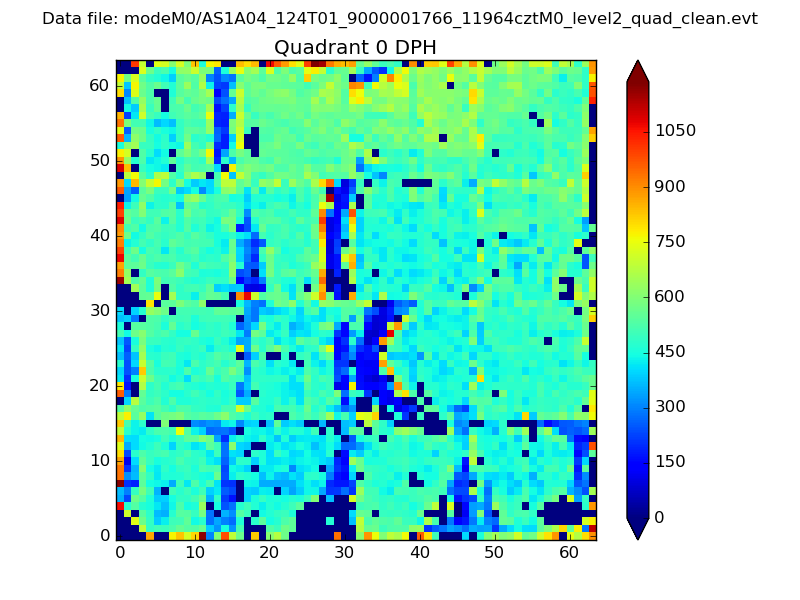 |
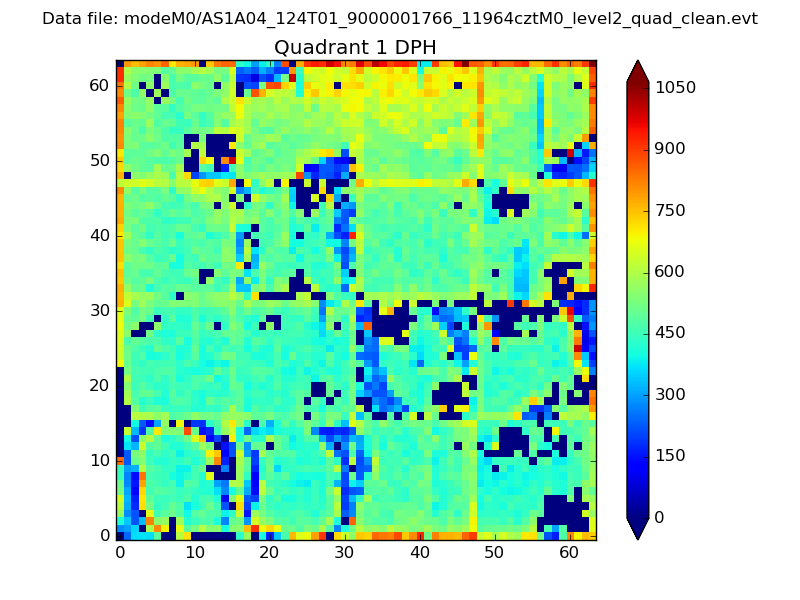 |
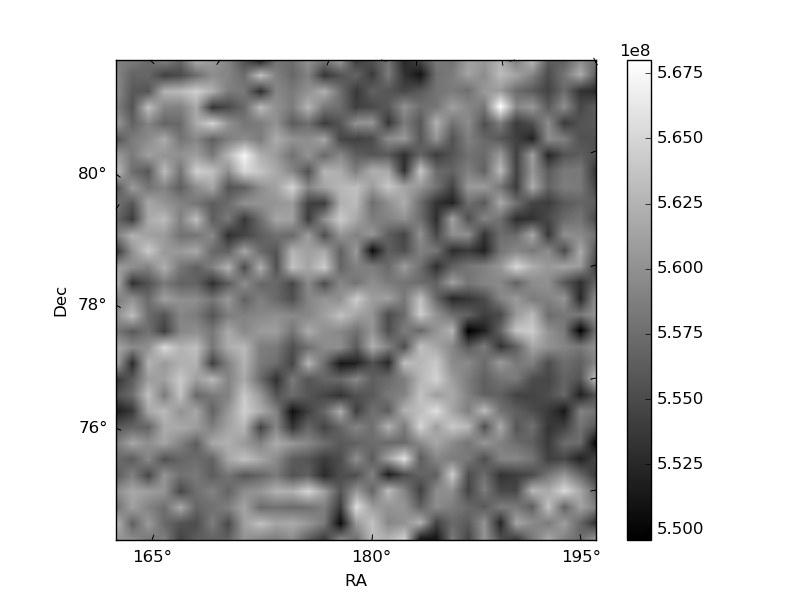
Quadrant B |
|---|---|---|---|
| Quadrant D | 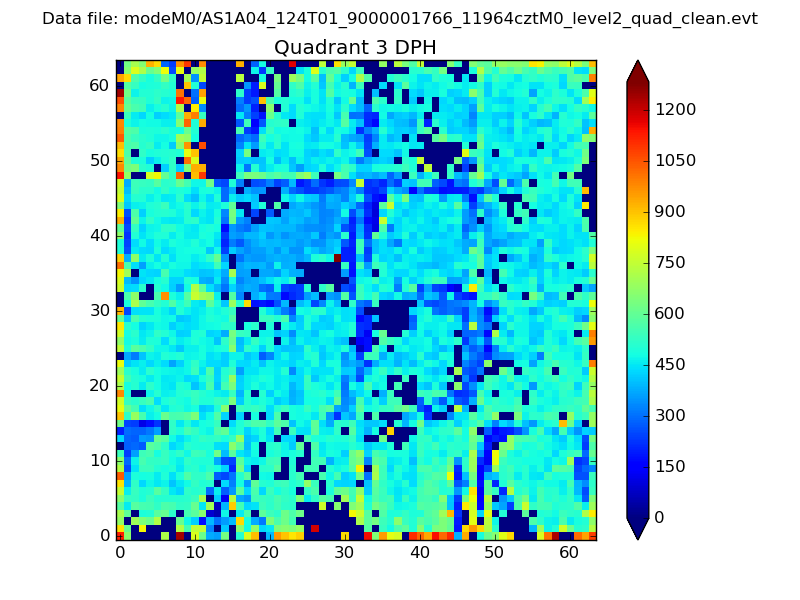 |
 |
Quadrant C |
| Plot type | Count rate plots | Images |
|---|---|---|
| Comparison with Poisson distribution Blue bars denote a histogram of data divided into 1 sec bins. Red curve is a Poisson curve with rate = median count rate of data. |
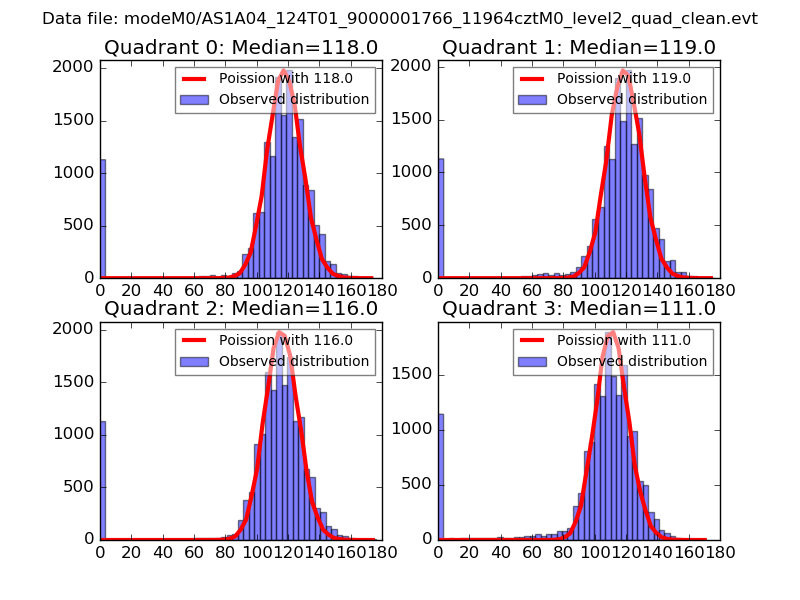 |
 |
| Quadrant-wise count rates Data is divided into 100 sec bins |
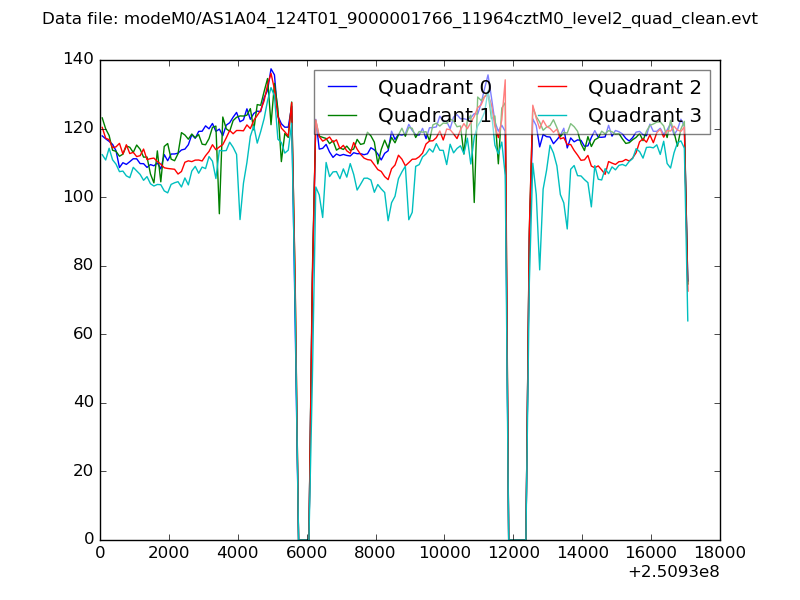 |
|
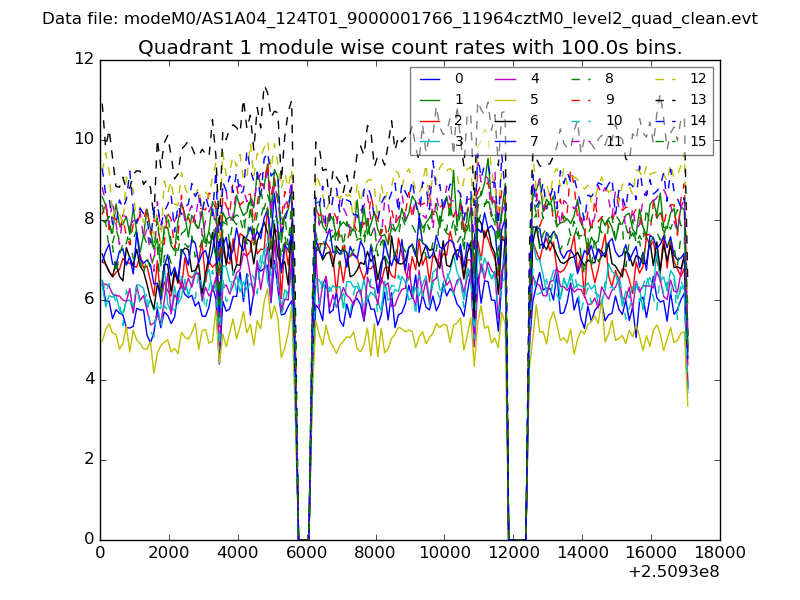
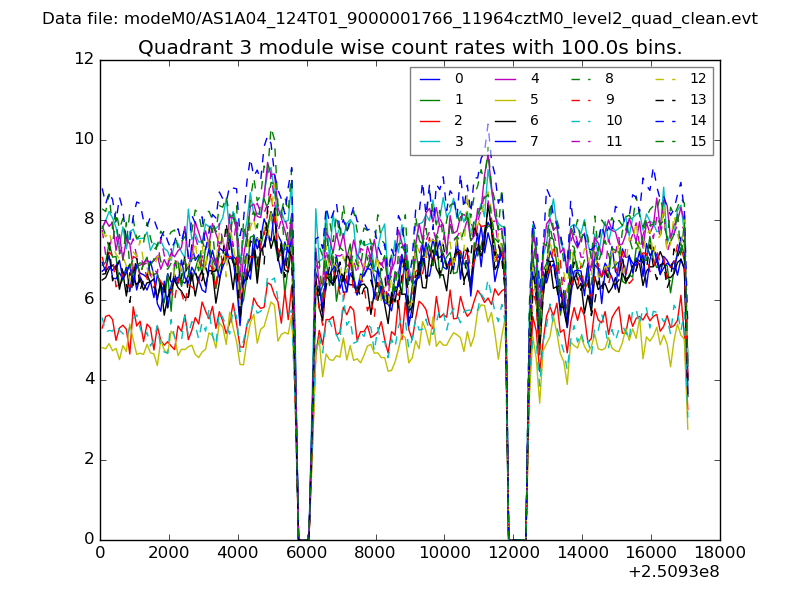
| Module-wise count rates for Quadrant A Data is divided into 100 sec bins |
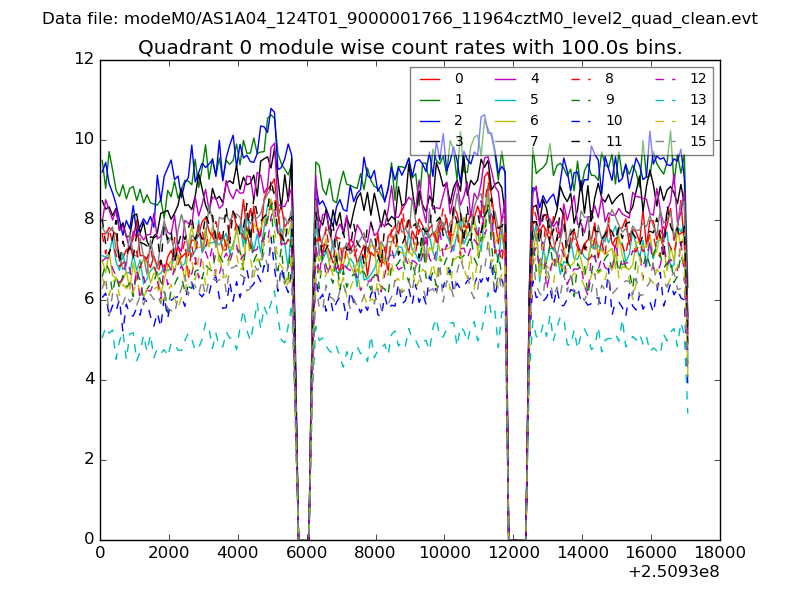 |
 |
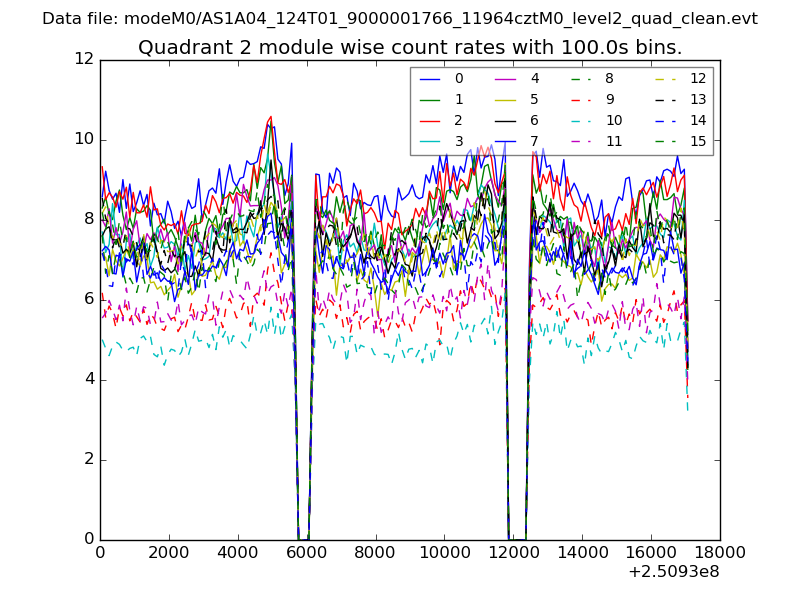
| Module-wise count rates for Quadrant B Data is divided into 100 sec bins |
 |
 |
| Module-wise count rates for Quadrant C Data is divided into 100 sec bins |
 |
 |
| Module-wise count rates for Quadrant D Data is divided into 100 sec bins |
 |
 |
| Parameter | Plot |
|---|---|
| CZT HV Monitor | 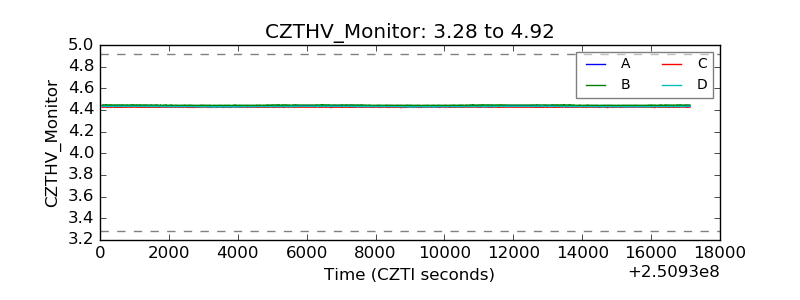 |
| D_VDD | 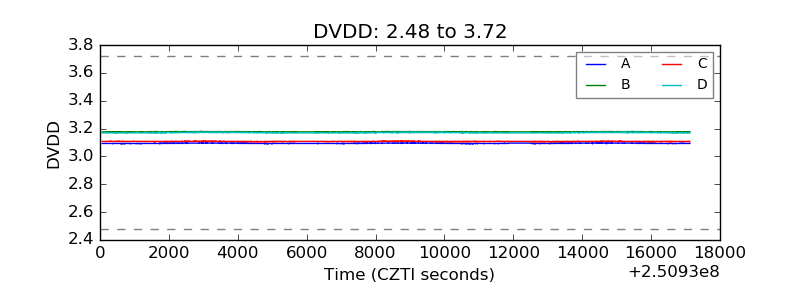 |
| Temperature 1 | 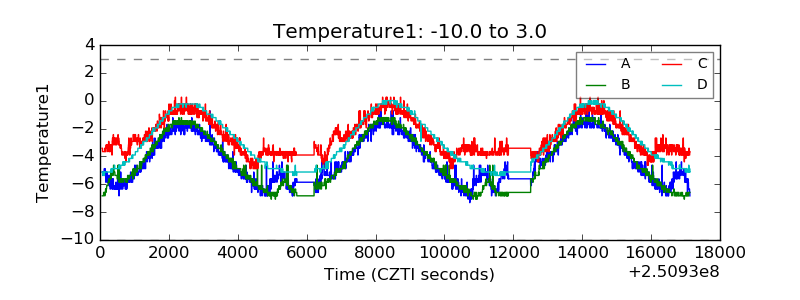 |
| Veto HV Monitor | 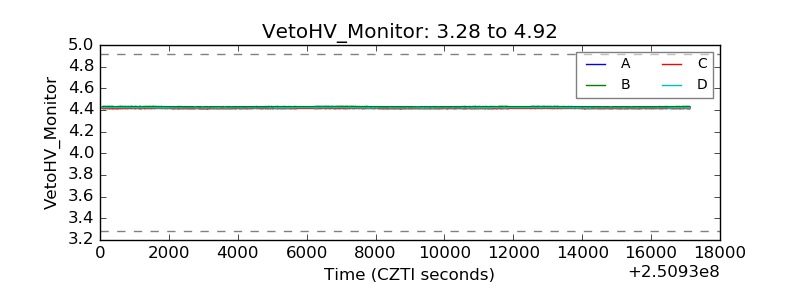 |
| Veto LLD | 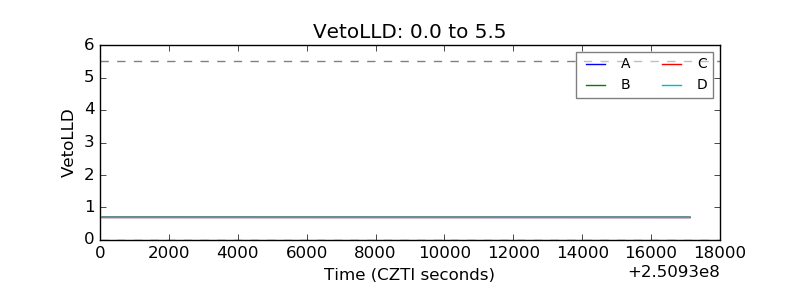 |
| Alpha Counter | 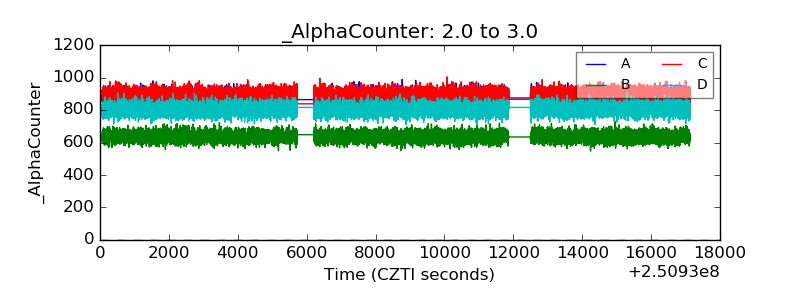 |
| _CPM_Rate | 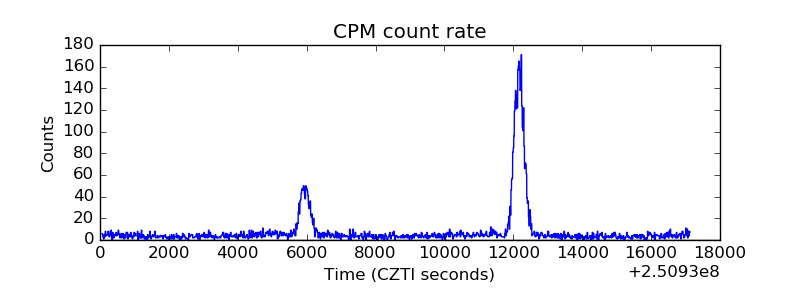 |
| CZT Counter | 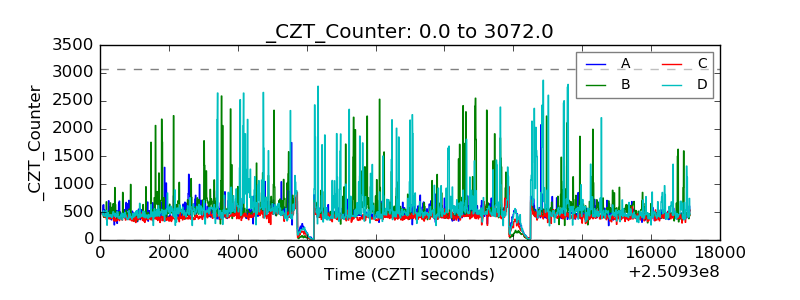 |
| +2.5 Volts monitor |  |
| +5 Volts monitor | 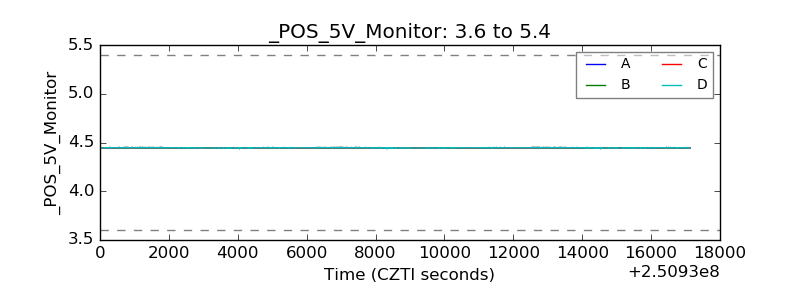 |
| _ROLL_ROT | 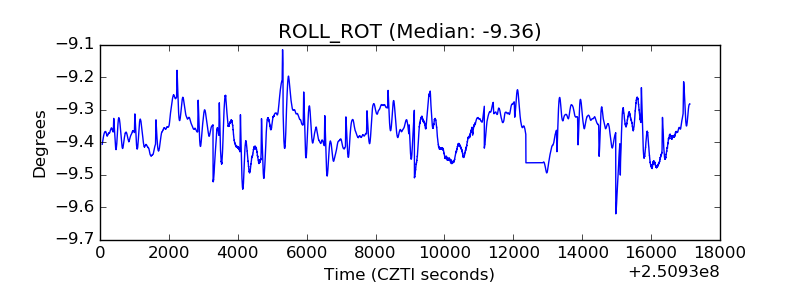 |
| _Roll_DEC | 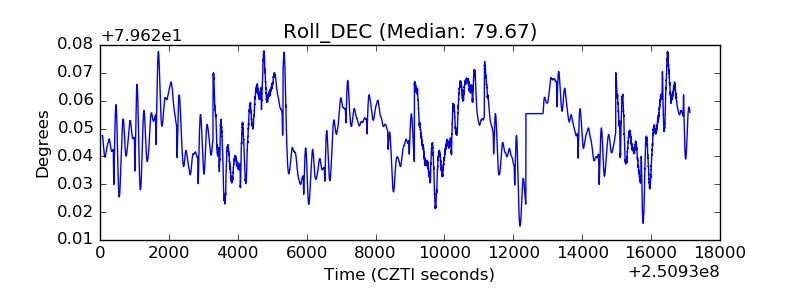 |
| _Roll_RA | 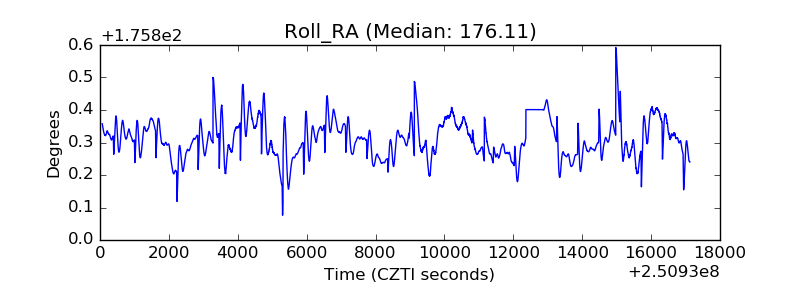 |
| Veto Counter | 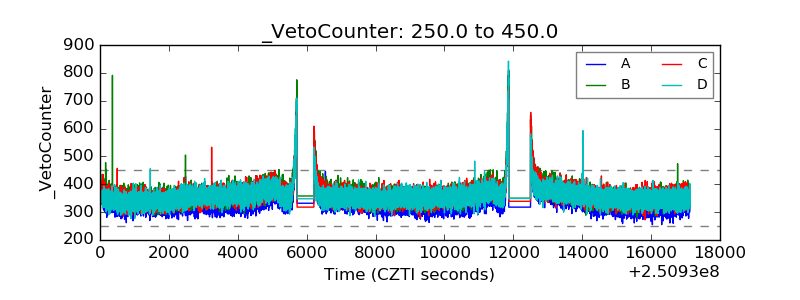 |