| Param | Original file | Final file |
|---|---|---|
| Filename | modeM0/AS1A04_164T01_9000001770cztM0_level2.fits | modeM0/AS1A04_164T01_9000001770cztM0_level2_quad_clean.evt |
| Size (bytes) | 171,881,280 | 108,820,800 |
| Size | 163.9 MB | 103.8 MB |
| Events in quadrant A | 1,047,510 | 548,706 |
| Events in quadrant B | 1,007,132 | 538,974 |
| Events in quadrant C | 1,044,950 | 519,745 |
| Events in quadrant D | 885,062 | 465,971 |
| Mode M0 | |||
|---|---|---|---|
| Quadrant | BADHDUFLAG | Total packets | Discarded packets |
| A | 0 | 38634 | 0 |
| B | 0 | 44844 | 0 |
| C | 0 | 36291 | 0 |
| D | 0 | 44596 | 0 |
| Mode SS | |||
|---|---|---|---|
| Quadrant | BADHDUFLAG | Total packets | Discarded packets |
| A | 0 | 364 | 0 |
| B | 0 | 364 | 0 |
| C | 0 | 364 | 0 |
| D | 0 | 364 | 0 |
| Mode M9 | |||
|---|---|---|---|
| Quadrant | BADHDUFLAG | Total packets | Discarded packets |
| A | 0 | 38 | 0 |
| B | 0 | 38 | 0 |
| C | 0 | 38 | 0 |
| D | 0 | 38 | 0 |
| Quadrant | Total seconds | Saturated seconds | Saturation percentage |
|---|---|---|---|
| A | 17701 | 202 | 1.141178% |
| B | 17701 | 755 | 4.265296% |
| C | 17701 | 62 | 0.350263% |
| D | 17701 | 434 | 2.451839% |
Noise dominated data is calculated using 1-second bins in cleaned event files. If a bin has >2000 counts, and if more than 50% of those come from <1% of pixels, then it is considered to be noise-dominated and hence unusable.
| Quadrant | # 1 sec bins | Bins with >0 counts | Bins with >2000 counts | High rate bins dominated by noise | Noise dominated (total time) | Noise dominated (detector-on time) | Marked lightcurve |
|---|---|---|---|---|---|---|---|
| A | 21521 | 17700 | 0 | 0 | 0.00% | 0.00% |  |
| B | 21521 | 17687 | 0 | 0 | 0.00% | 0.00% | 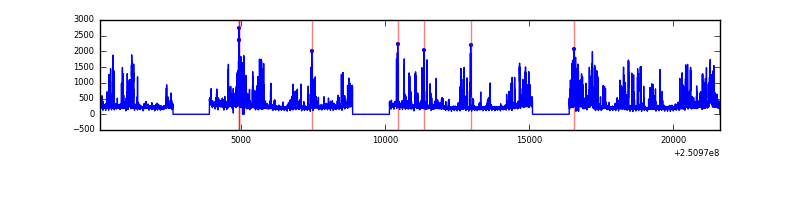 |
| C | 21520 | 17700 | 0 | 0 | 0.00% | 0.00% |  |
| D | 21521 | 17699 | 0 | 0 | 0.00% | 0.00% | 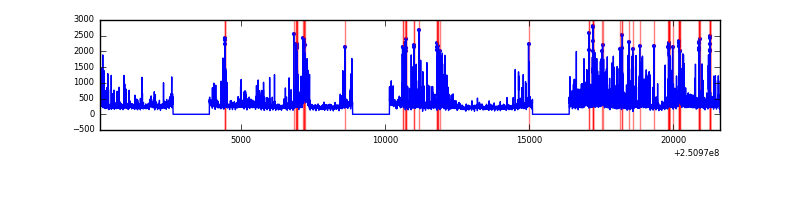 |
Top three noisy pixels from each quadrant. If the there are fewer than three noisy pixels in the level2.evt file, extra rows are filled as -1
| Pixel properties | Quadrant properties | ||||||
|---|---|---|---|---|---|---|---|
| Quadrant | DetID | PixID | Counts | Sigma | Mean | Median | Sigma |
| A | 0 | 29 | 1021 | 10.84 | 273 | 256 | 70.6 |
| A | 7 | 110 | 831 | 8.15 | 273 | 256 | 70.6 |
| A | 0 | 30 | 779 | 7.41 | 273 | 256 | 70.6 |
| B | 2 | 9 | 921 | 12.11 | 266 | 254 | 55.1 |
| B | 5 | 128 | 676 | 7.66 | 266 | 254 | 55.1 |
| B | 2 | 8 | 671 | 7.57 | 266 | 254 | 55.1 |
| C | 1 | 81 | 751 | 6.71 | 275 | 258 | 73.4 |
| C | 1 | 80 | 734 | 6.48 | 275 | 258 | 73.4 |
| C | 12 | 241 | 729 | 6.41 | 275 | 258 | 73.4 |
| D | 3 | 14 | 661 | 6.39 | 252 | 231 | 67.3 |
| D | 7 | 5 | 650 | 6.22 | 252 | 231 | 67.3 |
| D | 3 | 159 | 629 | 5.91 | 252 | 231 | 67.3 |
Histogram calculated using DETX and DETY for each event in the final _common_clean file
| Quadrant A | 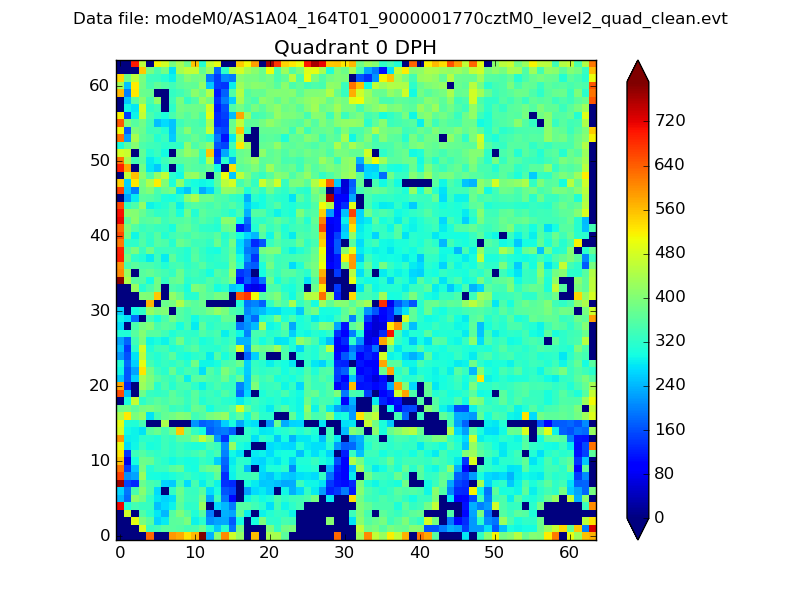 |
 |
Quadrant B |
|---|---|---|---|
| Quadrant D | 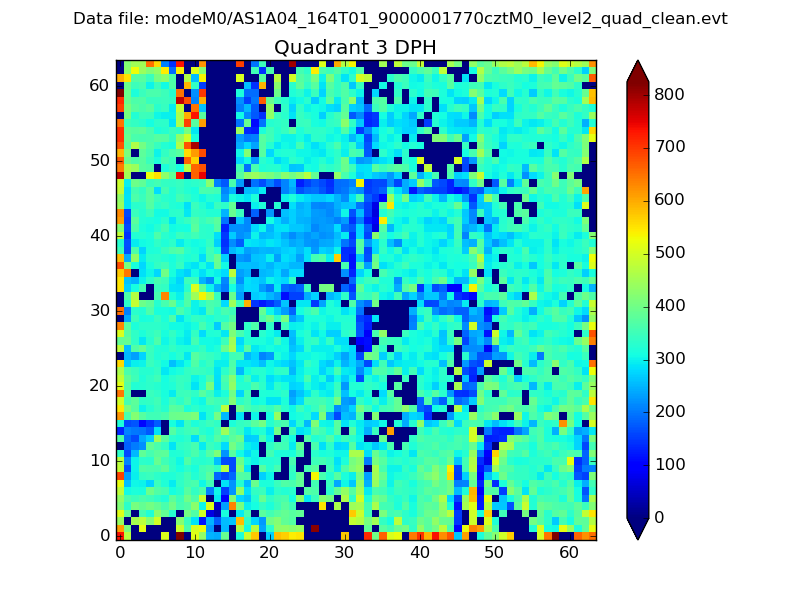 |
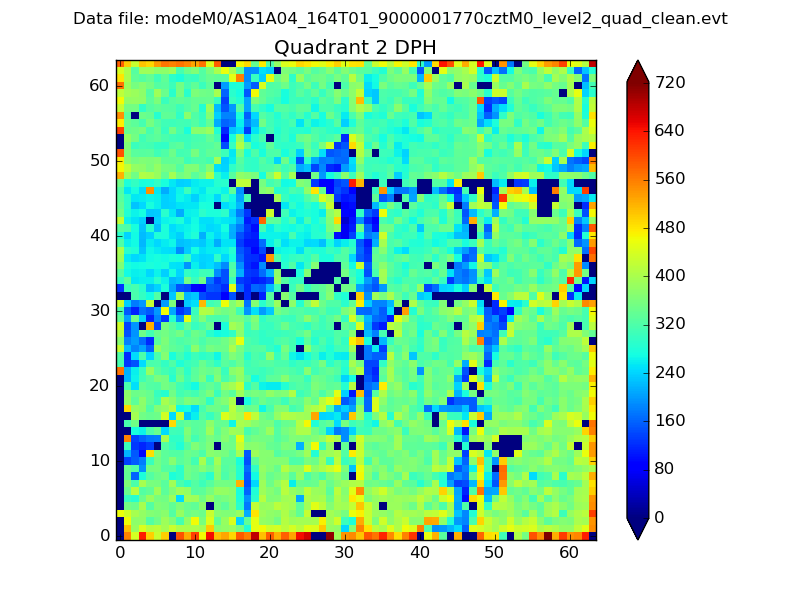 |
Quadrant C |
| Plot type | Count rate plots | Images |
|---|---|---|
| Comparison with Poisson distribution Blue bars denote a histogram of data divided into 1 sec bins. Red curve is a Poisson curve with rate = median count rate of data. |
 |
 |
| Quadrant-wise count rates Data is divided into 100 sec bins |
 |
|
| Module-wise count rates for Quadrant A Data is divided into 100 sec bins |
 |
 |
| Module-wise count rates for Quadrant B Data is divided into 100 sec bins |
 |
 |
| Module-wise count rates for Quadrant C Data is divided into 100 sec bins |
 |
 |
| Module-wise count rates for Quadrant D Data is divided into 100 sec bins |
 |
 |
| Parameter | Plot |
|---|---|
| CZT HV Monitor |  |
| D_VDD |  |
| Temperature 1 | 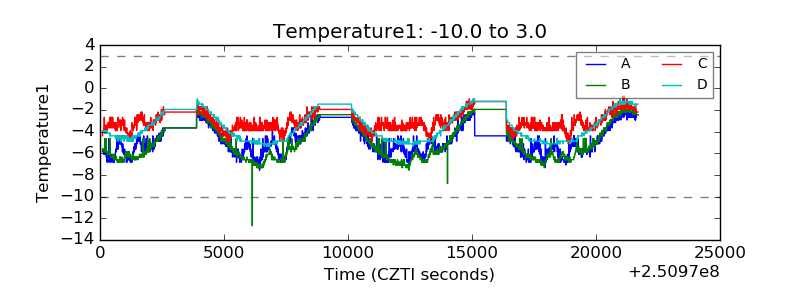 |
| Veto HV Monitor |  |
| Veto LLD | 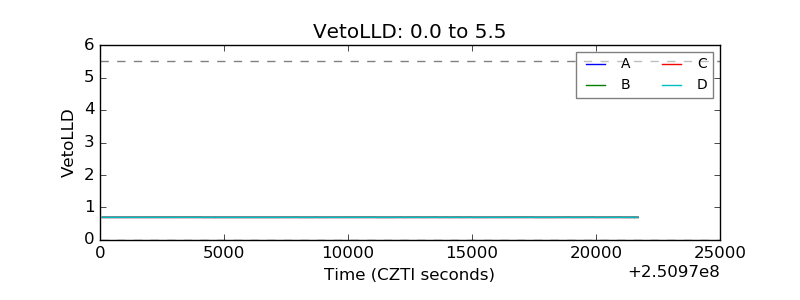 |
| Alpha Counter |  |
| _CPM_Rate | 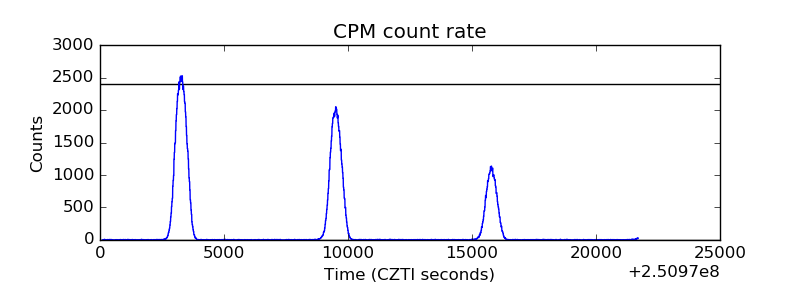 |
| CZT Counter | 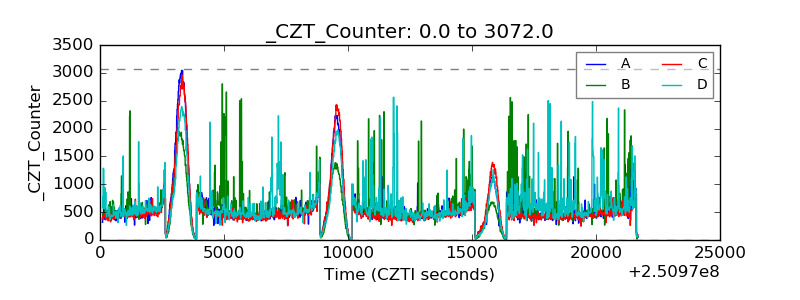 |
| +2.5 Volts monitor |  |
| +5 Volts monitor |  |
| _ROLL_ROT |  |
| _Roll_DEC | 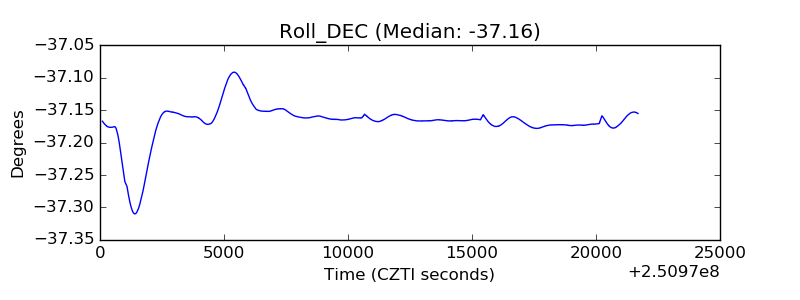 |
| _Roll_RA |  |
| Veto Counter |  |