| Param | Original file | Final file |
|---|---|---|
| Filename | modeM0/AS1A04_164T01_9000001770_11969cztM0_level2.evt | modeM0/AS1A04_164T01_9000001770_11969cztM0_level2_quad_clean.evt |
| Size (bytes) | 301,870,080 | 47,646,720 |
| Size | 287.9 MB | 45.4 MB |
| Events in quadrant A | 2,112,419 | 298,292 |
| Events in quadrant B | 2,628,615 | 295,017 |
| Events in quadrant C | 1,878,381 | 292,293 |
| Events in quadrant D | 2,252,902 | 277,710 |
| Mode M0 | |||
|---|---|---|---|
| Quadrant | BADHDUFLAG | Total packets | Discarded packets |
| A | 0 | 8796 | 2 |
| B | 0 | 10314 | 1 |
| C | 0 | 8154 | 1 |
| D | 0 | 9127 | 1 |
| Mode SS | |||
|---|---|---|---|
| Quadrant | BADHDUFLAG | Total packets | Discarded packets |
| A | 0 | 82 | 0 |
| B | 0 | 82 | 0 |
| C | 0 | 82 | 0 |
| D | 0 | 82 | 0 |
| Mode M9 | |||
|---|---|---|---|
| Quadrant | BADHDUFLAG | Total packets | Discarded packets |
| A | 0 | 12 | 0 |
| B | 0 | 12 | 0 |
| C | 0 | 12 | 0 |
| D | 0 | 12 | 0 |
| Quadrant | Total seconds | Saturated seconds | Saturation percentage |
|---|---|---|---|
| A | 3951 | 69 | 1.746393% |
| B | 3951 | 208 | 5.264490% |
| C | 3951 | 19 | 0.480891% |
| D | 3951 | 55 | 1.392053% |
Noise dominated data is calculated using 1-second bins in cleaned event files. If a bin has >2000 counts, and if more than 50% of those come from <1% of pixels, then it is considered to be noise-dominated and hence unusable.
| Quadrant | # 1 sec bins | Bins with >0 counts | Bins with >2000 counts | High rate bins dominated by noise | Noise dominated (total time) | Noise dominated (detector-on time) | Marked lightcurve |
|---|---|---|---|---|---|---|---|
| A | 5217 | 3953 | 4 | 4 | 0.08% | 0.10% | 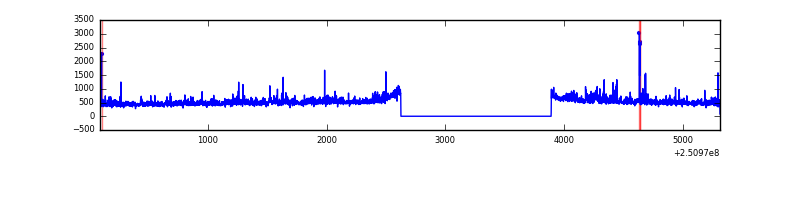 |
| B | 5217 | 3952 | 108 | 108 | 2.07% | 2.73% | 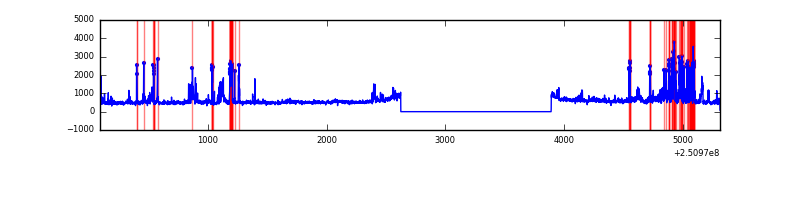 |
| C | 5217 | 3953 | 0 | 0 | 0.00% | 0.00% | 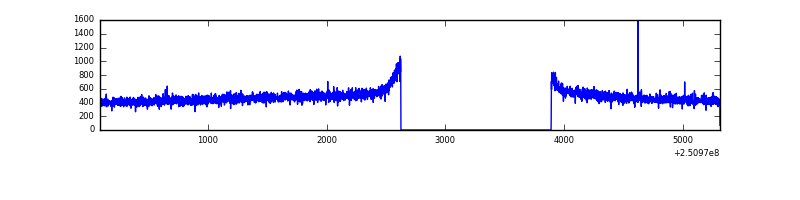 |
| D | 5217 | 3953 | 28 | 28 | 0.54% | 0.71% | 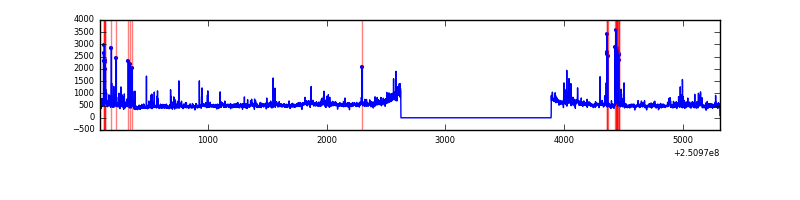 |
Top three noisy pixels from each quadrant. If the there are fewer than three noisy pixels in the level2.evt file, extra rows are filled as -1
| Pixel properties | Quadrant properties | ||||||
|---|---|---|---|---|---|---|---|
| Quadrant | DetID | PixID | Counts | Sigma | Mean | Median | Sigma |
| A | 1 | 162 | 68615 | 675.85 | 496 | 487 | 100.8 |
| A | 1 | 178 | 37152 | 363.73 | 496 | 487 | 100.8 |
| A | 1 | 161 | 32307 | 315.66 | 496 | 487 | 100.8 |
| B | 4 | 239 | 524043 | 5598.03 | 491 | 480 | 93.5 |
| B | 15 | 204 | 57271 | 607.22 | 491 | 480 | 93.5 |
| B | 0 | 218 | 44117 | 466.57 | 491 | 480 | 93.5 |
| C | 13 | 61 | 3502 | 26.96 | 481 | 483 | 112.0 |
| C | 14 | 234 | 2437 | 17.45 | 481 | 483 | 112.0 |
| C | 3 | 202 | 1224 | 6.62 | 481 | 483 | 112.0 |
| D | 8 | 195 | 144171 | 1253.57 | 474 | 461 | 114.6 |
| D | 13 | 104 | 70399 | 610.06 | 474 | 461 | 114.6 |
| D | 1 | 52 | 56510 | 488.91 | 474 | 461 | 114.6 |
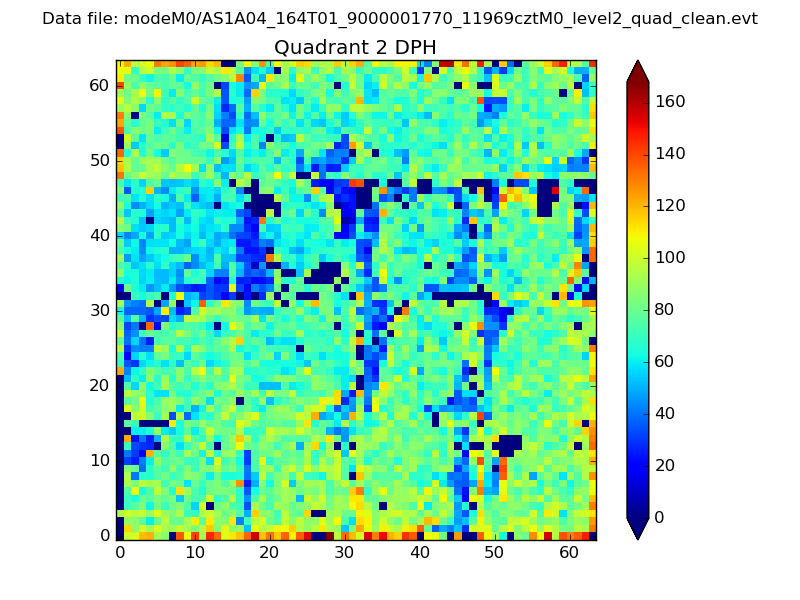
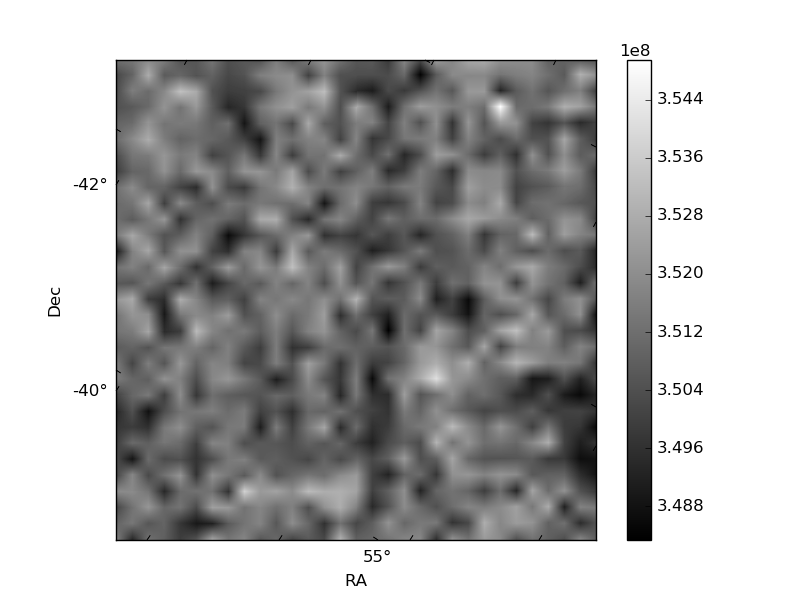
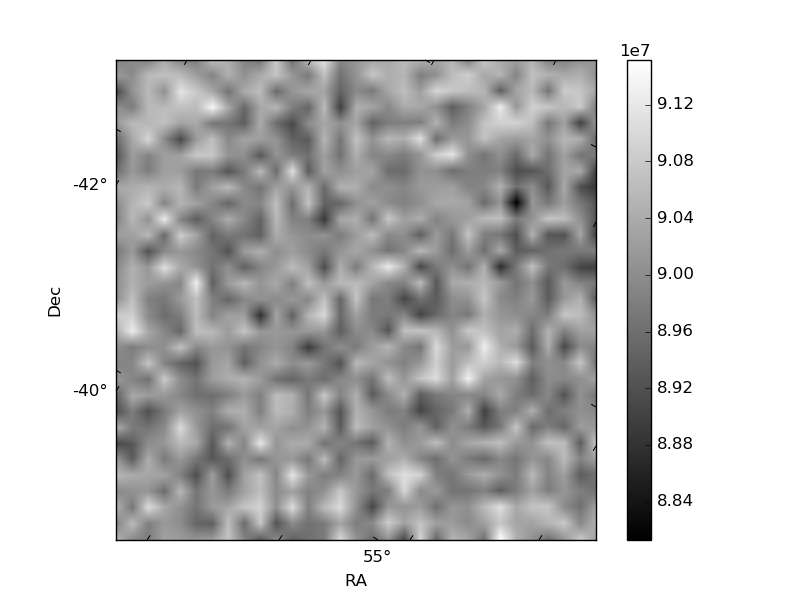
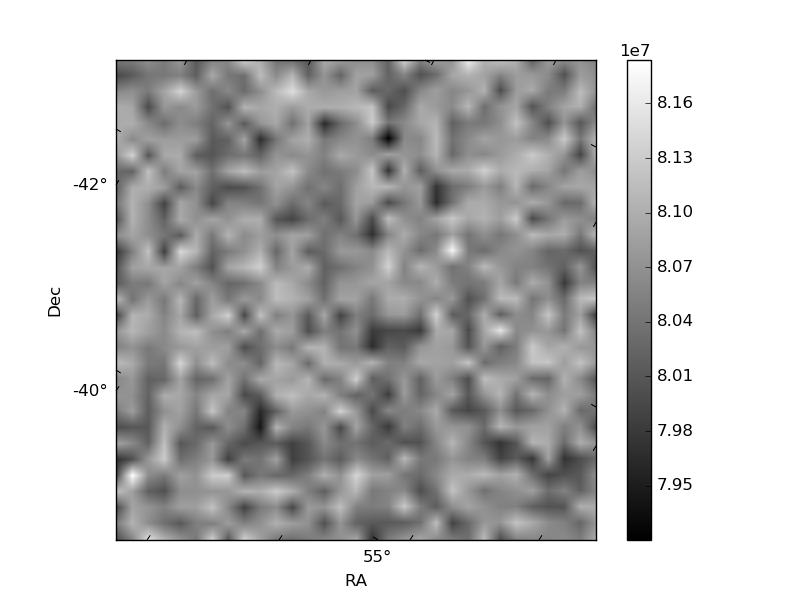
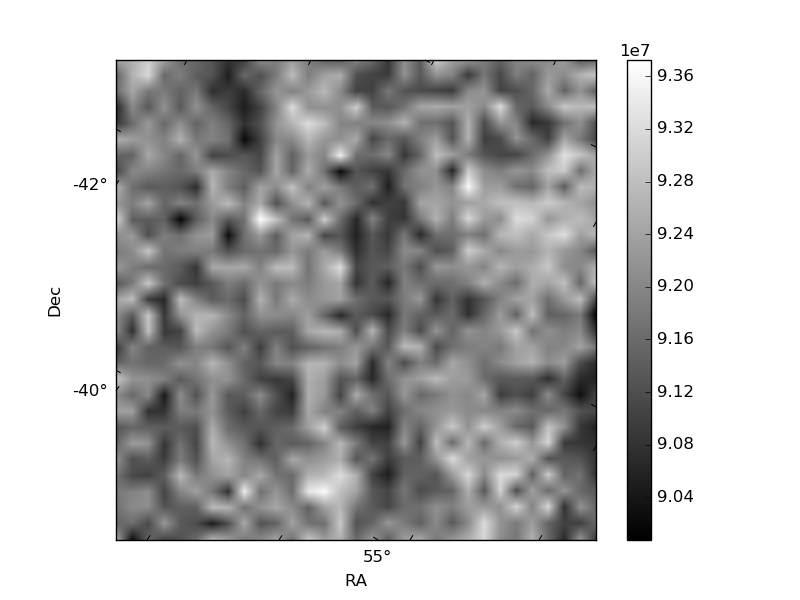
Histogram calculated using DETX and DETY for each event in the final _common_clean file
| Quadrant A | 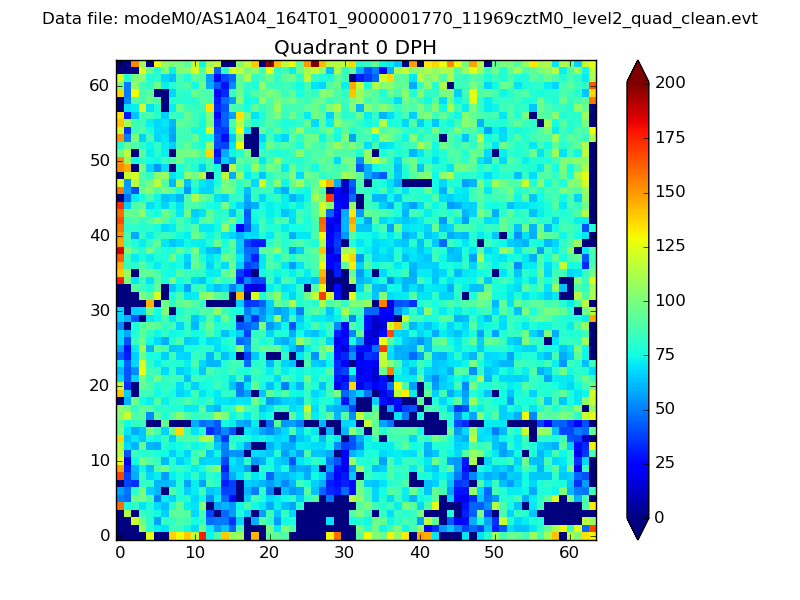 |
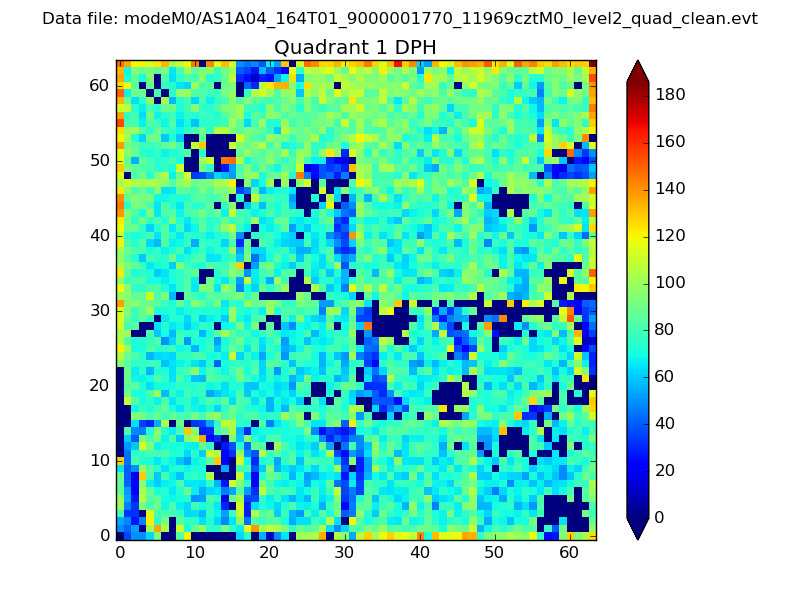 |
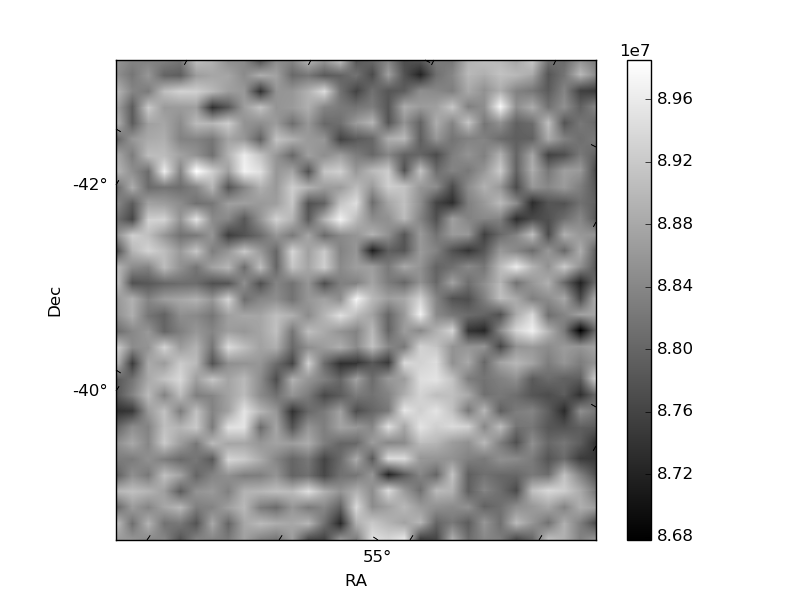
Quadrant B |
|---|---|---|---|
| Quadrant D | 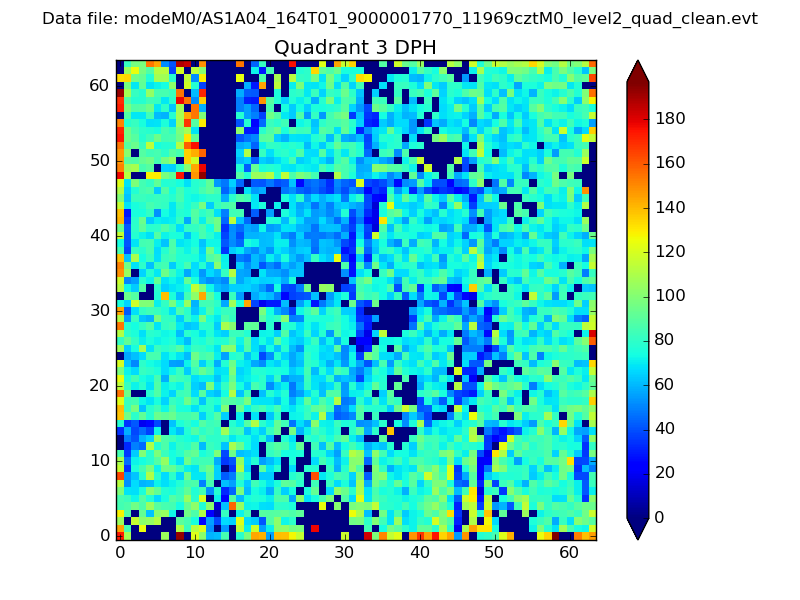 |
 |
Quadrant C |
| Plot type | Count rate plots | Images |
|---|---|---|
| Comparison with Poisson distribution Blue bars denote a histogram of data divided into 1 sec bins. Red curve is a Poisson curve with rate = median count rate of data. |
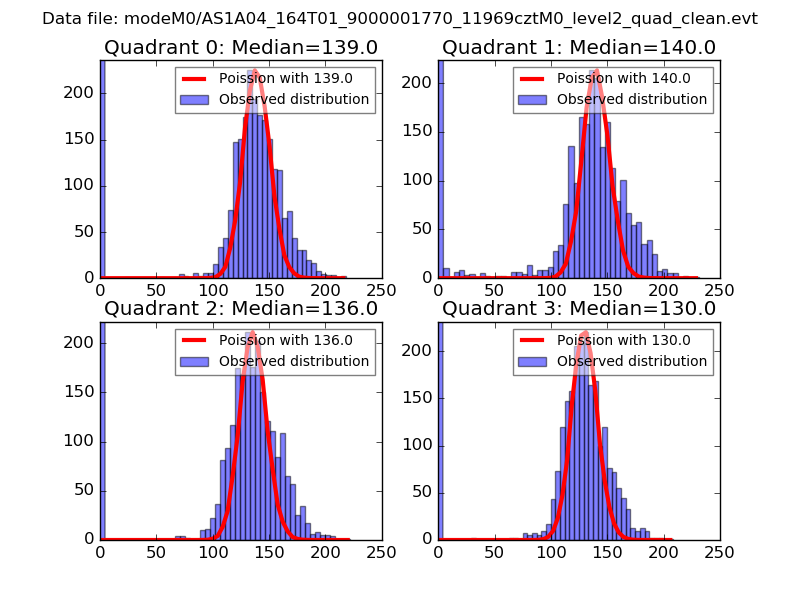 |
 |
| Quadrant-wise count rates Data is divided into 100 sec bins |
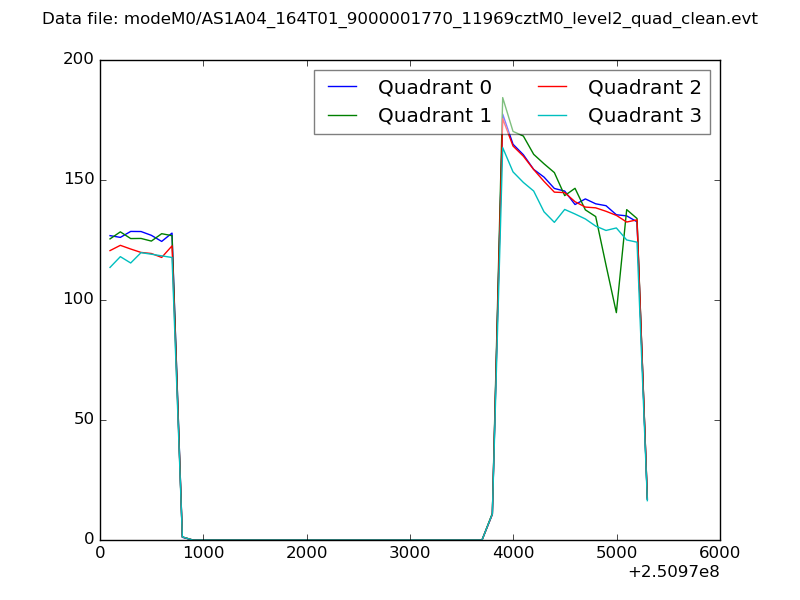 |
|
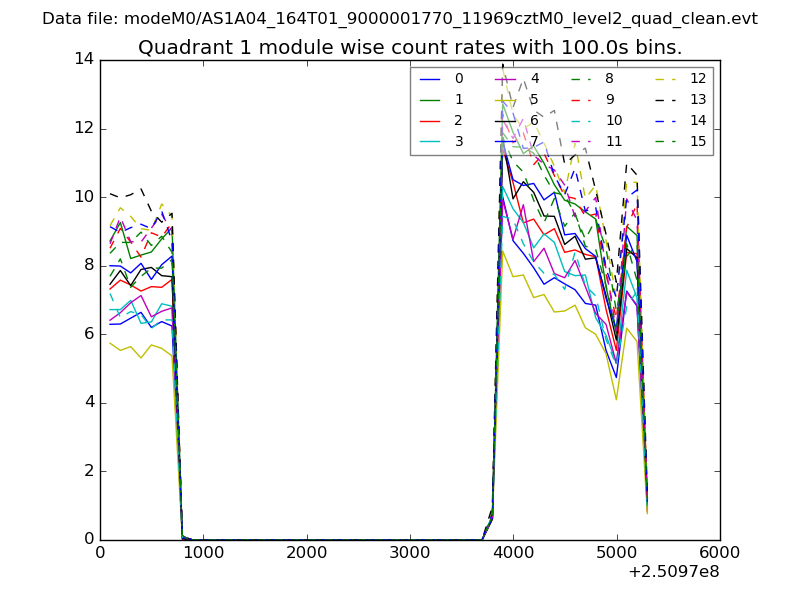
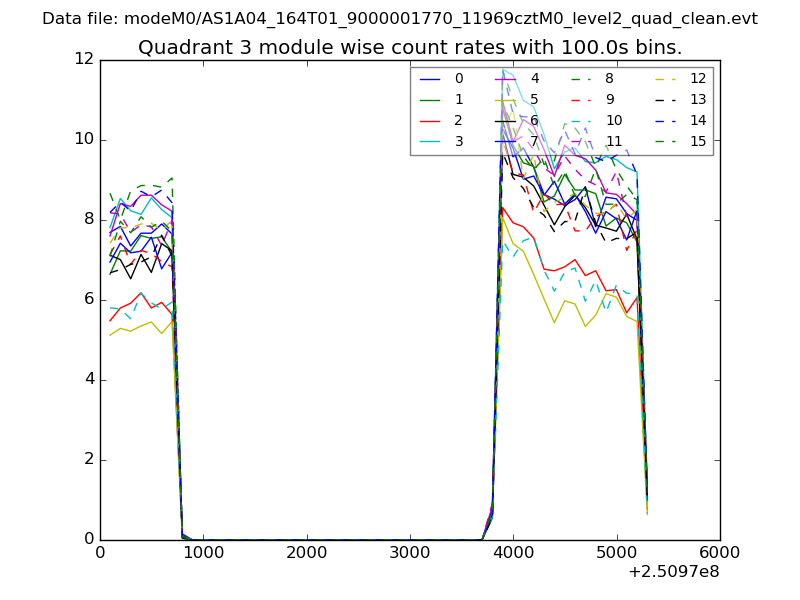
| Module-wise count rates for Quadrant A Data is divided into 100 sec bins |
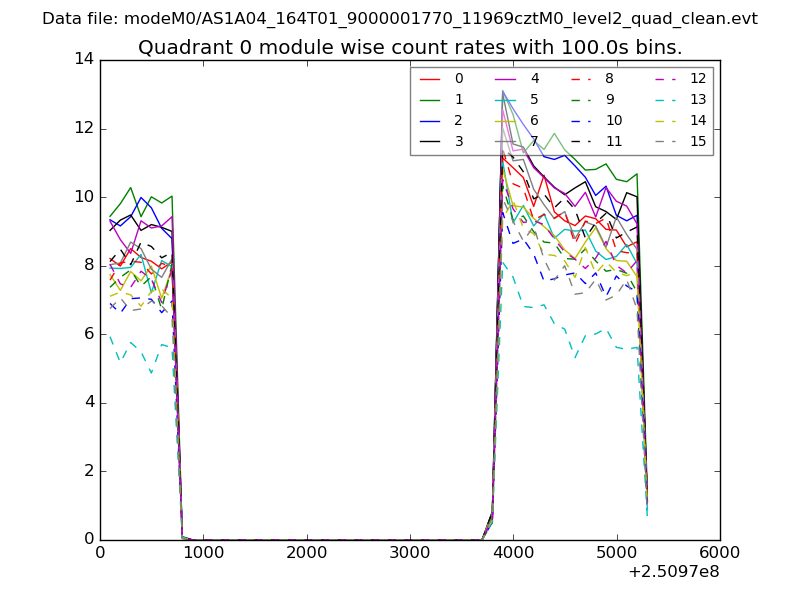 |
 |
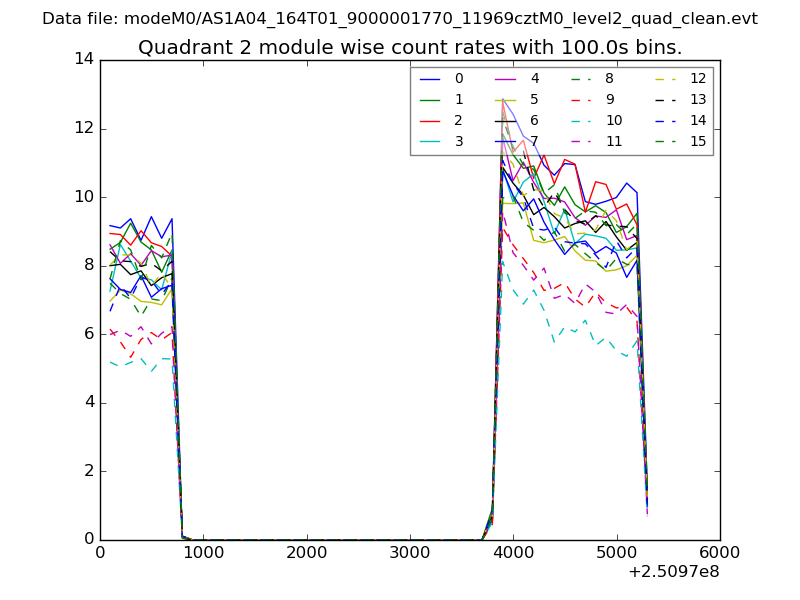
| Module-wise count rates for Quadrant B Data is divided into 100 sec bins |
 |
 |
| Module-wise count rates for Quadrant C Data is divided into 100 sec bins |
 |
 |
| Module-wise count rates for Quadrant D Data is divided into 100 sec bins |
 |
 |
| Parameter | Plot |
|---|---|
| CZT HV Monitor | 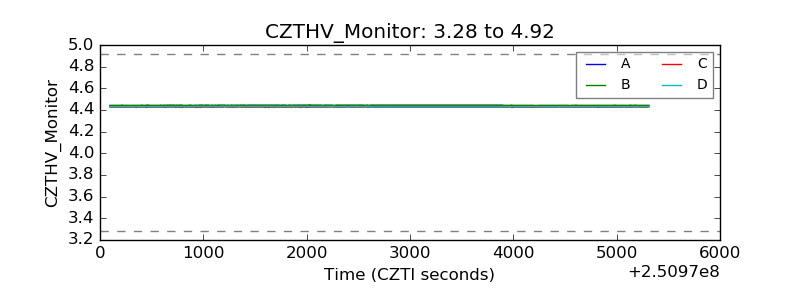 |
| D_VDD | 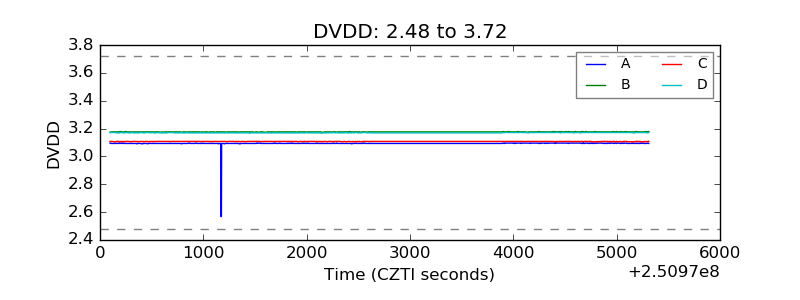 |
| Temperature 1 | 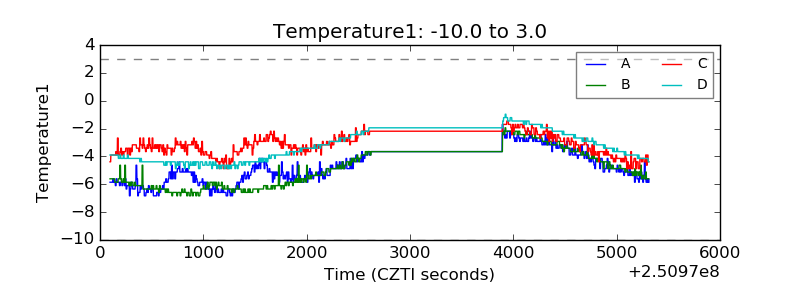 |
| Veto HV Monitor | 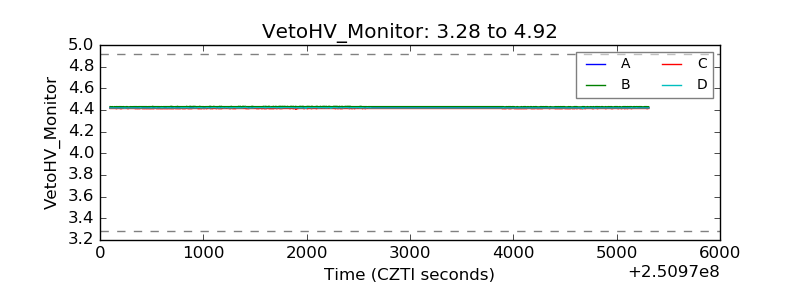 |
| Veto LLD | 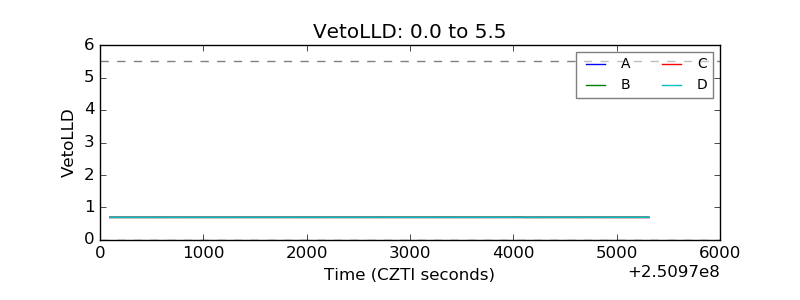 |
| Alpha Counter | 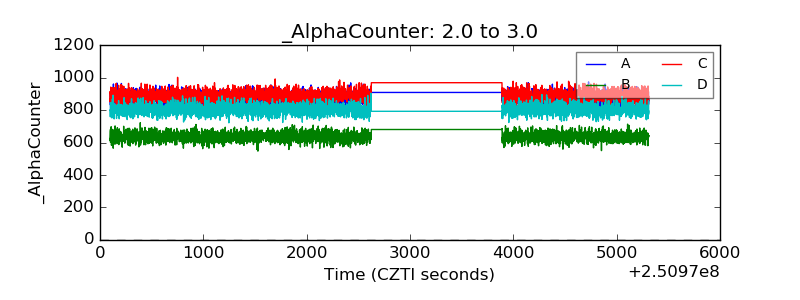 |
| _CPM_Rate | 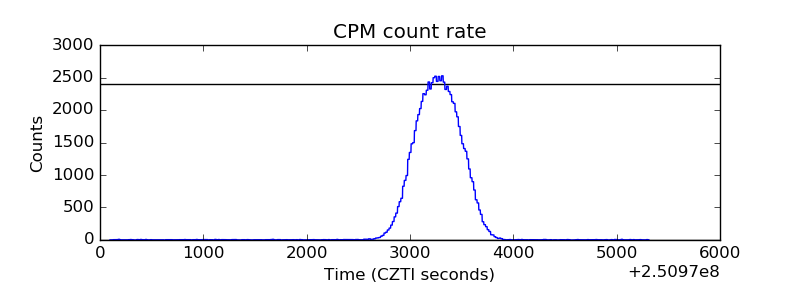 |
| CZT Counter | 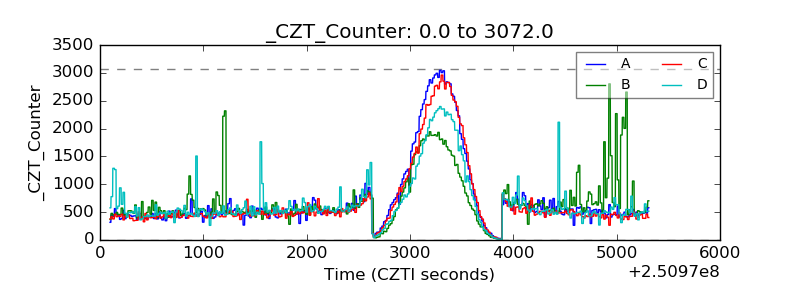 |
| +2.5 Volts monitor |  |
| +5 Volts monitor |  |
| _ROLL_ROT | 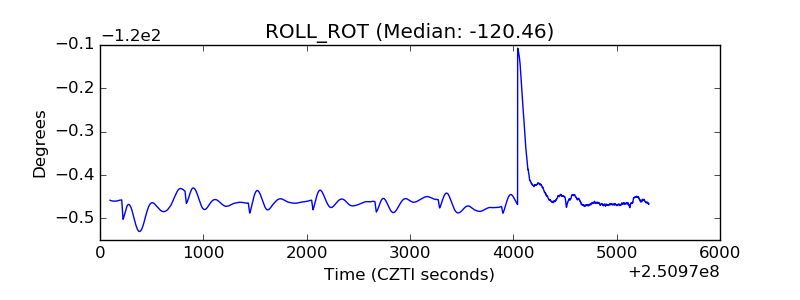 |
| _Roll_DEC | 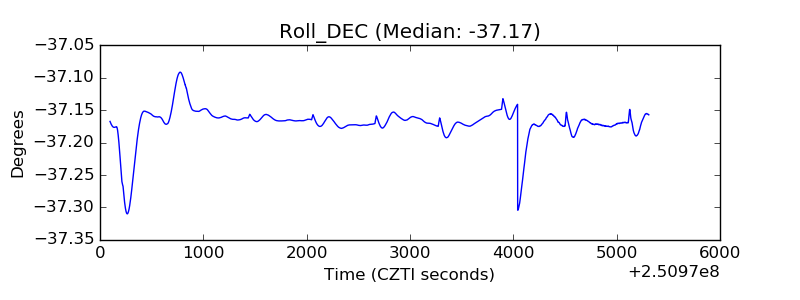 |
| _Roll_RA | 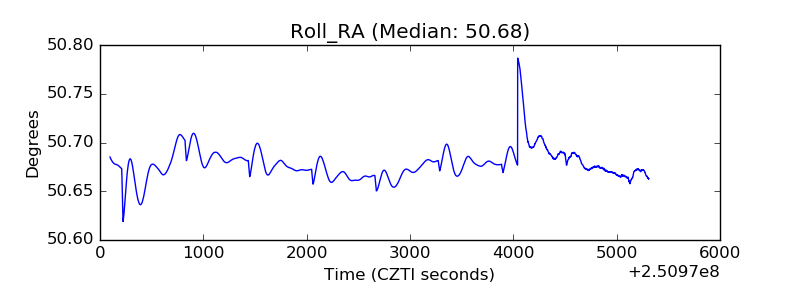 |
| Veto Counter | 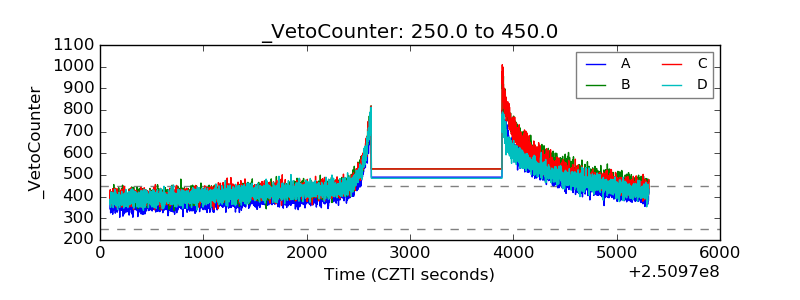 |