| Param | Original file | Final file |
|---|---|---|
| Filename | modeM0/AS1A04_164T01_9000001770_11970cztM0_level2.evt | modeM0/AS1A04_164T01_9000001770_11970cztM0_level2_quad_clean.evt |
| Size (bytes) | 470,554,560 | 87,857,280 |
| Size | 448.8 MB | 83.8 MB |
| Events in quadrant A | 3,183,798 | 570,034 |
| Events in quadrant B | 3,946,246 | 569,293 |
| Events in quadrant C | 2,882,440 | 563,136 |
| Events in quadrant D | 3,819,883 | 527,897 |
| Mode M0 | |||
|---|---|---|---|
| Quadrant | BADHDUFLAG | Total packets | Discarded packets |
| A | 0 | 13538 | 3 |
| B | 0 | 15791 | 2 |
| C | 0 | 12712 | 2 |
| D | 0 | 15352 | 2 |
| Mode SS | |||
|---|---|---|---|
| Quadrant | BADHDUFLAG | Total packets | Discarded packets |
| A | 0 | 126 | 0 |
| B | 0 | 126 | 0 |
| C | 0 | 126 | 0 |
| D | 0 | 126 | 0 |
| Mode M9 | |||
|---|---|---|---|
| Quadrant | BADHDUFLAG | Total packets | Discarded packets |
| A | 0 | 19 | 0 |
| B | 0 | 19 | 0 |
| C | 0 | 19 | 0 |
| D | 0 | 20 | 0 |
| Quadrant | Total seconds | Saturated seconds | Saturation percentage |
|---|---|---|---|
| A | 6160 | 74 | 1.201299% |
| B | 6160 | 267 | 4.334416% |
| C | 6160 | 31 | 0.503247% |
| D | 6160 | 169 | 2.743506% |
Noise dominated data is calculated using 1-second bins in cleaned event files. If a bin has >2000 counts, and if more than 50% of those come from <1% of pixels, then it is considered to be noise-dominated and hence unusable.
| Quadrant | # 1 sec bins | Bins with >0 counts | Bins with >2000 counts | High rate bins dominated by noise | Noise dominated (total time) | Noise dominated (detector-on time) | Marked lightcurve |
|---|---|---|---|---|---|---|---|
| A | 7441 | 6161 | 5 | 5 | 0.07% | 0.08% | 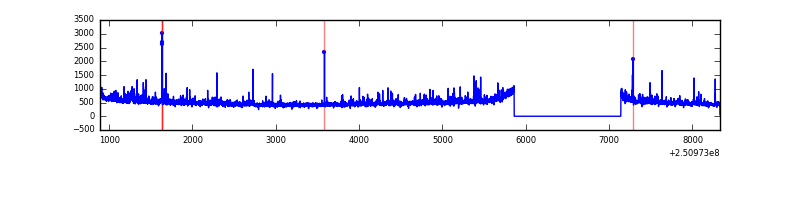 |
| B | 7441 | 6161 | 130 | 130 | 1.75% | 2.11% | 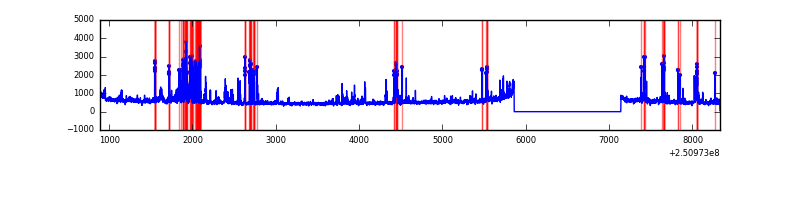 |
| C | 7441 | 6162 | 0 | 0 | 0.00% | 0.00% | 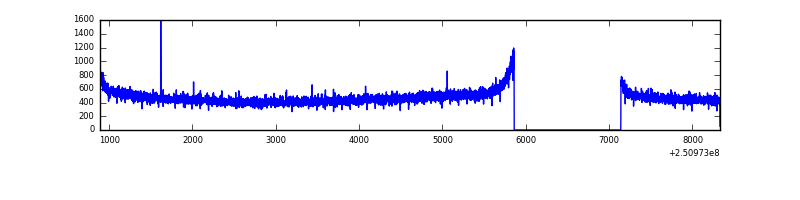 |
| D | 7441 | 6162 | 114 | 114 | 1.53% | 1.85% | 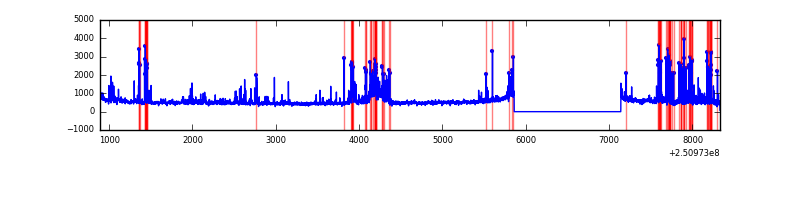 |
Top three noisy pixels from each quadrant. If the there are fewer than three noisy pixels in the level2.evt file, extra rows are filled as -1
| Pixel properties | Quadrant properties | ||||||
|---|---|---|---|---|---|---|---|
| Quadrant | DetID | PixID | Counts | Sigma | Mean | Median | Sigma |
| A | 1 | 162 | 92450 | 594.79 | 763 | 750 | 154.2 |
| A | 1 | 178 | 47030 | 300.19 | 763 | 750 | 154.2 |
| A | 1 | 161 | 41439 | 263.92 | 763 | 750 | 154.2 |
| B | 4 | 239 | 723691 | 5033.27 | 760 | 743 | 143.6 |
| B | 15 | 204 | 90253 | 623.18 | 760 | 743 | 143.6 |
| B | 11 | 51 | 64219 | 441.93 | 760 | 743 | 143.6 |
| C | 13 | 61 | 5408 | 27.36 | 738 | 742 | 170.5 |
| C | 14 | 234 | 3224 | 14.55 | 738 | 742 | 170.5 |
| C | 0 | 207 | 2197 | 8.53 | 738 | 742 | 170.5 |
| D | 1 | 52 | 639366 | 3670.33 | 721 | 700 | 174.0 |
| D | 8 | 195 | 163092 | 933.25 | 721 | 700 | 174.0 |
| D | 10 | 199 | 74539 | 424.34 | 721 | 700 | 174.0 |
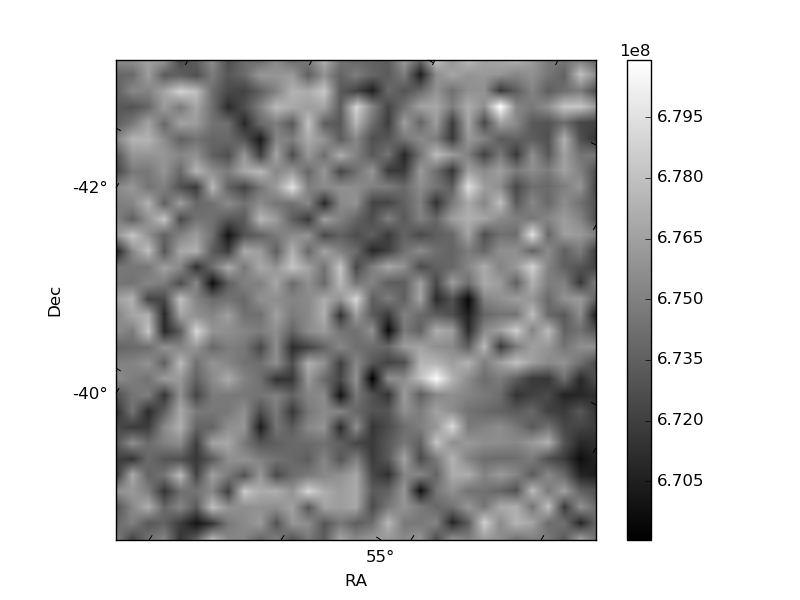
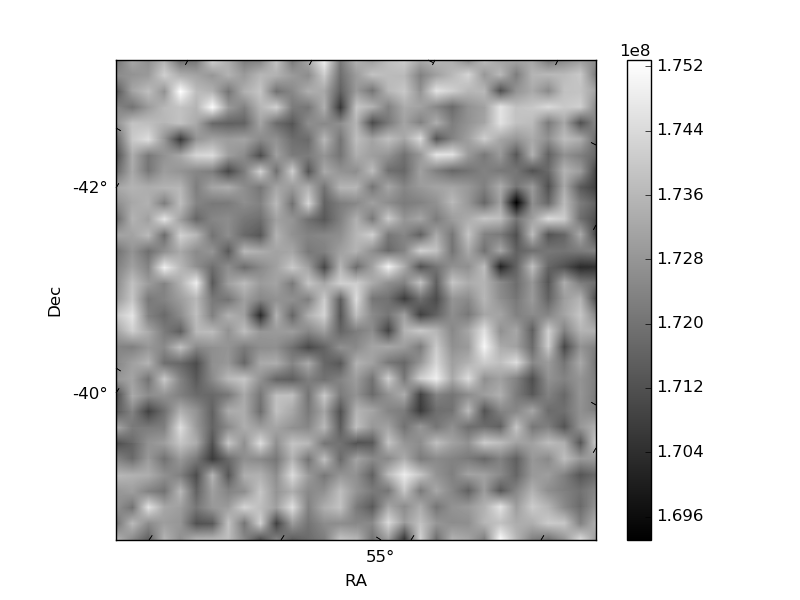
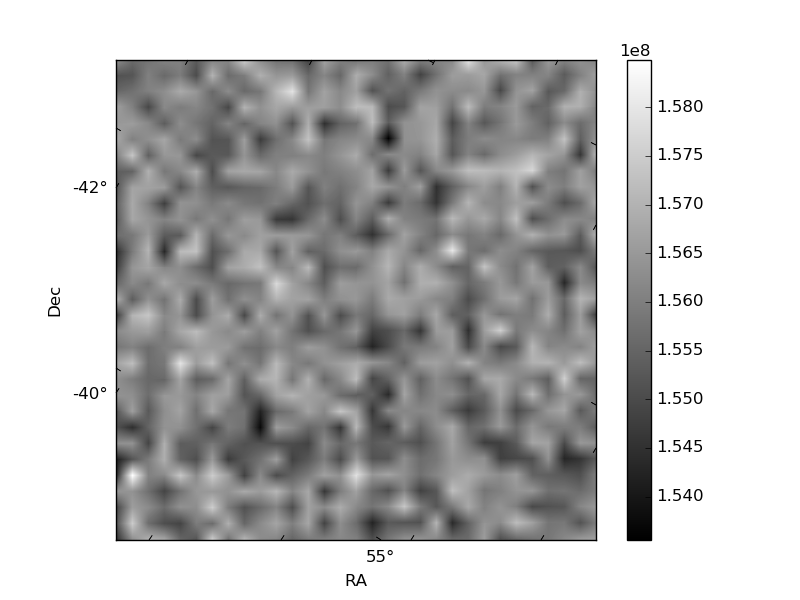
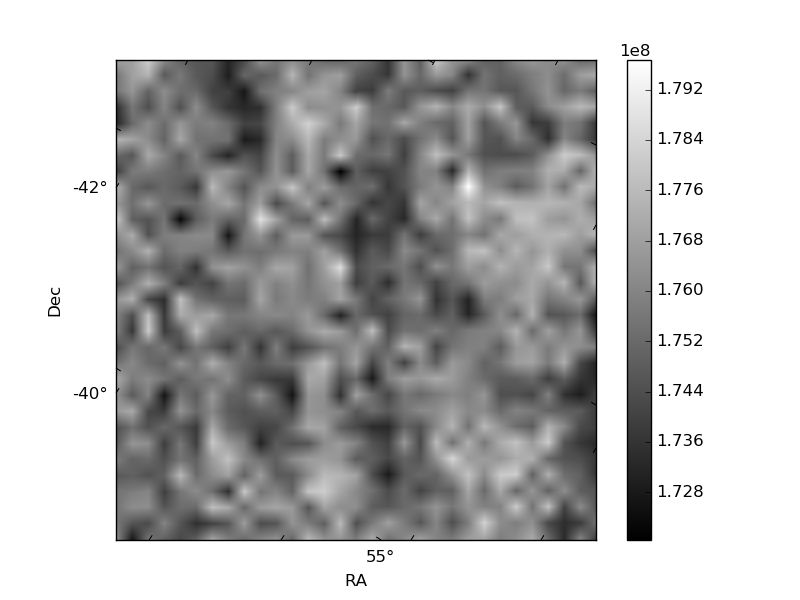
Histogram calculated using DETX and DETY for each event in the final _common_clean file
| Quadrant A | 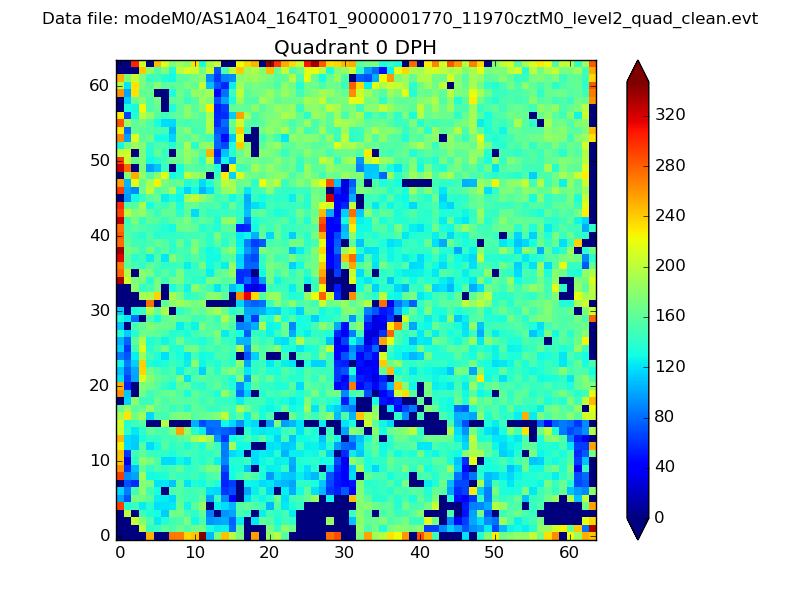 |
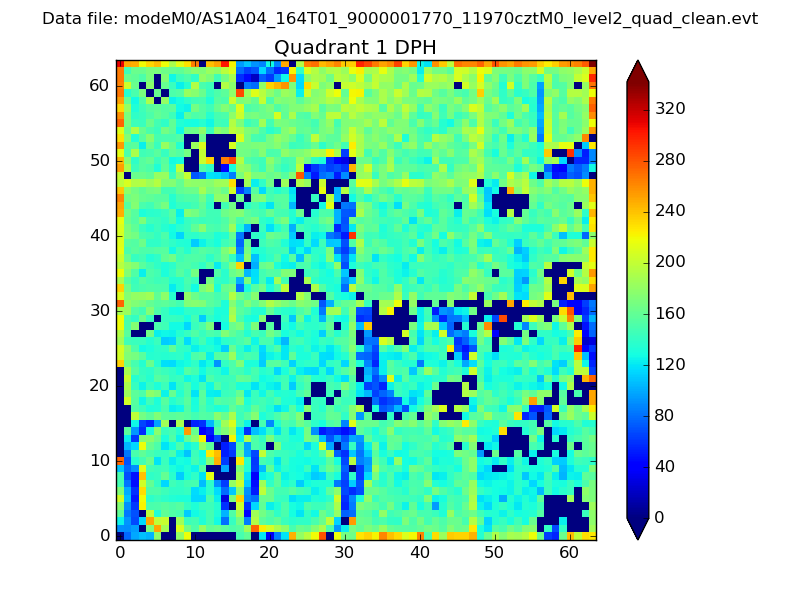 |
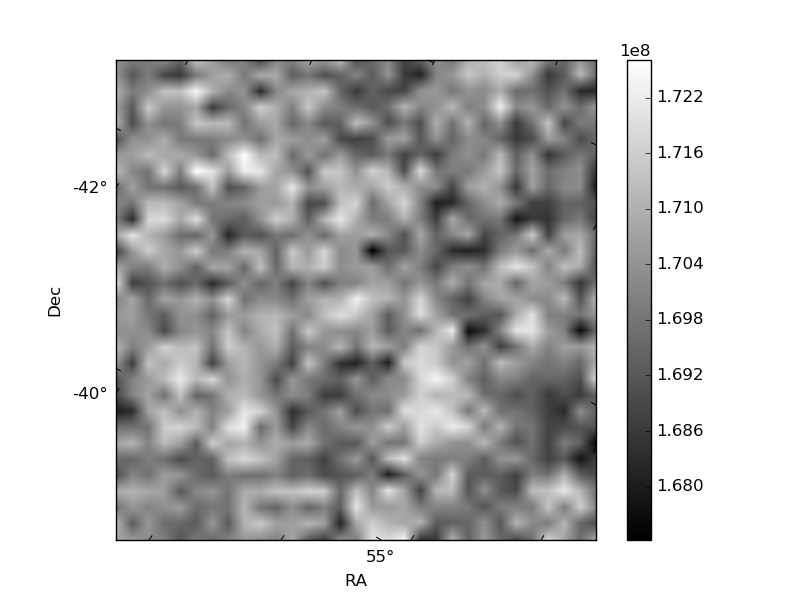
Quadrant B |
|---|---|---|---|
| Quadrant D | 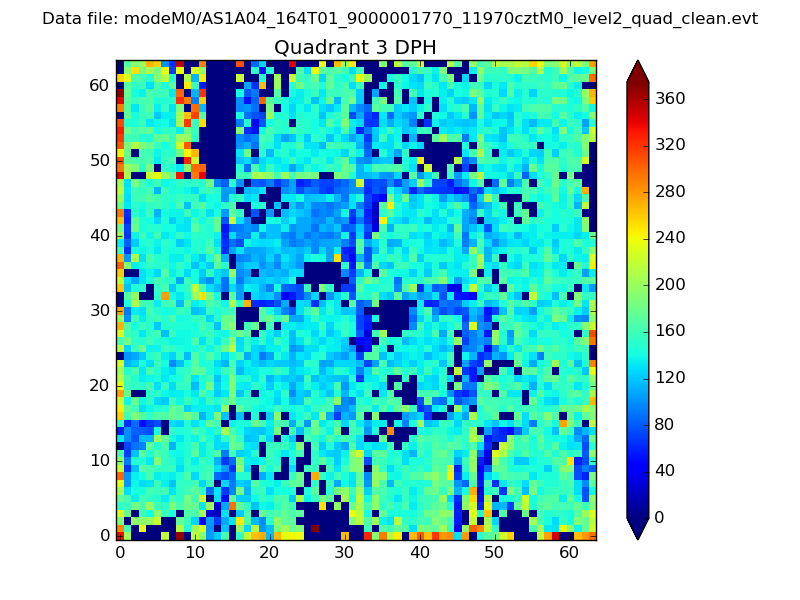 |
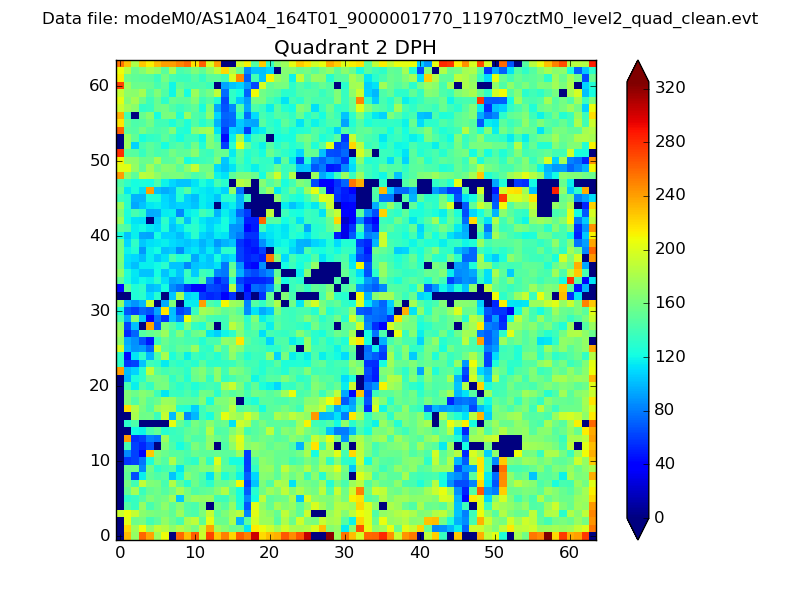 |
Quadrant C |
| Plot type | Count rate plots | Images |
|---|---|---|
| Comparison with Poisson distribution Blue bars denote a histogram of data divided into 1 sec bins. Red curve is a Poisson curve with rate = median count rate of data. |
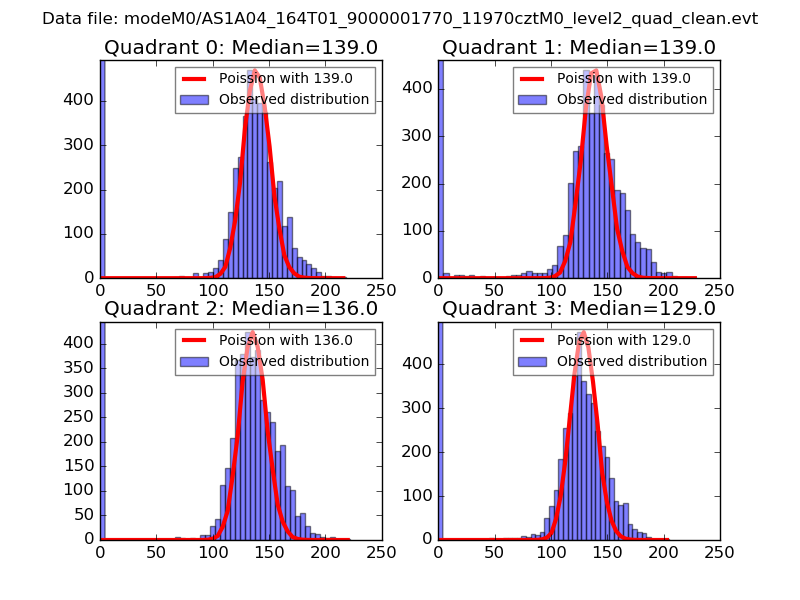 |
 |
| Quadrant-wise count rates Data is divided into 100 sec bins |
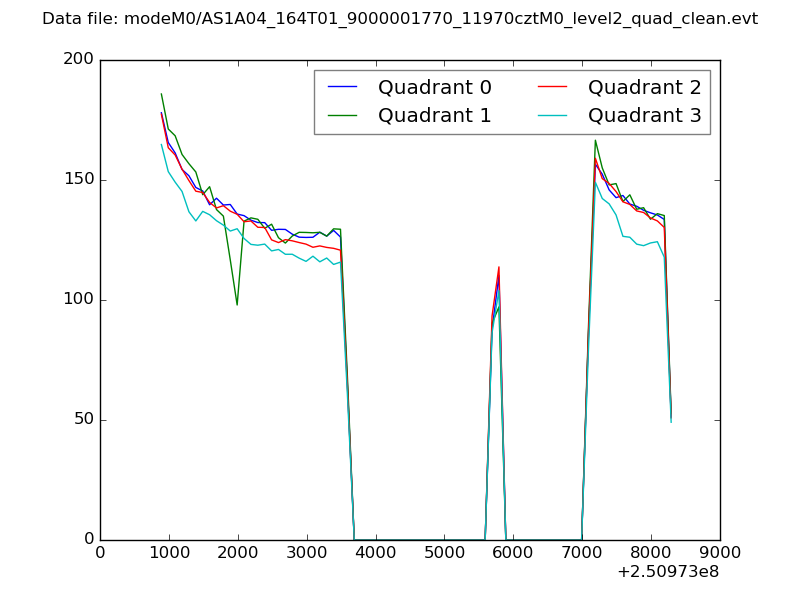 |
|
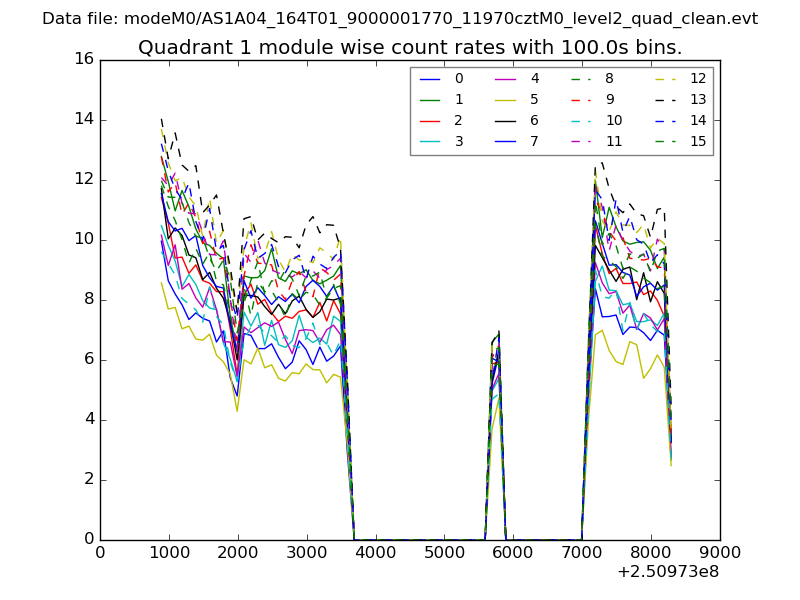
| Module-wise count rates for Quadrant A Data is divided into 100 sec bins |
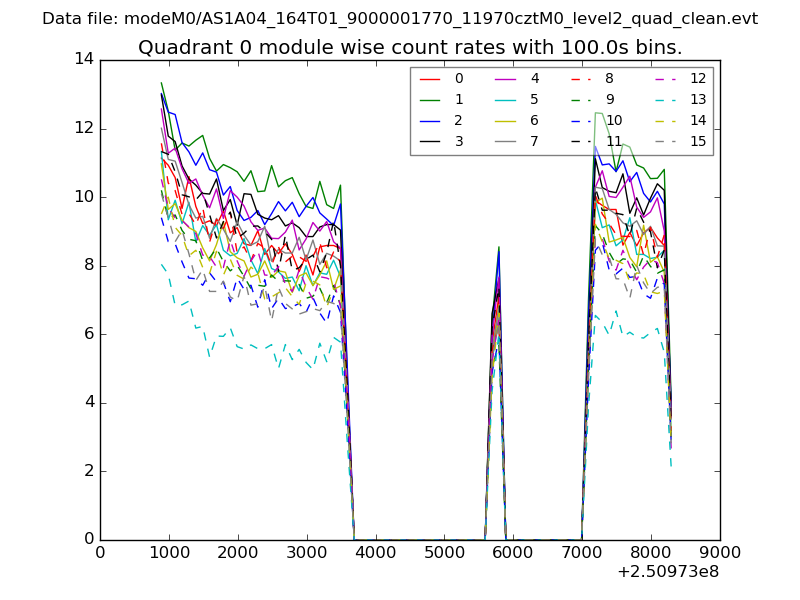 |
 |
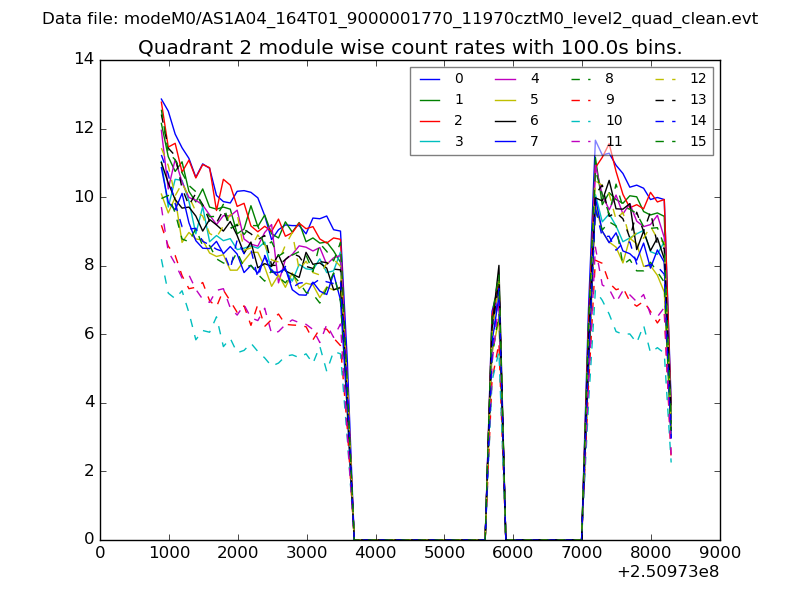
| Module-wise count rates for Quadrant B Data is divided into 100 sec bins |
 |
 |
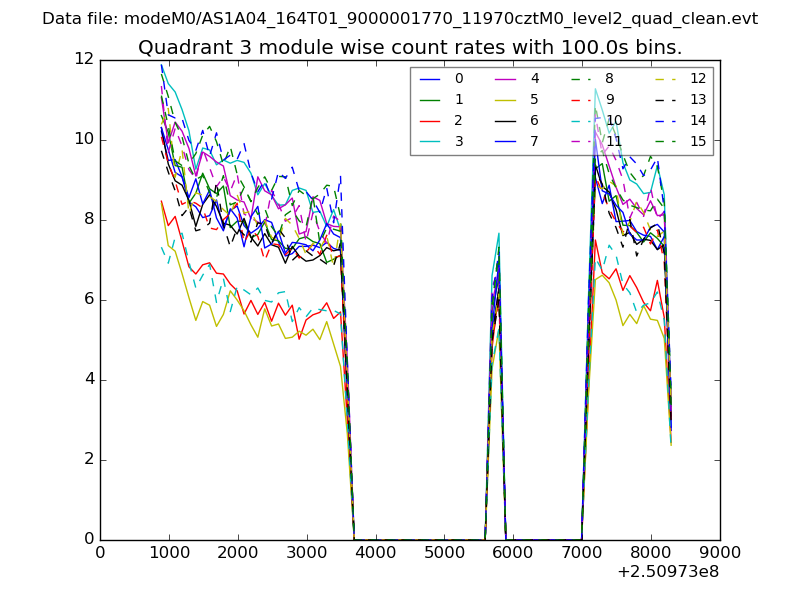
| Module-wise count rates for Quadrant C Data is divided into 100 sec bins |
 |
 |
| Module-wise count rates for Quadrant D Data is divided into 100 sec bins |
 |
 |
| Parameter | Plot |
|---|---|
| CZT HV Monitor | 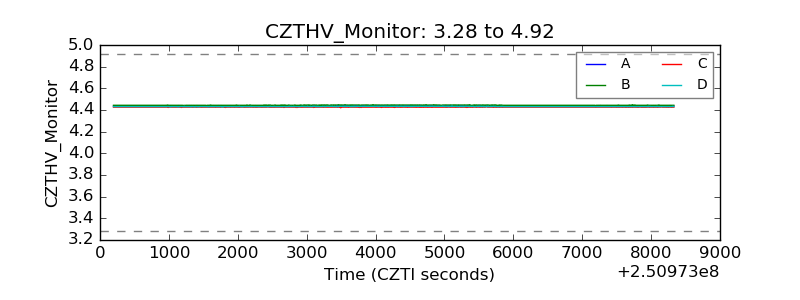 |
| D_VDD | 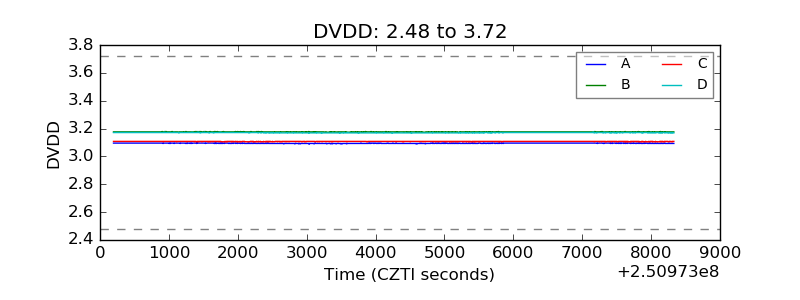 |
| Temperature 1 |  |
| Veto HV Monitor | 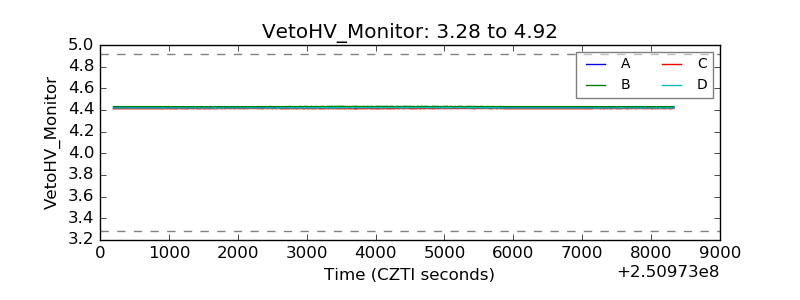 |
| Veto LLD | 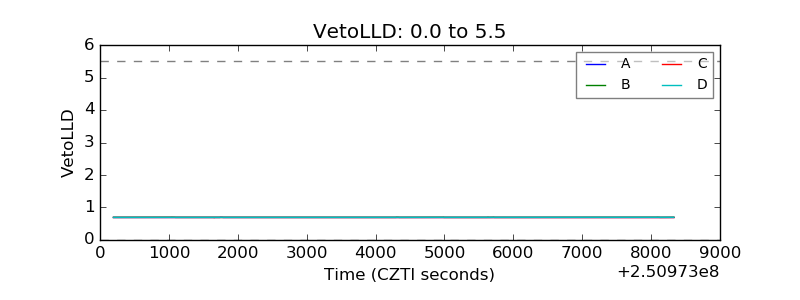 |
| Alpha Counter | 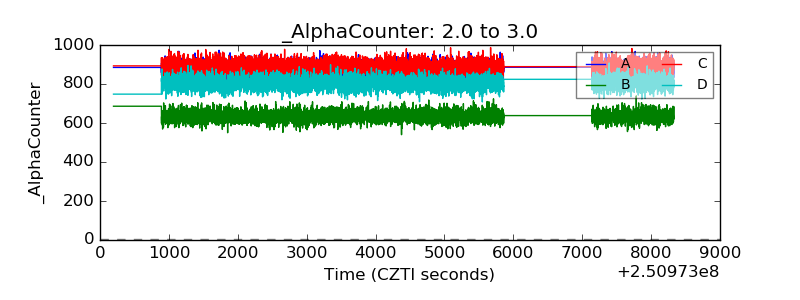 |
| _CPM_Rate | 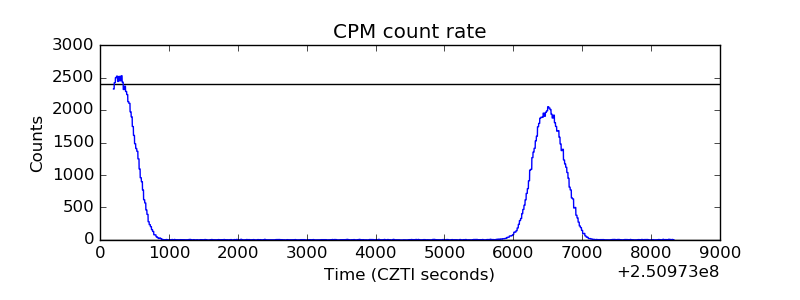 |
| CZT Counter | 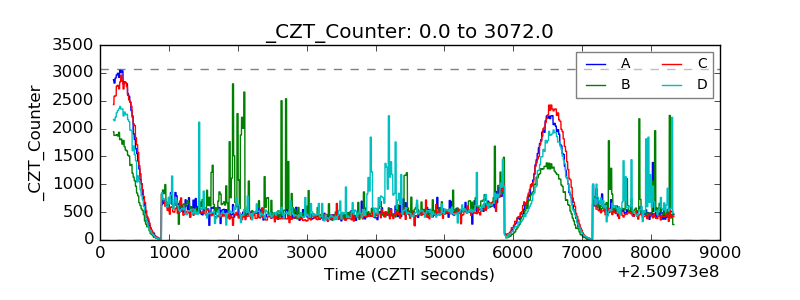 |
| +2.5 Volts monitor |  |
| +5 Volts monitor |  |
| _ROLL_ROT | 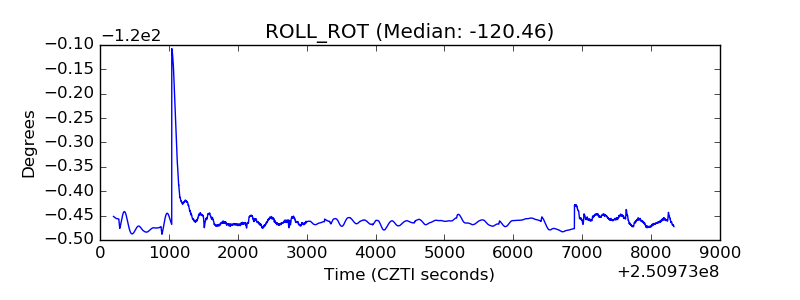 |
| _Roll_DEC | 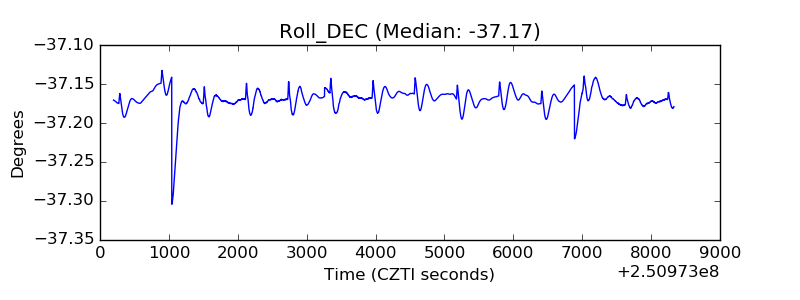 |
| _Roll_RA | 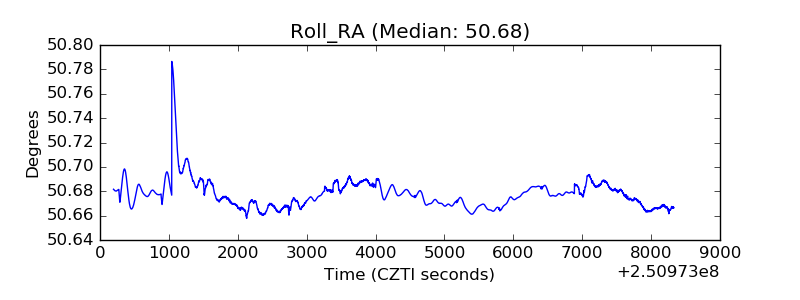 |
| Veto Counter | 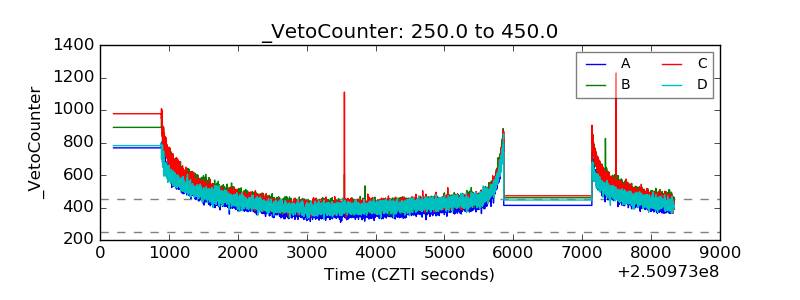 |