| Param | Original file | Final file |
|---|---|---|
| Filename | modeM0/AS1A04_164T01_9000001770_11972cztM0_level2.evt | modeM0/AS1A04_164T01_9000001770_11972cztM0_level2_quad_clean.evt |
| Size (bytes) | 421,277,760 | 65,013,120 |
| Size | 401.8 MB | 62.0 MB |
| Events in quadrant A | 2,670,880 | 406,499 |
| Events in quadrant B | 3,542,638 | 403,870 |
| Events in quadrant C | 2,363,326 | 408,249 |
| Events in quadrant D | 3,825,629 | 382,840 |
| Mode M0 | |||
|---|---|---|---|
| Quadrant | BADHDUFLAG | Total packets | Discarded packets |
| A | 0 | 11550 | 1 |
| B | 0 | 14079 | 1 |
| C | 0 | 10638 | 1 |
| D | 0 | 14803 | 1 |
| Mode SS | |||
|---|---|---|---|
| Quadrant | BADHDUFLAG | Total packets | Discarded packets |
| A | 0 | 108 | 0 |
| B | 0 | 108 | 0 |
| C | 0 | 108 | 0 |
| D | 0 | 108 | 0 |
| Mode M9 | |||
|---|---|---|---|
| Quadrant | BADHDUFLAG | Total packets | Discarded packets |
| A | 0 | 11 | 0 |
| B | 0 | 11 | 0 |
| C | 0 | 11 | 0 |
| D | 0 | 12 | 0 |
| Quadrant | Total seconds | Saturated seconds | Saturation percentage |
|---|---|---|---|
| A | 5235 | 51 | 0.974212% |
| B | 5235 | 269 | 5.138491% |
| C | 5235 | 10 | 0.191022% |
| D | 5235 | 167 | 3.190067% |
Noise dominated data is calculated using 1-second bins in cleaned event files. If a bin has >2000 counts, and if more than 50% of those come from <1% of pixels, then it is considered to be noise-dominated and hence unusable.
| Quadrant | # 1 sec bins | Bins with >0 counts | Bins with >2000 counts | High rate bins dominated by noise | Noise dominated (total time) | Noise dominated (detector-on time) | Marked lightcurve |
|---|---|---|---|---|---|---|---|
| A | 5236 | 5236 | 3 | 3 | 0.06% | 0.06% | 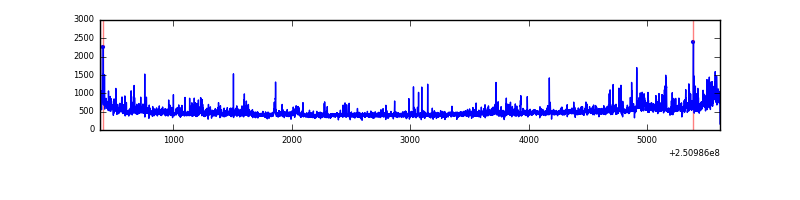 |
| B | 5236 | 5236 | 144 | 144 | 2.75% | 2.75% | 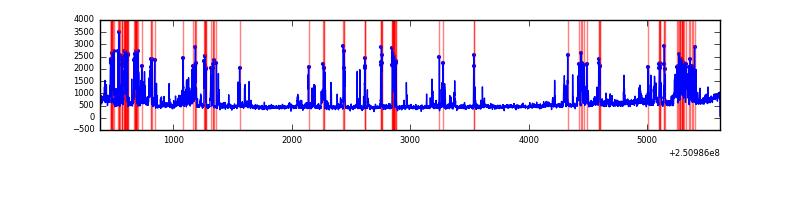 |
| C | 5236 | 5236 | 0 | 0 | 0.00% | 0.00% | 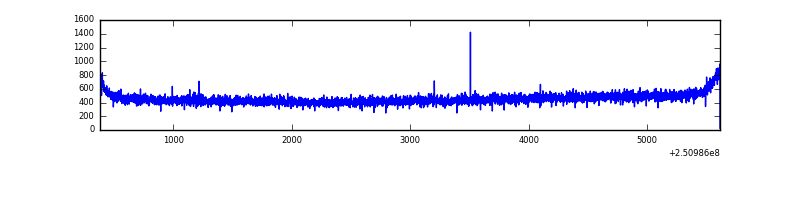 |
| D | 5236 | 5236 | 161 | 161 | 3.07% | 3.07% | 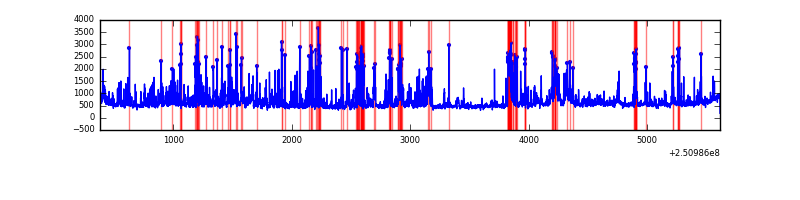 |
Top three noisy pixels from each quadrant. If the there are fewer than three noisy pixels in the level2.evt file, extra rows are filled as -1
| Pixel properties | Quadrant properties | ||||||
|---|---|---|---|---|---|---|---|
| Quadrant | DetID | PixID | Counts | Sigma | Mean | Median | Sigma |
| A | 11 | 29 | 131187 | 1031.84 | 615 | 603 | 126.6 |
| A | 1 | 162 | 62371 | 488.08 | 615 | 603 | 126.6 |
| A | 1 | 178 | 27320 | 211.11 | 615 | 603 | 126.6 |
| B | 4 | 239 | 988639 | 8386.0 | 616 | 601 | 117.8 |
| B | 15 | 204 | 62798 | 527.9 | 616 | 601 | 117.8 |
| B | 11 | 51 | 61552 | 517.32 | 616 | 601 | 117.8 |
| C | 13 | 61 | 4503 | 27.7 | 605 | 607 | 140.7 |
| C | 14 | 234 | 1972 | 9.7 | 605 | 607 | 140.7 |
| C | 3 | 202 | 1488 | 6.26 | 605 | 607 | 140.7 |
| D | 4 | 95 | 724207 | 5116.93 | 588 | 571 | 141.4 |
| D | 1 | 52 | 359381 | 2537.2 | 588 | 571 | 141.4 |
| D | 7 | 80 | 192826 | 1359.46 | 588 | 571 | 141.4 |
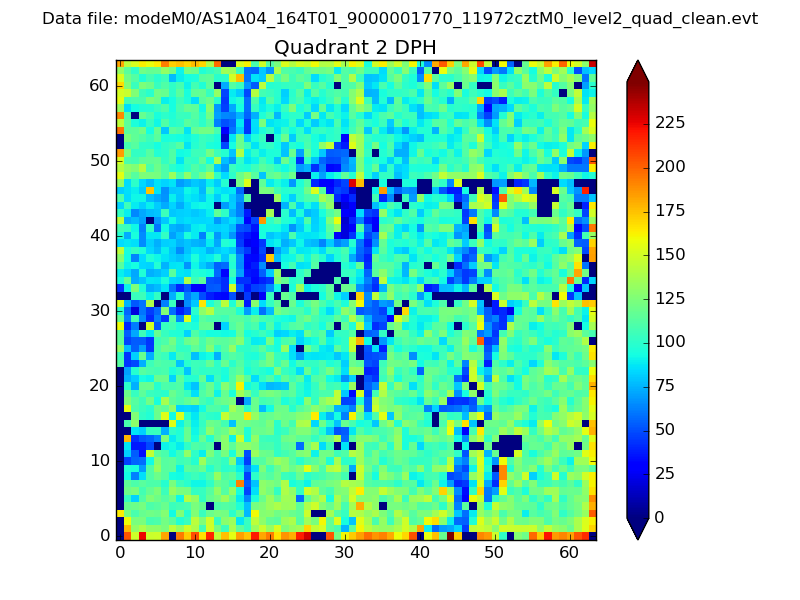
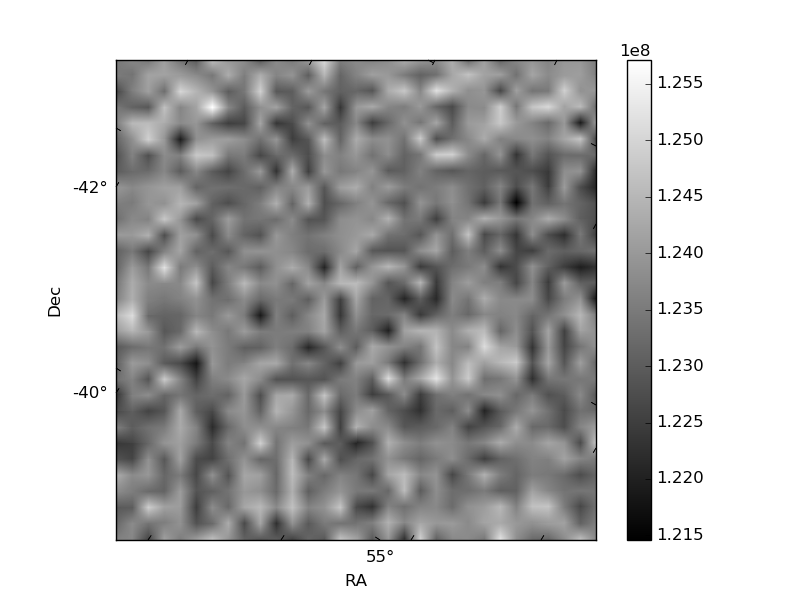
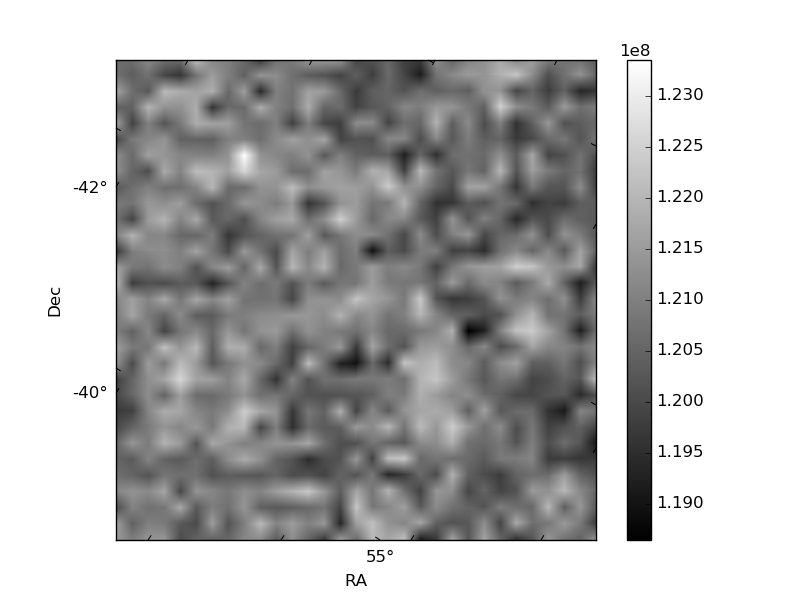
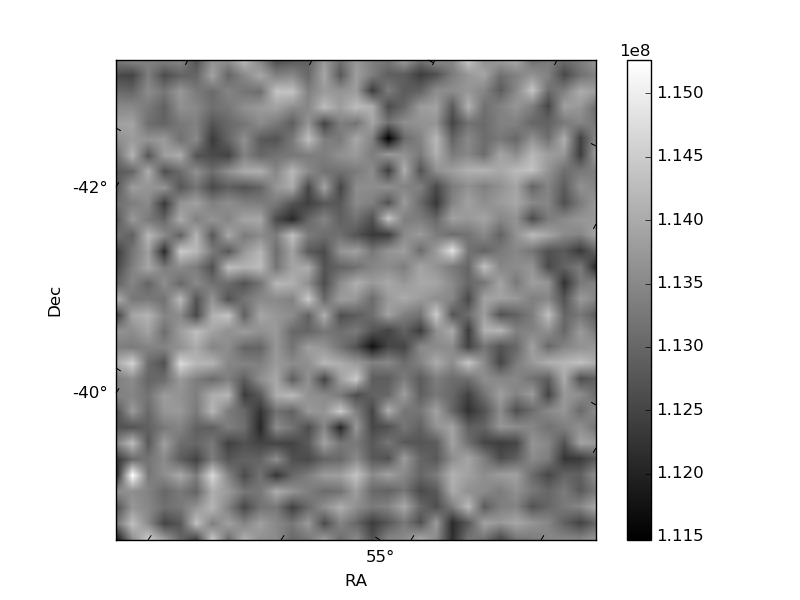
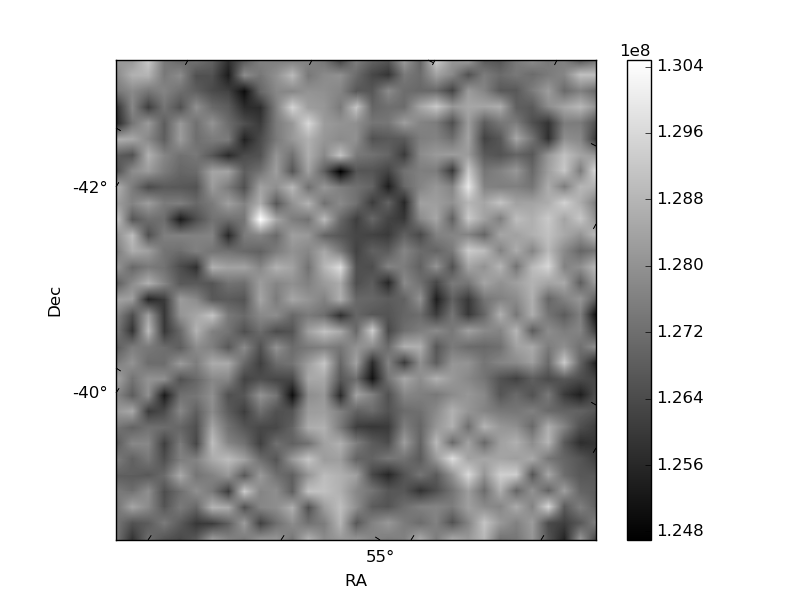
Histogram calculated using DETX and DETY for each event in the final _common_clean file
| Quadrant A | 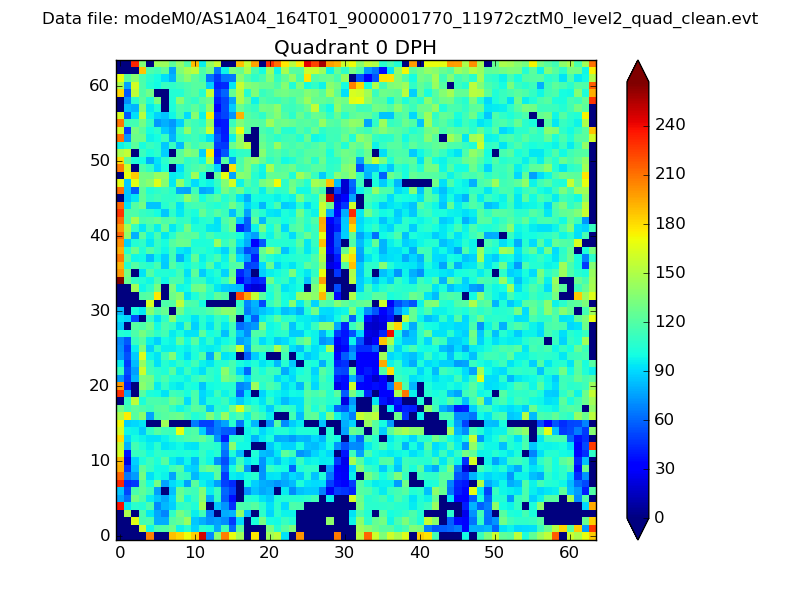 |
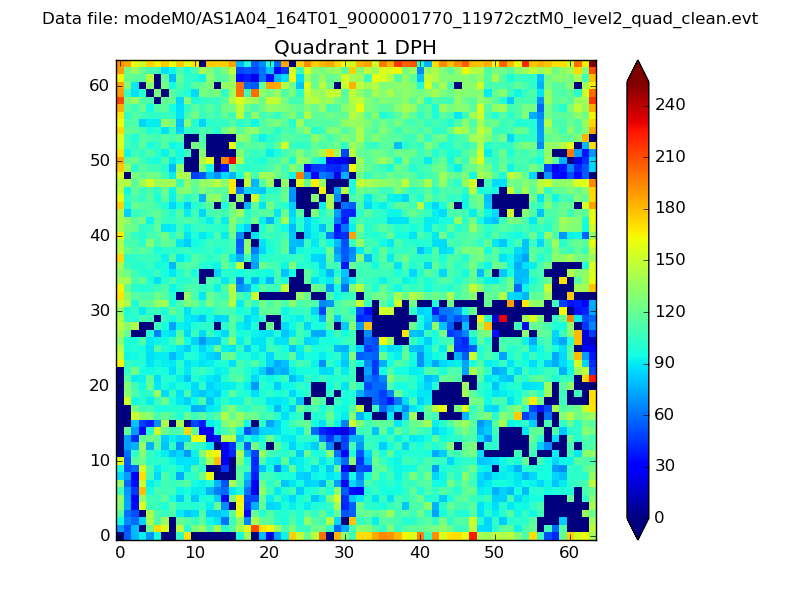 |
Quadrant B |
|---|---|---|---|
| Quadrant D | 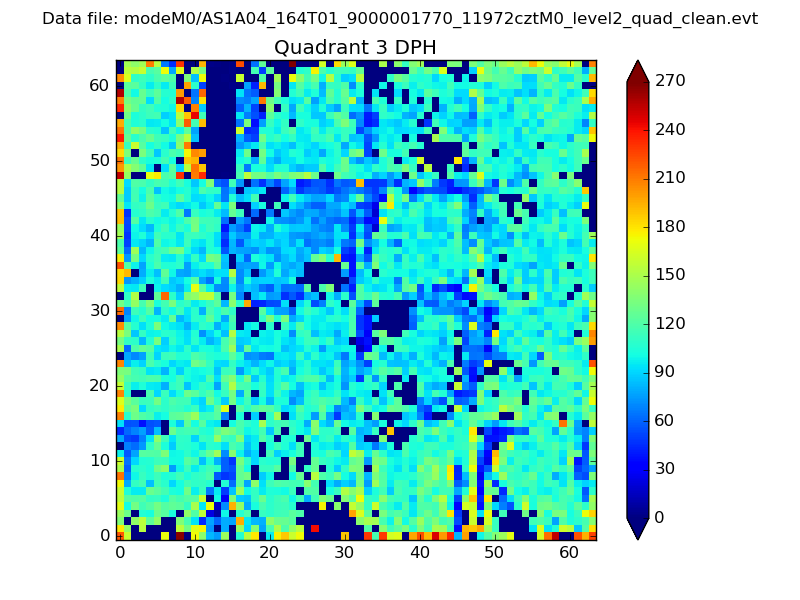 |
 |
Quadrant C |
| Plot type | Count rate plots | Images |
|---|---|---|
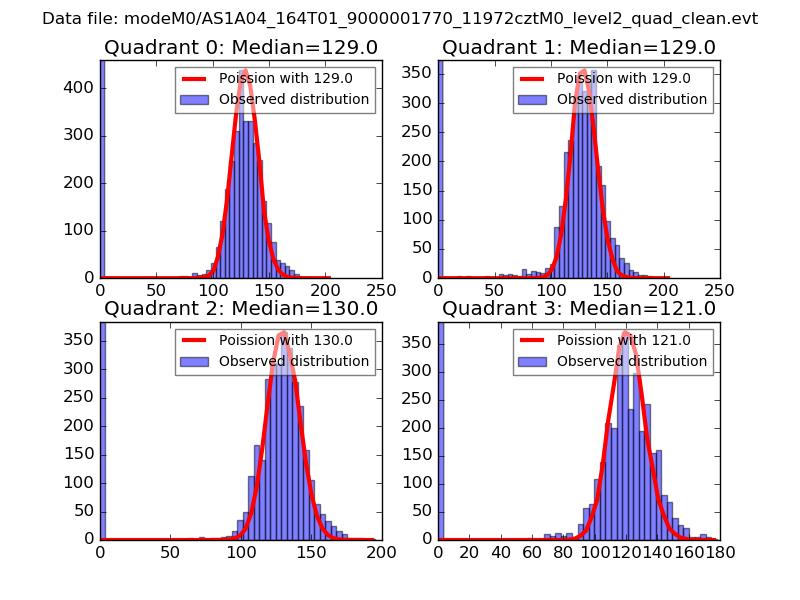
| Comparison with Poisson distribution Blue bars denote a histogram of data divided into 1 sec bins. Red curve is a Poisson curve with rate = median count rate of data. |
 |
 |
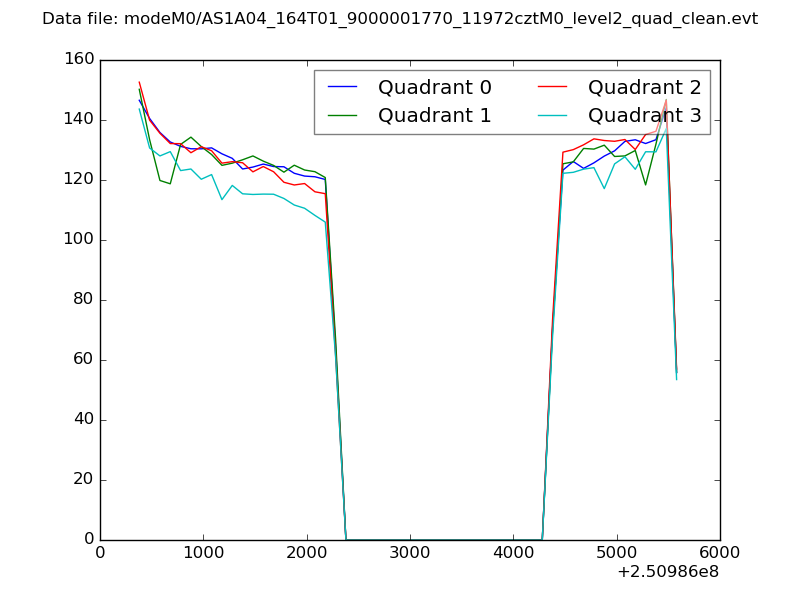
| Quadrant-wise count rates Data is divided into 100 sec bins |
 |
|
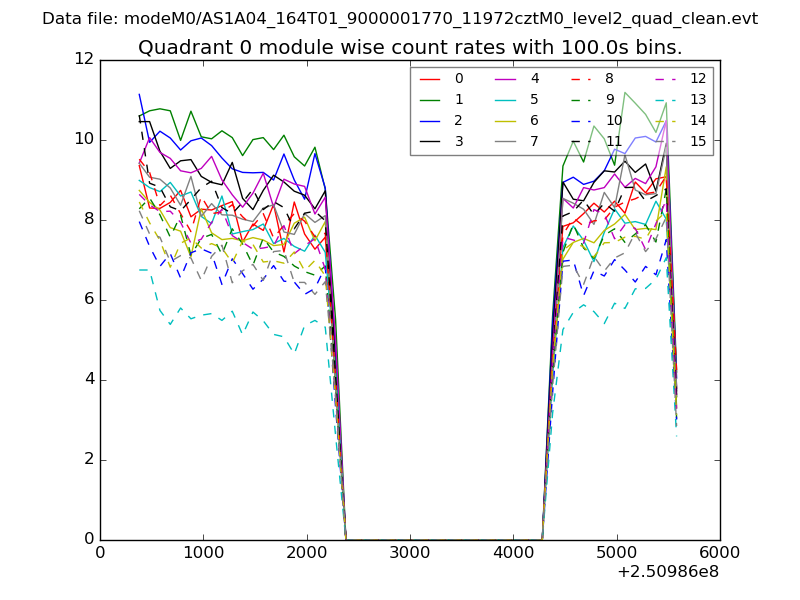
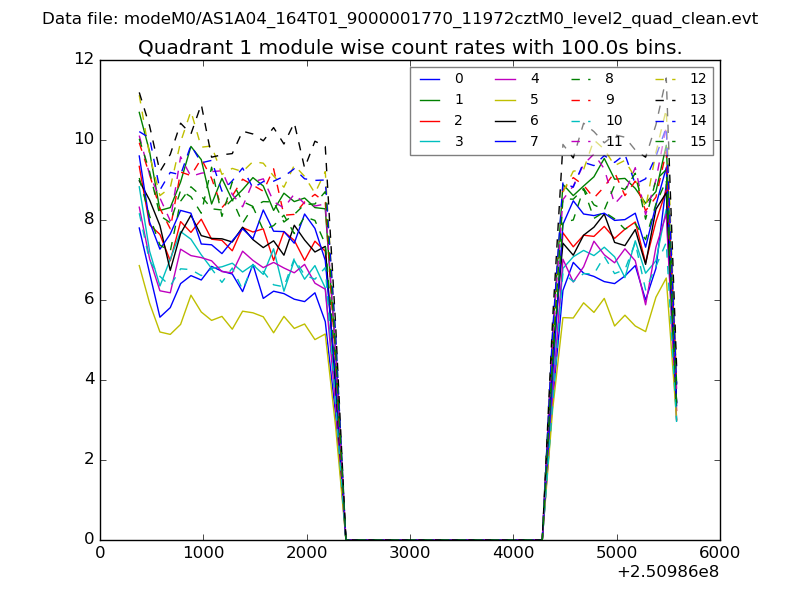
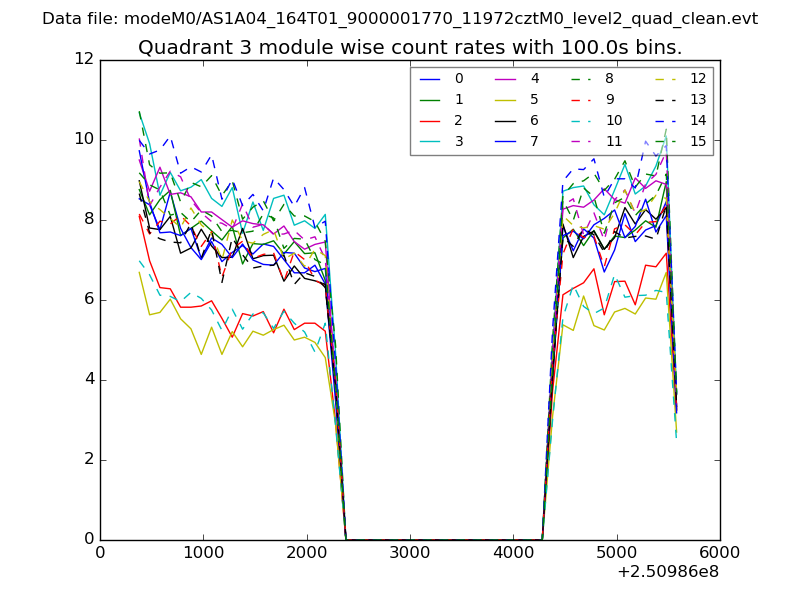
| Module-wise count rates for Quadrant A Data is divided into 100 sec bins |
 |
 |
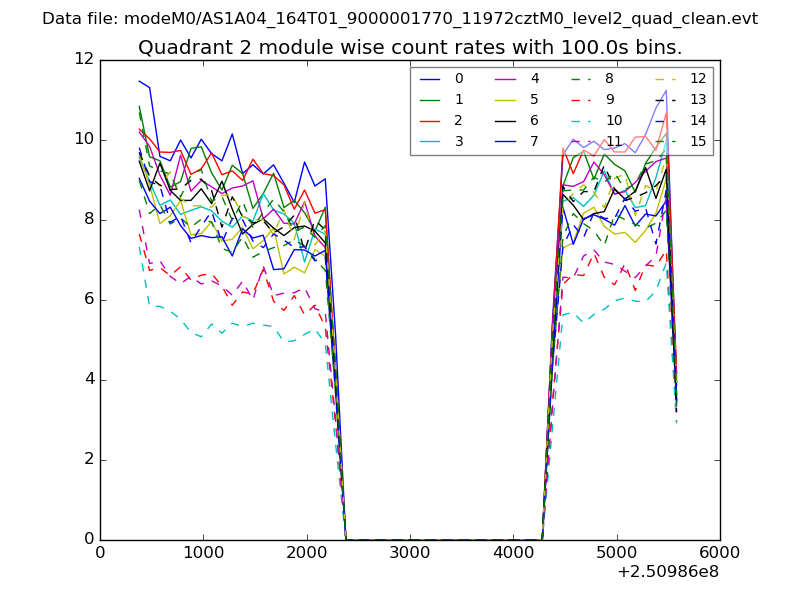
| Module-wise count rates for Quadrant B Data is divided into 100 sec bins |
 |
 |
| Module-wise count rates for Quadrant C Data is divided into 100 sec bins |
 |
 |
| Module-wise count rates for Quadrant D Data is divided into 100 sec bins |
 |
 |
| Parameter | Plot |
|---|---|
| CZT HV Monitor | 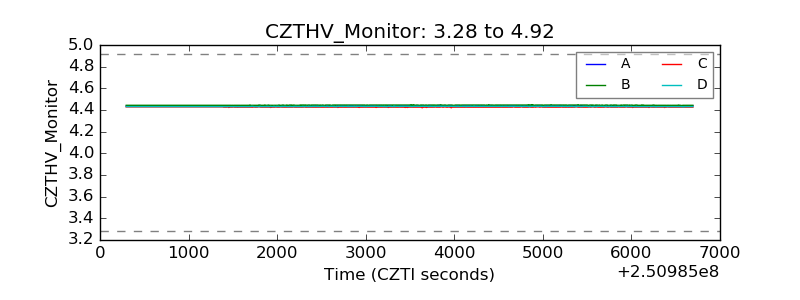 |
| D_VDD | 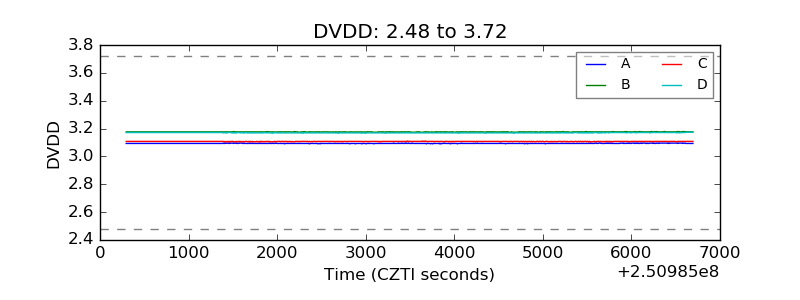 |
| Temperature 1 | 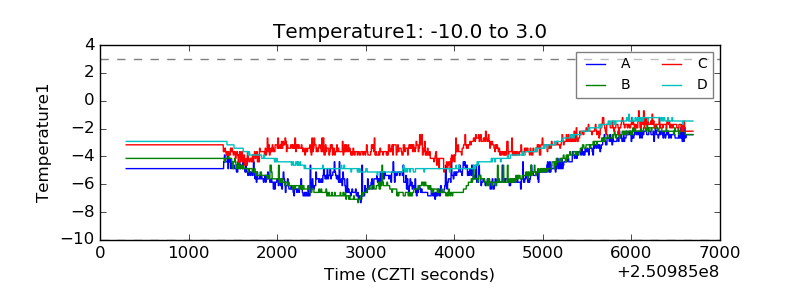 |
| Veto HV Monitor | 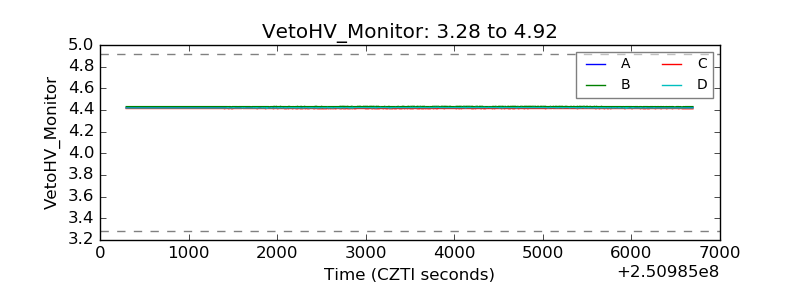 |
| Veto LLD | 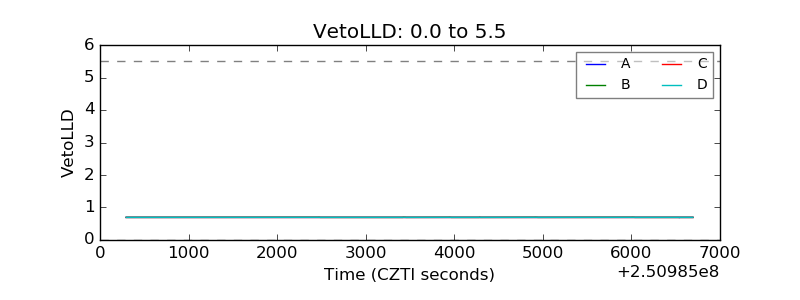 |
| Alpha Counter | 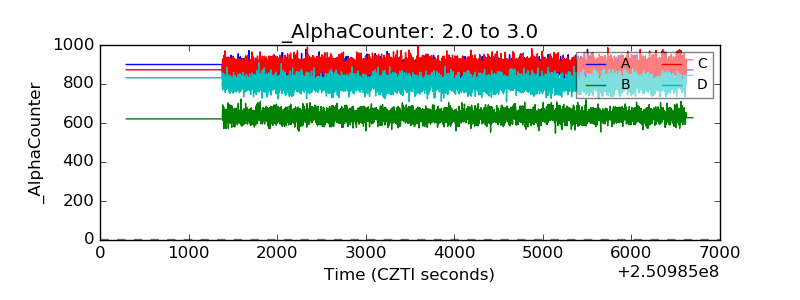 |
| _CPM_Rate | 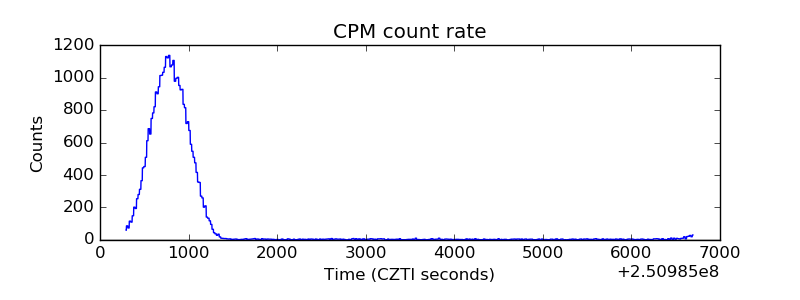 |
| CZT Counter | 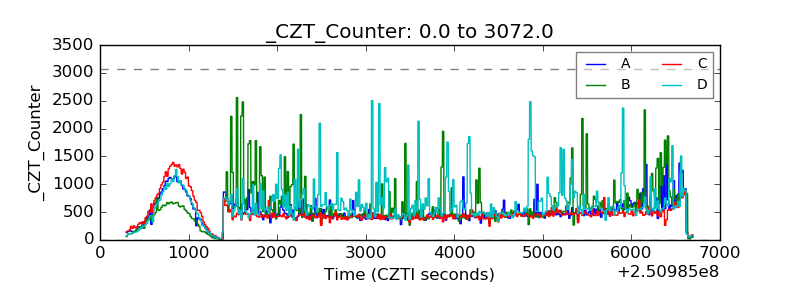 |
| +2.5 Volts monitor |  |
| +5 Volts monitor |  |
| _ROLL_ROT | 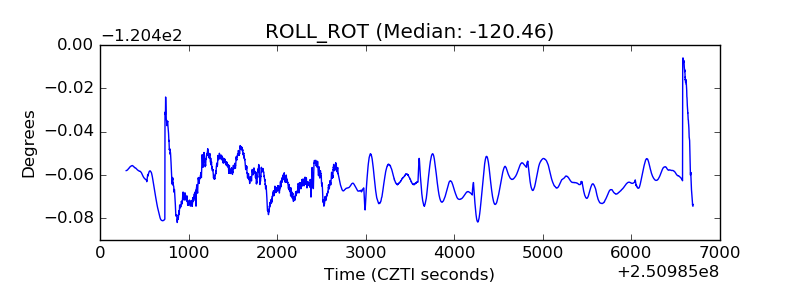 |
| _Roll_DEC | 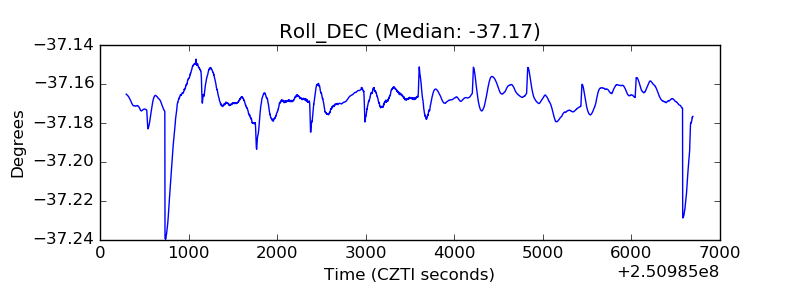 |
| _Roll_RA | 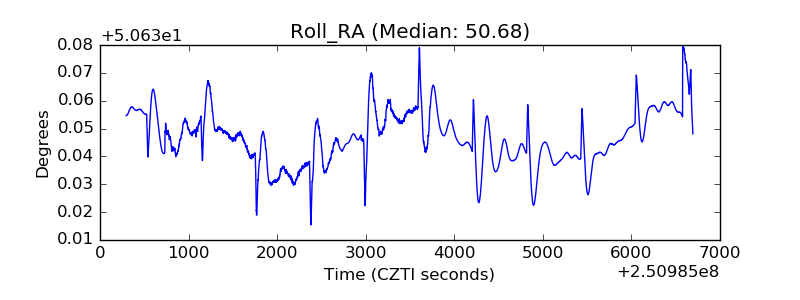 |
| Veto Counter | 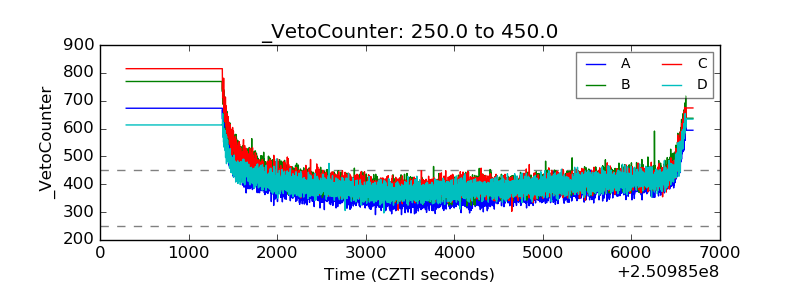 |