| Param | Original file | Final file |
|---|---|---|
| Filename | modeM0/AS1G08_076T03_9000001768cztM0_level2.fits | modeM0/AS1G08_076T03_9000001768cztM0_level2_quad_clean.evt |
| Size (bytes) | 161,942,400 | 141,788,160 |
| Size | 154.4 MB | 135.2 MB |
| Events in quadrant A | 987,616 | 825,534 |
| Events in quadrant B | 932,216 | 780,082 |
| Events in quadrant C | 971,494 | 792,831 |
| Events in quadrant D | 836,406 | 718,100 |
| Mode SS | |||
|---|---|---|---|
| Quadrant | BADHDUFLAG | Total packets | Discarded packets |
| A | 0 | 348 | 0 |
| B | 0 | 348 | 0 |
| C | 0 | 348 | 0 |
| D | 0 | 348 | 0 |
| Mode M9 | |||
|---|---|---|---|
| Quadrant | BADHDUFLAG | Total packets | Discarded packets |
| A | 0 | 40 | 0 |
| B | 0 | 40 | 0 |
| C | 0 | 40 | 0 |
| D | 0 | 40 | 0 |
| Mode M0 | |||
|---|---|---|---|
| Quadrant | BADHDUFLAG | Total packets | Discarded packets |
| A | 0 | 38472 | 0 |
| B | 0 | 45570 | 0 |
| C | 0 | 34947 | 0 |
| D | 0 | 44899 | 0 |
| Quadrant | Total seconds | Saturated seconds | Saturation percentage |
|---|---|---|---|
| A | 17060 | 323 | 1.893318% |
| B | 17060 | 856 | 5.017585% |
| C | 17060 | 107 | 0.627198% |
| D | 17060 | 625 | 3.663540% |
Noise dominated data is calculated using 1-second bins in cleaned event files. If a bin has >2000 counts, and if more than 50% of those come from <1% of pixels, then it is considered to be noise-dominated and hence unusable.
| Quadrant | # 1 sec bins | Bins with >0 counts | Bins with >2000 counts | High rate bins dominated by noise | Noise dominated (total time) | Noise dominated (detector-on time) | Marked lightcurve |
|---|---|---|---|---|---|---|---|
| A | 20320 | 17055 | 0 | 0 | 0.00% | 0.00% |  |
| B | 20320 | 17053 | 0 | 0 | 0.00% | 0.00% | 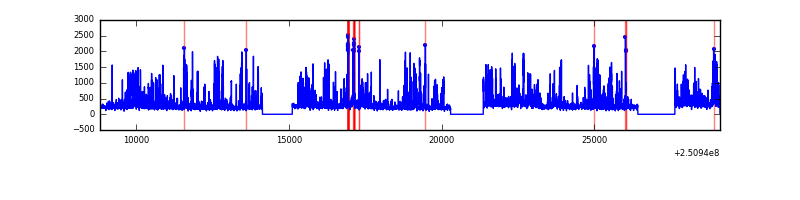 |
| C | 20320 | 17057 | 0 | 0 | 0.00% | 0.00% |  |
| D | 20320 | 17029 | 0 | 0 | 0.00% | 0.00% | 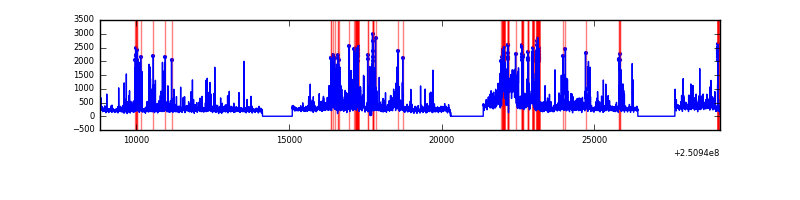 |
Top three noisy pixels from each quadrant. If the there are fewer than three noisy pixels in the level2.evt file, extra rows are filled as -1
| Pixel properties | Quadrant properties | ||||||
|---|---|---|---|---|---|---|---|
| Quadrant | DetID | PixID | Counts | Sigma | Mean | Median | Sigma |
| A | 0 | 29 | 911 | 10.1 | 257 | 242 | 66.2 |
| A | 7 | 110 | 825 | 8.8 | 257 | 242 | 66.2 |
| A | 9 | 19 | 738 | 7.49 | 257 | 242 | 66.2 |
| B | 2 | 9 | 867 | 12.38 | 246 | 235 | 51.0 |
| B | 3 | 17 | 642 | 7.97 | 246 | 235 | 51.0 |
| B | 2 | 8 | 623 | 7.6 | 246 | 235 | 51.0 |
| C | 1 | 80 | 757 | 7.7 | 255 | 238 | 67.4 |
| C | 1 | 81 | 742 | 7.48 | 255 | 238 | 67.4 |
| C | 12 | 241 | 706 | 6.95 | 255 | 238 | 67.4 |
| D | 6 | 231 | 624 | 6.25 | 238 | 216 | 65.2 |
| D | 7 | 3 | 620 | 6.19 | 238 | 216 | 65.2 |
| D | 3 | 14 | 620 | 6.19 | 238 | 216 | 65.2 |
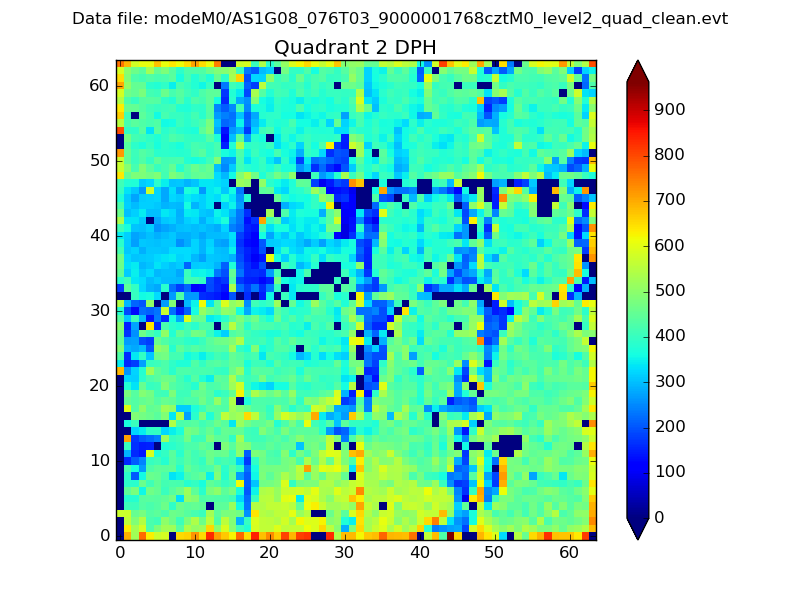
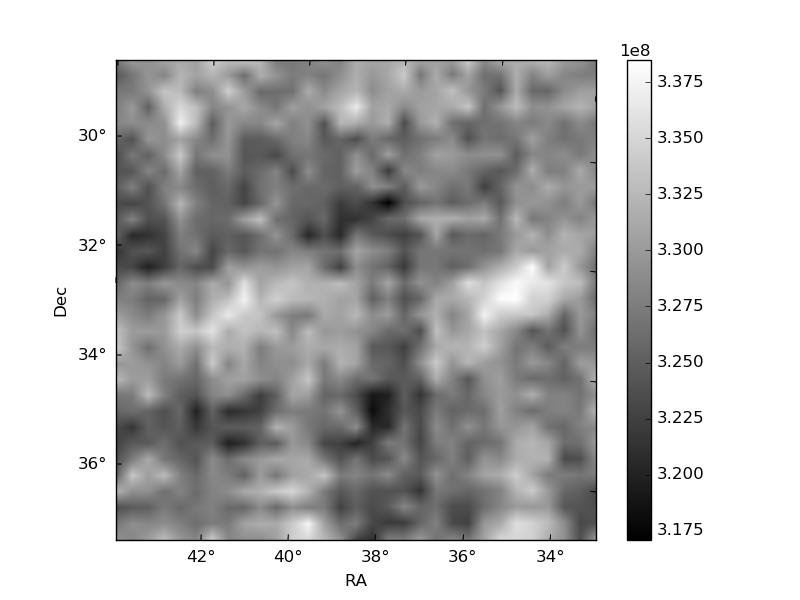
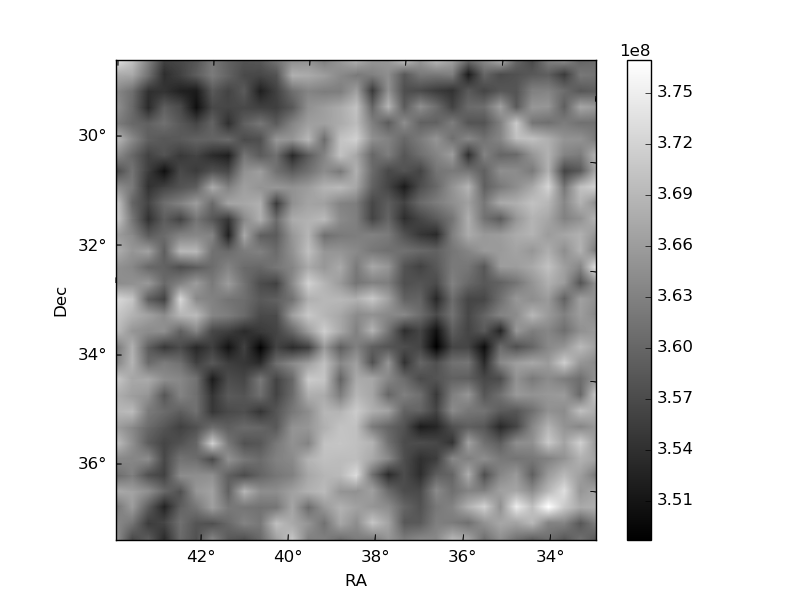
Histogram calculated using DETX and DETY for each event in the final _common_clean file
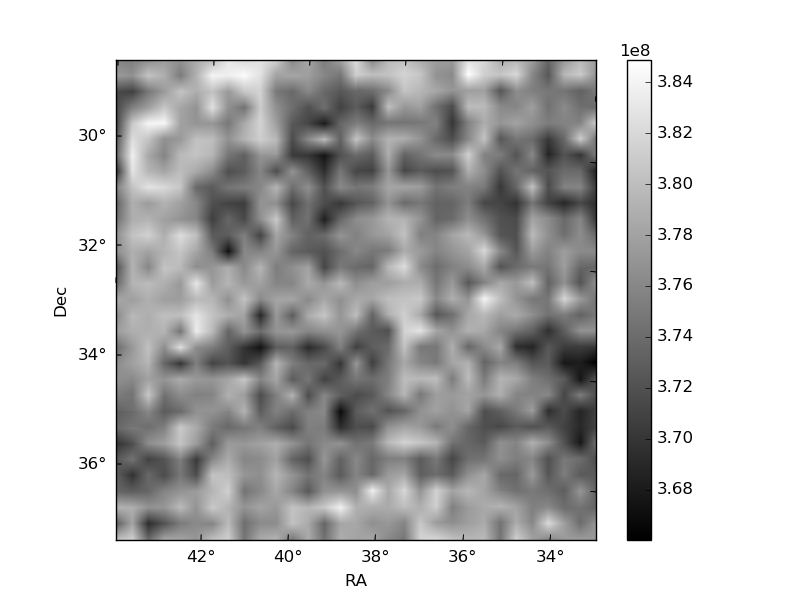
| Quadrant A | 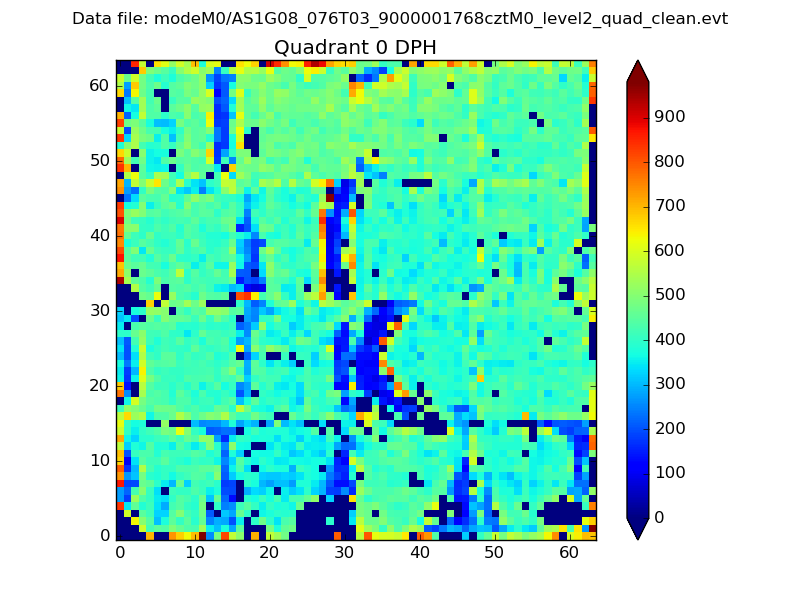 |
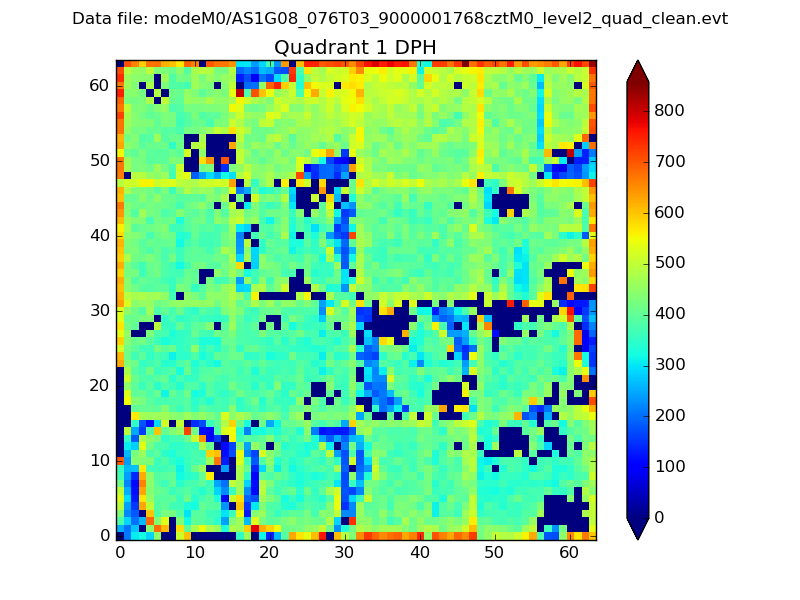 |
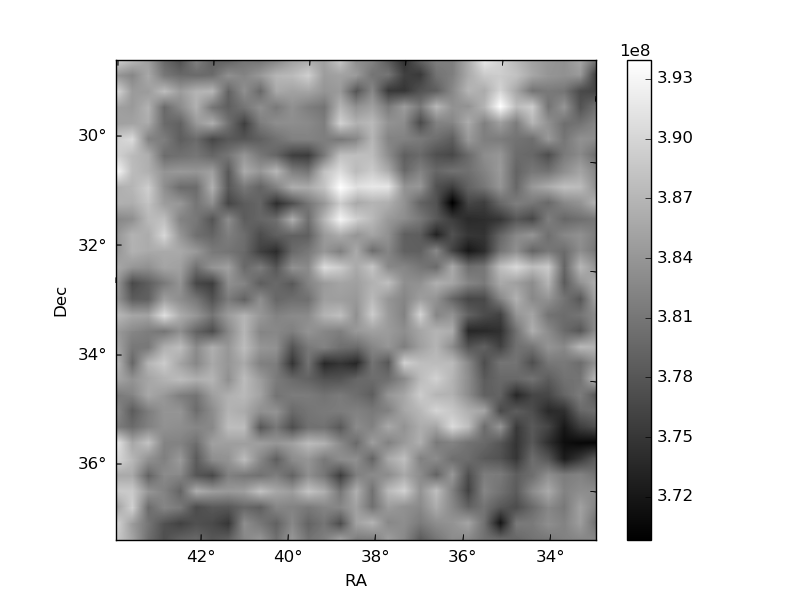
Quadrant B |
|---|---|---|---|
| Quadrant D | 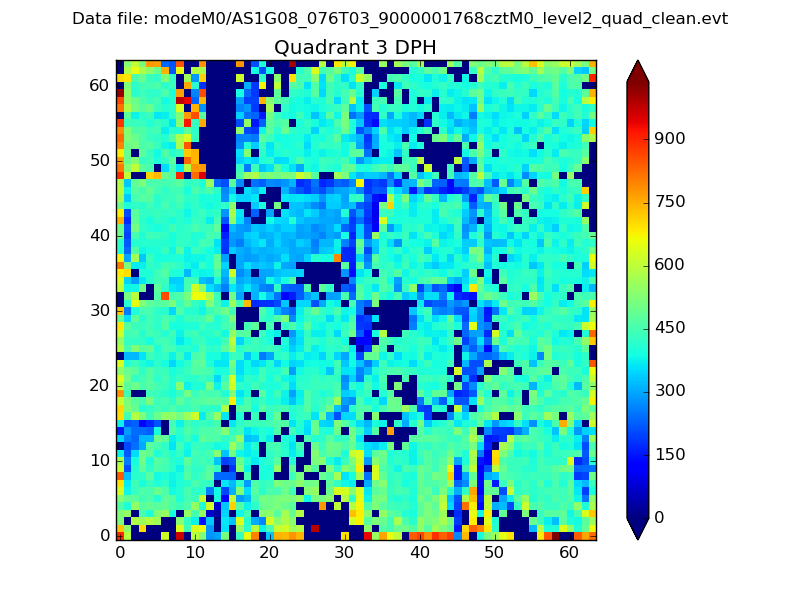 |
 |
Quadrant C |
| Plot type | Count rate plots | Images |
|---|---|---|
| Comparison with Poisson distribution Blue bars denote a histogram of data divided into 1 sec bins. Red curve is a Poisson curve with rate = median count rate of data. |
 |
 |
| Quadrant-wise count rates Data is divided into 100 sec bins |
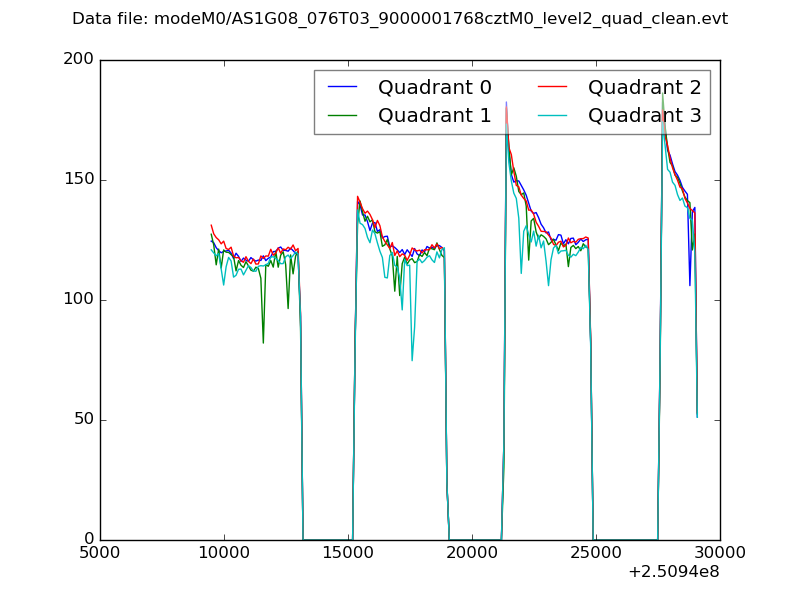 |
|
| Module-wise count rates for Quadrant A Data is divided into 100 sec bins |
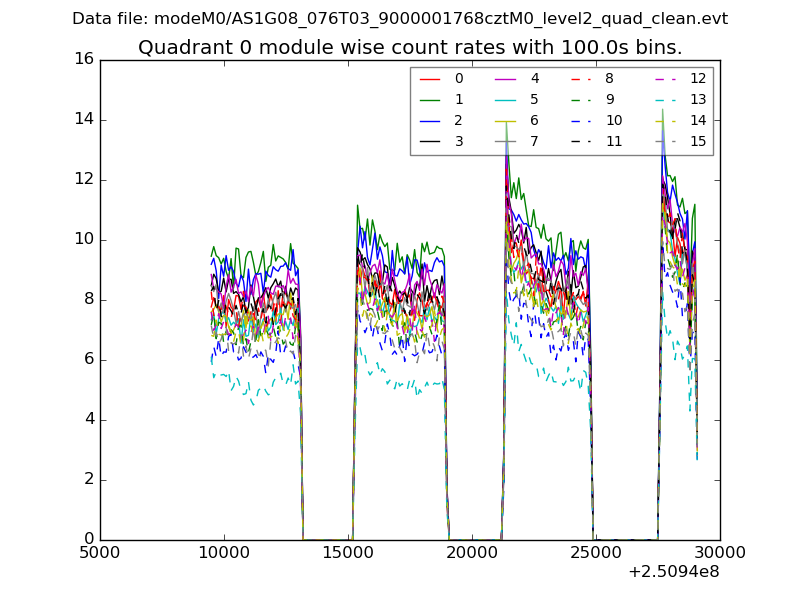 |
 |
| Module-wise count rates for Quadrant B Data is divided into 100 sec bins |
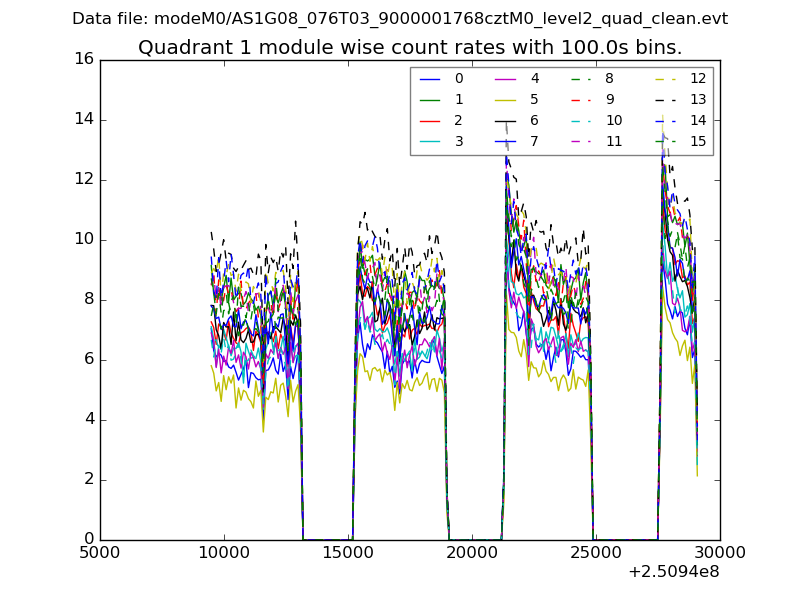 |
 |
| Module-wise count rates for Quadrant C Data is divided into 100 sec bins |
 |
 |
| Module-wise count rates for Quadrant D Data is divided into 100 sec bins |
 |
 |
| Parameter | Plot |
|---|---|
| CZT HV Monitor |  |
| D_VDD | 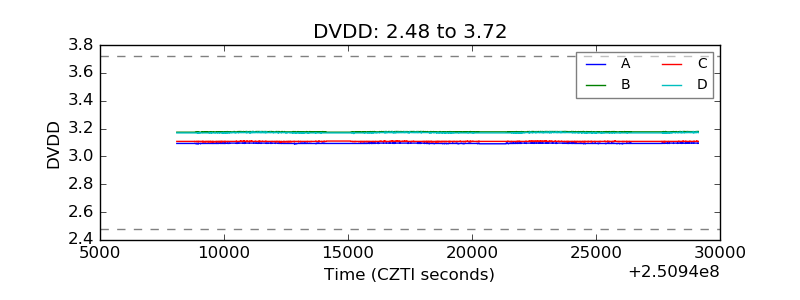 |
| Temperature 1 |  |
| Veto HV Monitor |  |
| Veto LLD | 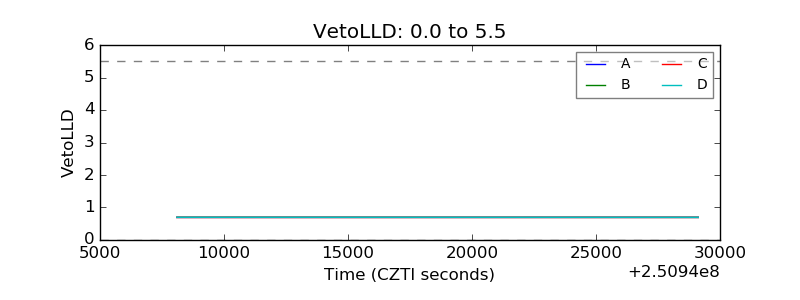 |
| Alpha Counter | 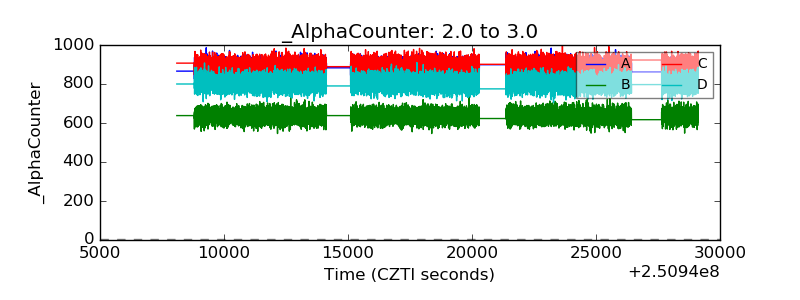 |
| _CPM_Rate | 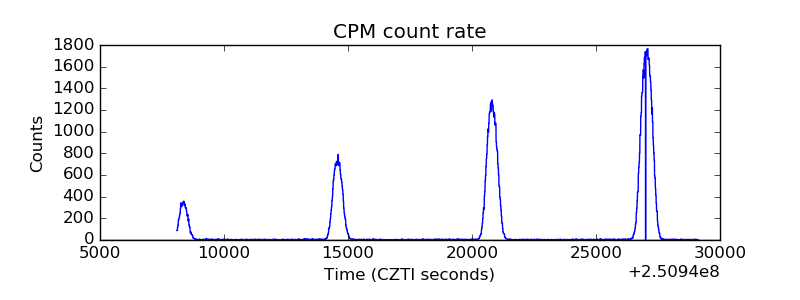 |
| CZT Counter | 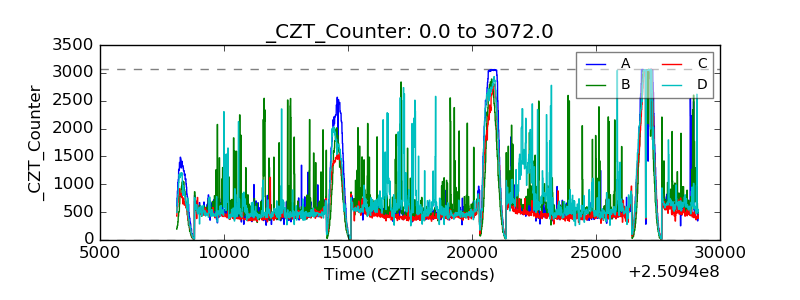 |
| +2.5 Volts monitor | 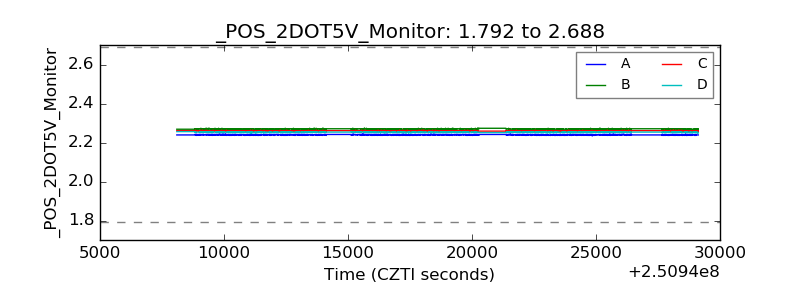 |
| +5 Volts monitor | 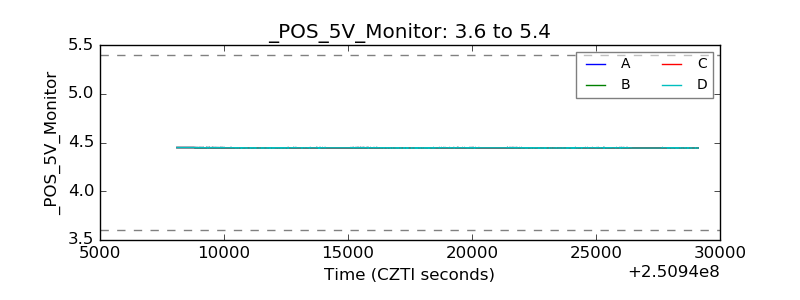 |
| _ROLL_ROT |  |
| _Roll_DEC | 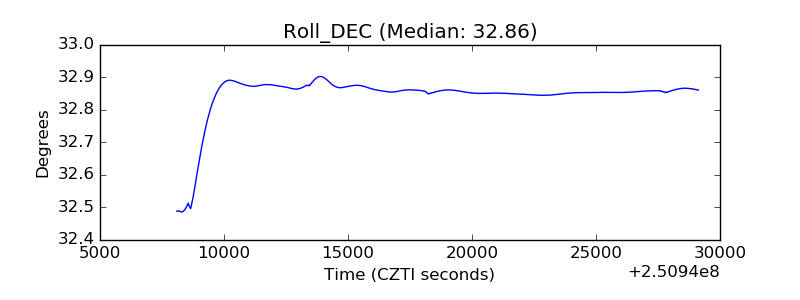 |
| _Roll_RA | 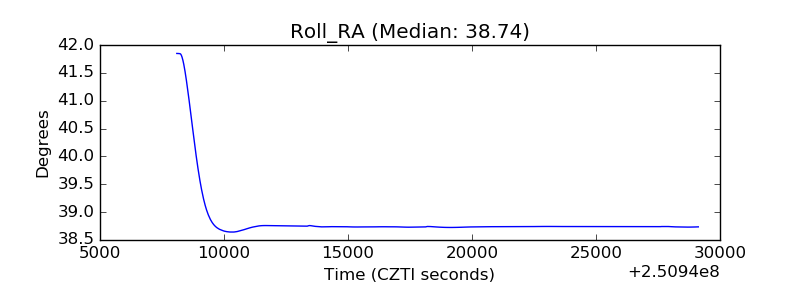 |
| Veto Counter |  |