| Param | Original file | Final file |
|---|---|---|
| Filename | modeM0/AS1G08_076T03_9000001768_11964cztM0_level2.evt | modeM0/AS1G08_076T03_9000001768_11964cztM0_level2_quad_clean.evt |
| Size (bytes) | 121,936,320 | 17,619,840 |
| Size | 116.3 MB | 16.8 MB |
| Events in quadrant A | 841,537 | 105,201 |
| Events in quadrant B | 1,069,096 | 104,262 |
| Events in quadrant C | 746,929 | 108,044 |
| Events in quadrant D | 927,707 | 101,164 |
| Mode SS | |||
|---|---|---|---|
| Quadrant | BADHDUFLAG | Total packets | Discarded packets |
| A | 0 | 30 | 0 |
| B | 0 | 30 | 0 |
| C | 0 | 30 | 0 |
| D | 0 | 30 | 0 |
| Mode M9 | |||
|---|---|---|---|
| Quadrant | BADHDUFLAG | Total packets | Discarded packets |
| A | 0 | 8 | 0 |
| B | 0 | 8 | 0 |
| C | 0 | 8 | 0 |
| D | 0 | 8 | 0 |
| Mode M0 | |||
|---|---|---|---|
| Quadrant | BADHDUFLAG | Total packets | Discarded packets |
| A | 0 | 3418 | 2 |
| B | 0 | 4163 | 1 |
| C | 0 | 3160 | 1 |
| D | 0 | 3711 | 1 |
| Quadrant | Total seconds | Saturated seconds | Saturation percentage |
|---|---|---|---|
| A | 1547 | 21 | 1.357466% |
| B | 1547 | 67 | 4.330963% |
| C | 1547 | 6 | 0.387847% |
| D | 1547 | 36 | 2.327085% |
Noise dominated data is calculated using 1-second bins in cleaned event files. If a bin has >2000 counts, and if more than 50% of those come from <1% of pixels, then it is considered to be noise-dominated and hence unusable.
| Quadrant | # 1 sec bins | Bins with >0 counts | Bins with >2000 counts | High rate bins dominated by noise | Noise dominated (total time) | Noise dominated (detector-on time) | Marked lightcurve |
|---|---|---|---|---|---|---|---|
| A | 1548 | 1548 | 0 | 0 | 0.00% | 0.00% | 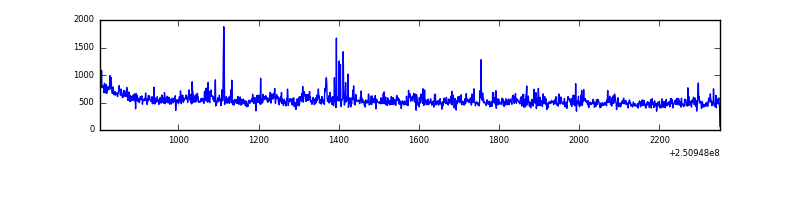 |
| B | 1548 | 1548 | 32 | 32 | 2.07% | 2.07% | 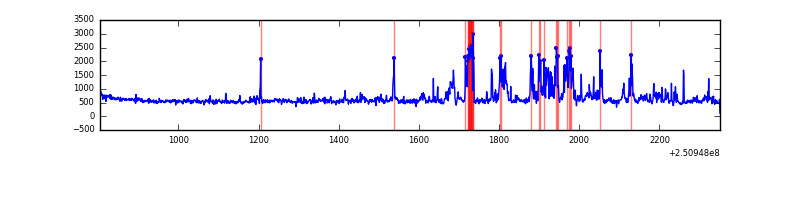 |
| C | 1548 | 1548 | 0 | 0 | 0.00% | 0.00% | 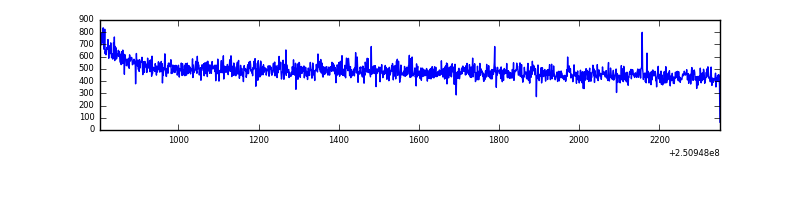 |
| D | 1548 | 1548 | 30 | 30 | 1.94% | 1.94% | 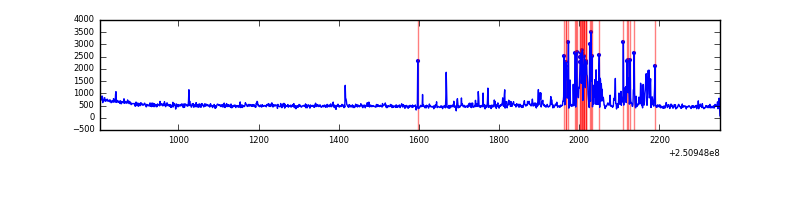 |
Top three noisy pixels from each quadrant. If the there are fewer than three noisy pixels in the level2.evt file, extra rows are filled as -1
| Pixel properties | Quadrant properties | ||||||
|---|---|---|---|---|---|---|---|
| Quadrant | DetID | PixID | Counts | Sigma | Mean | Median | Sigma |
| A | 1 | 162 | 27043 | 625.58 | 201 | 196 | 42.9 |
| A | 1 | 178 | 13295 | 305.23 | 201 | 196 | 42.9 |
| A | 1 | 161 | 11754 | 269.32 | 201 | 196 | 42.9 |
| B | 4 | 239 | 173763 | 4314.49 | 197 | 192 | 40.2 |
| B | 0 | 219 | 56726 | 1405.28 | 197 | 192 | 40.2 |
| B | 11 | 51 | 33889 | 837.61 | 197 | 192 | 40.2 |
| C | 13 | 61 | 1397 | 26.04 | 191 | 191 | 46.3 |
| C | 0 | 207 | 1195 | 21.68 | 191 | 191 | 46.3 |
| C | -1 | -1 | -1 | -1.0 | 191 | 191 | 46.3 |
| D | 1 | 52 | 157471 | 3318.41 | 191 | 185 | 47.4 |
| D | 10 | 50 | 20405 | 426.6 | 191 | 185 | 47.4 |
| D | 8 | 195 | 10879 | 225.62 | 191 | 185 | 47.4 |
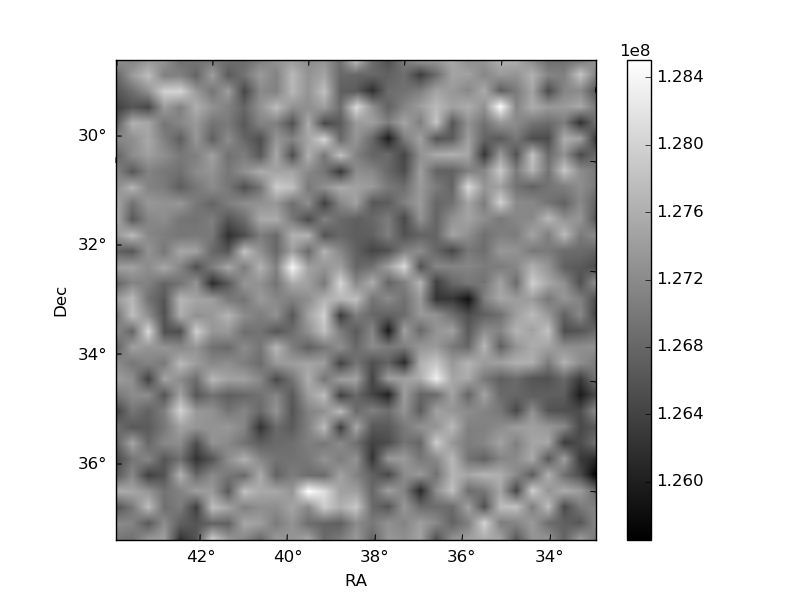
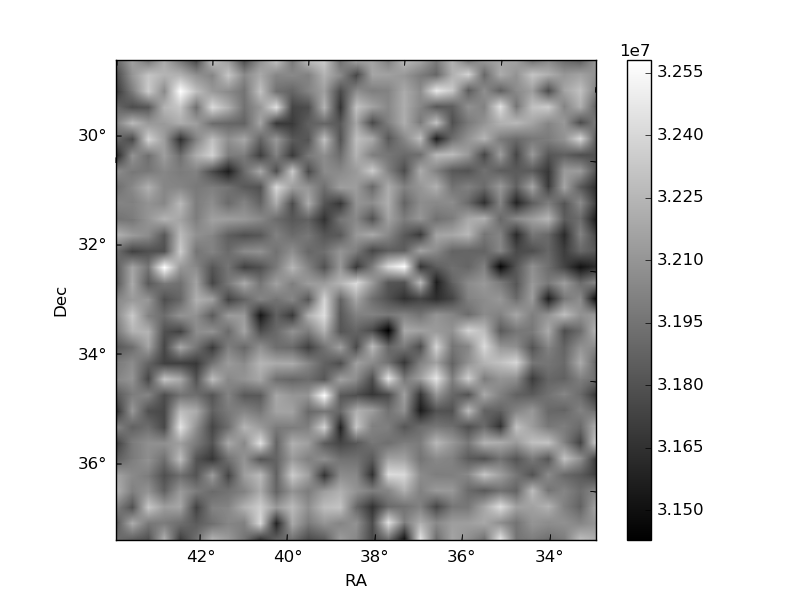
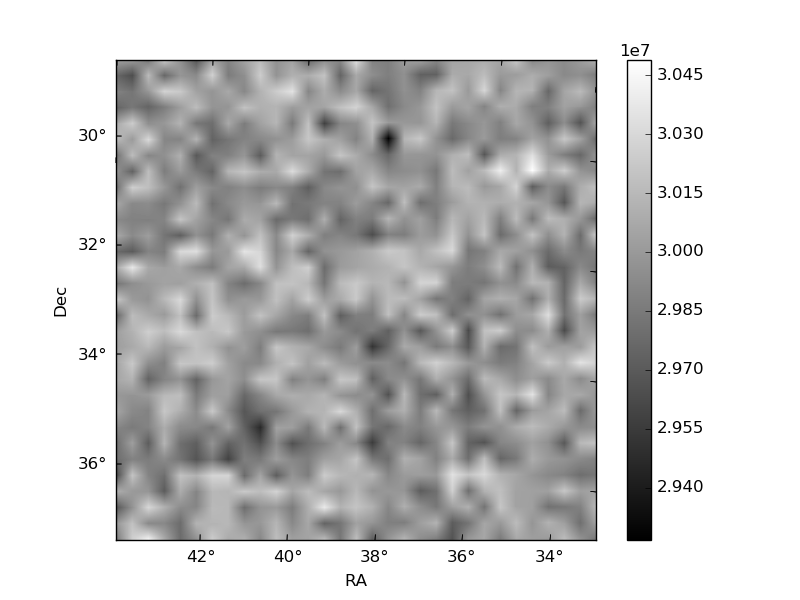
Histogram calculated using DETX and DETY for each event in the final _common_clean file
| Quadrant A | 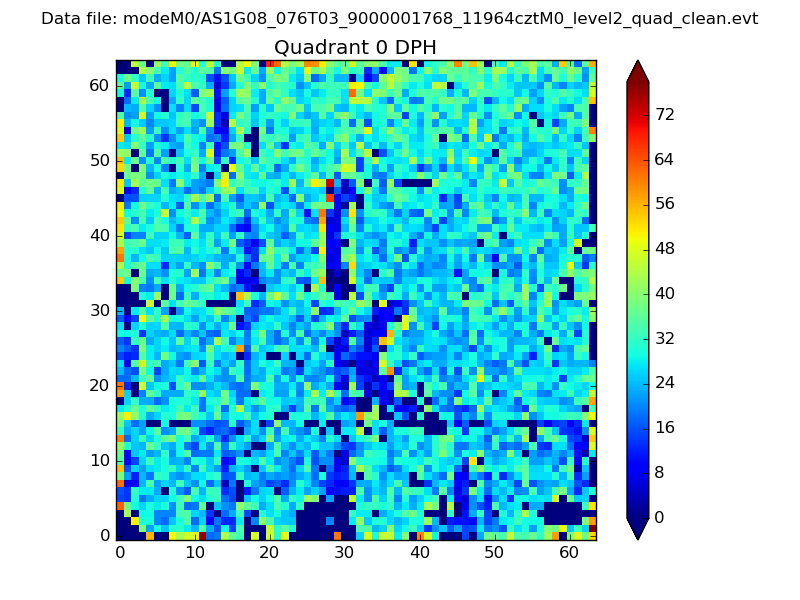 |
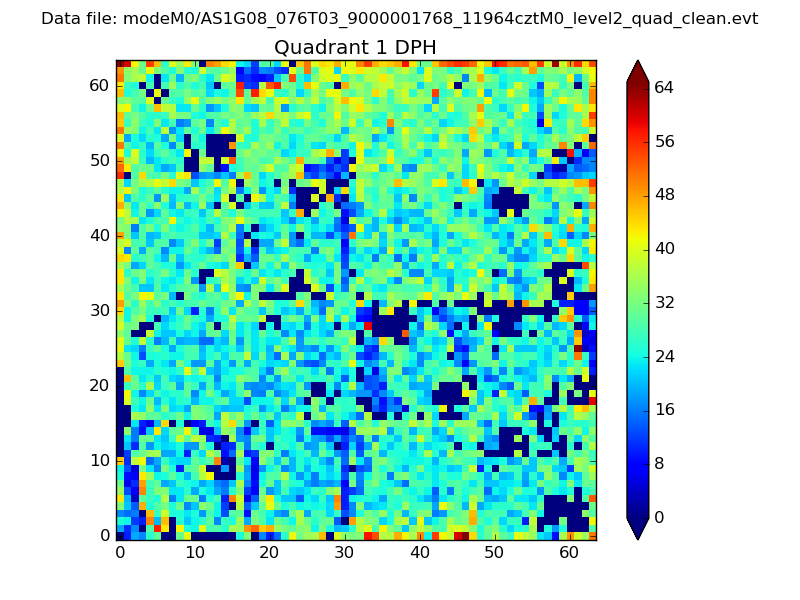 |
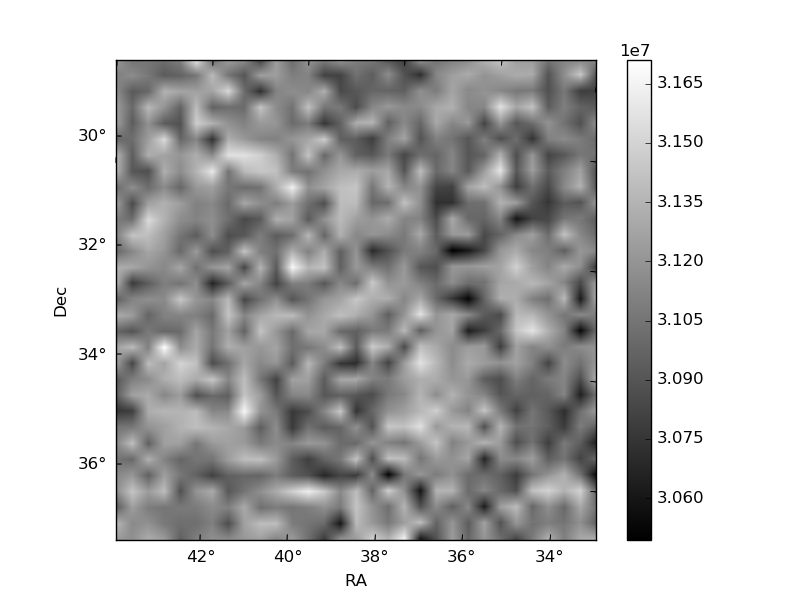
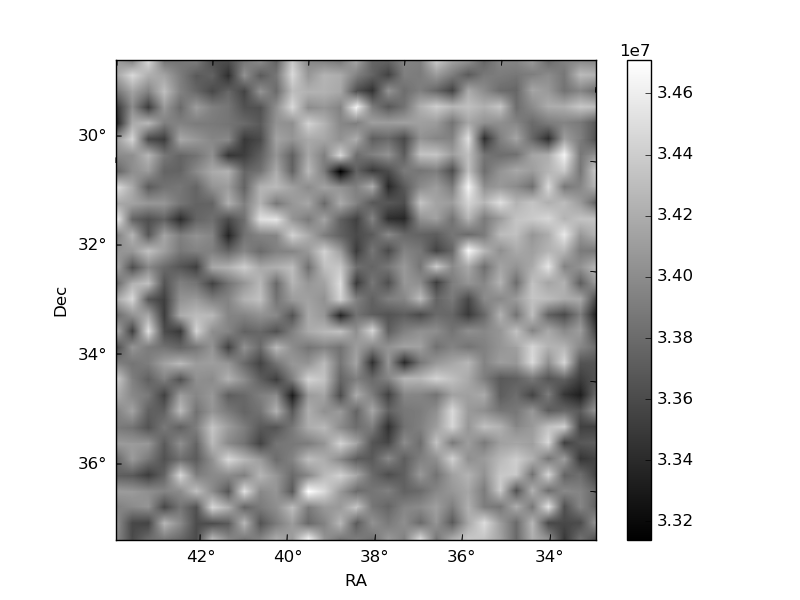
Quadrant B |
|---|---|---|---|
| Quadrant D | 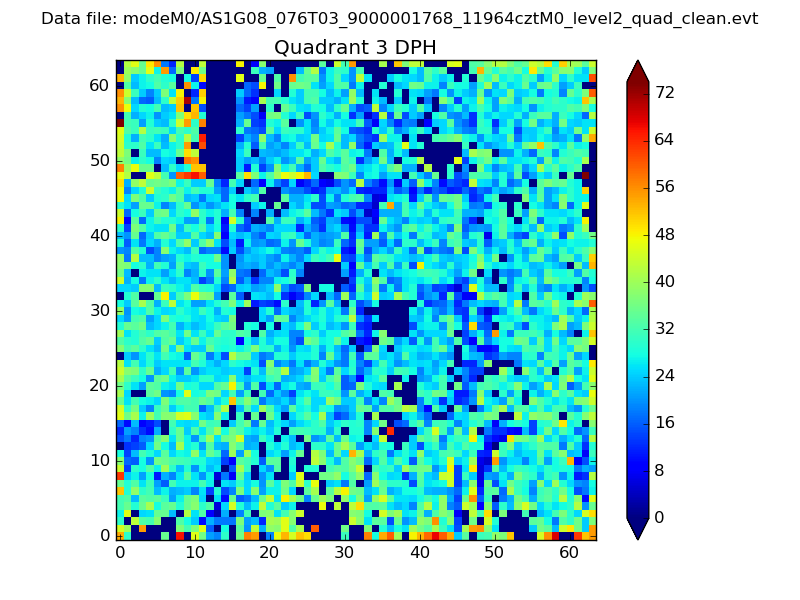 |
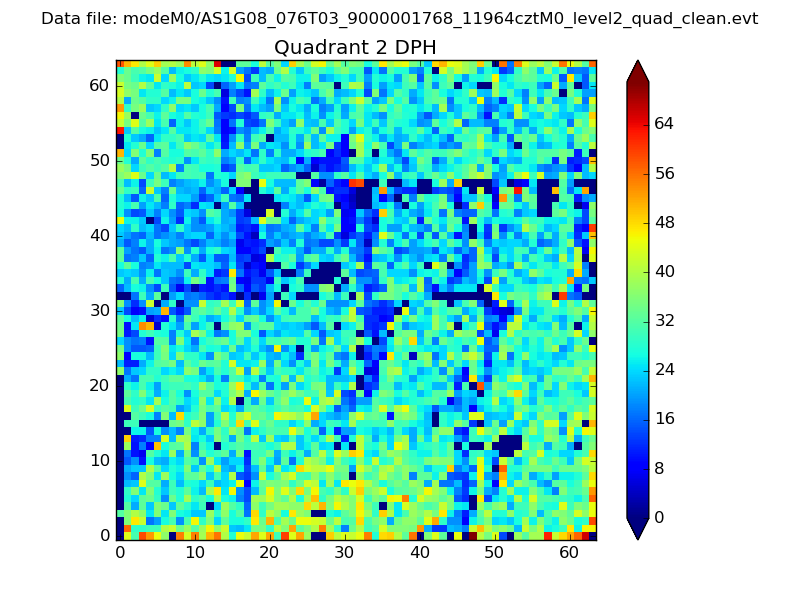 |
Quadrant C |
| Plot type | Count rate plots | Images |
|---|---|---|
| Comparison with Poisson distribution Blue bars denote a histogram of data divided into 1 sec bins. Red curve is a Poisson curve with rate = median count rate of data. |
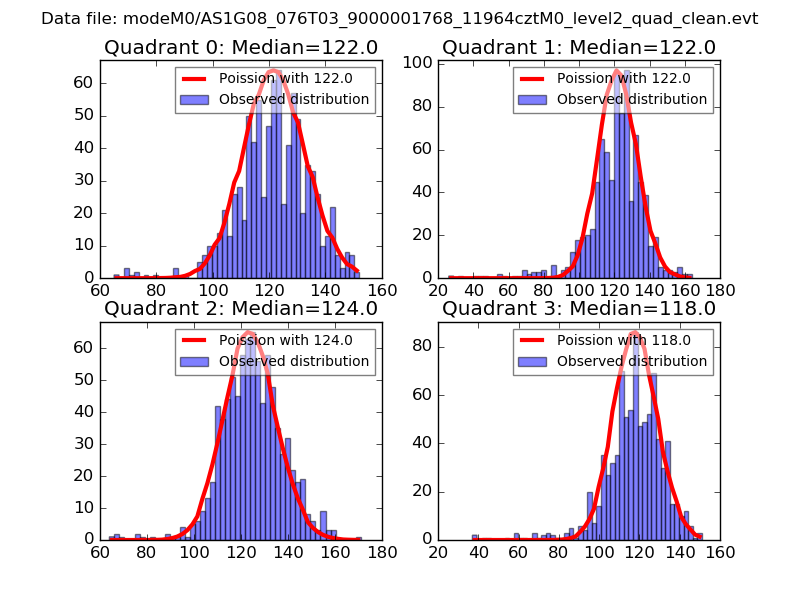 |
 |
| Quadrant-wise count rates Data is divided into 100 sec bins |
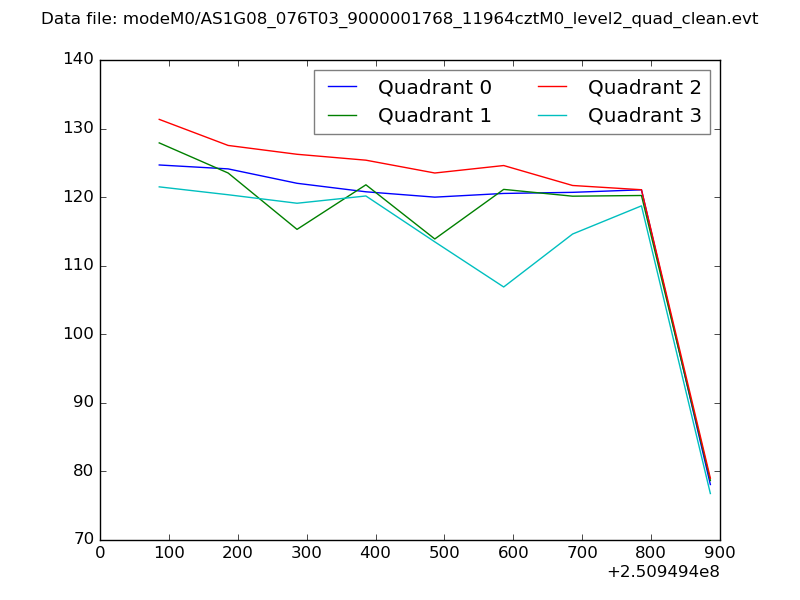 |
|
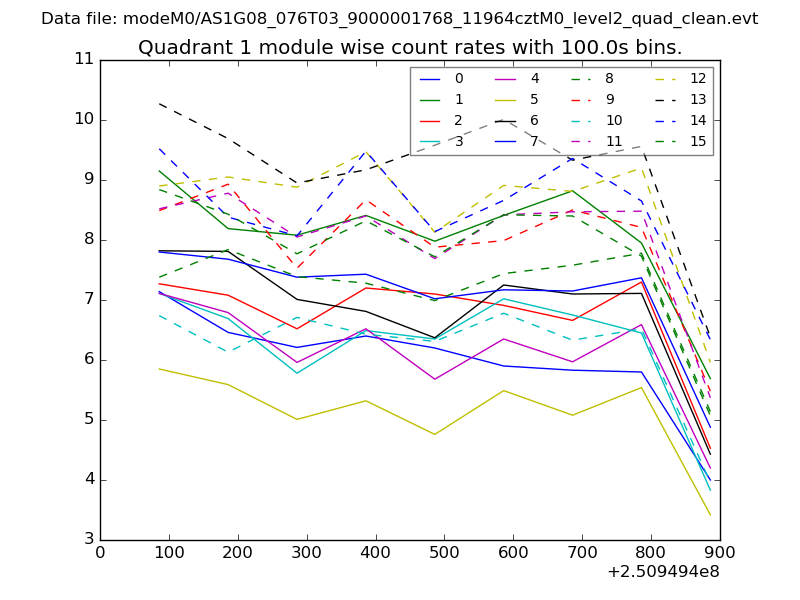
| Module-wise count rates for Quadrant A Data is divided into 100 sec bins |
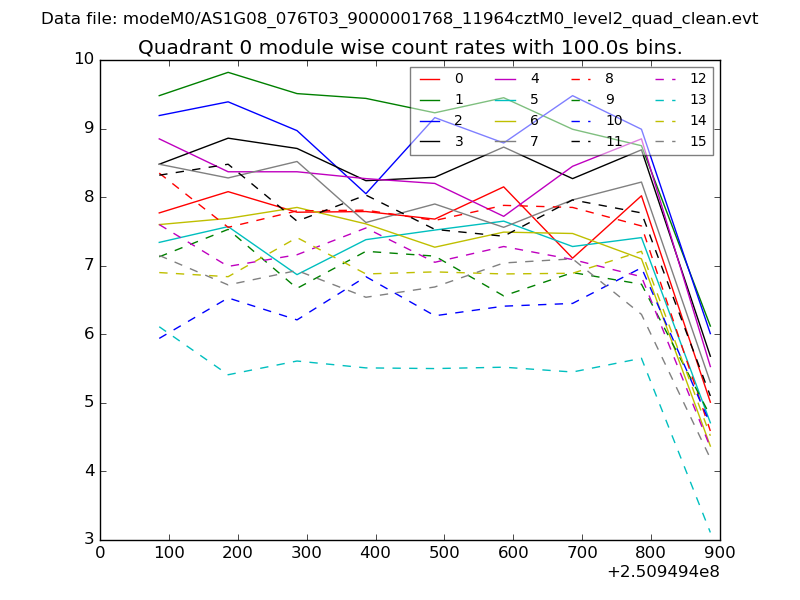 |
 |
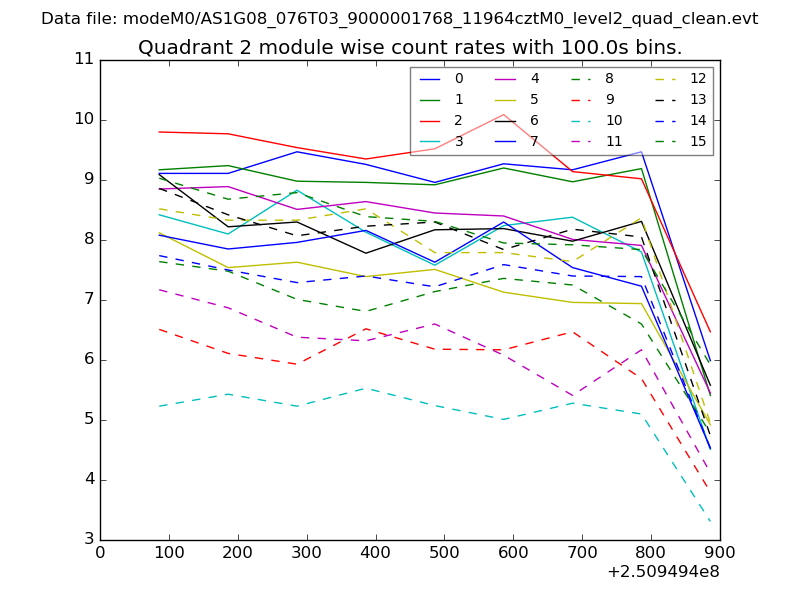
| Module-wise count rates for Quadrant B Data is divided into 100 sec bins |
 |
 |
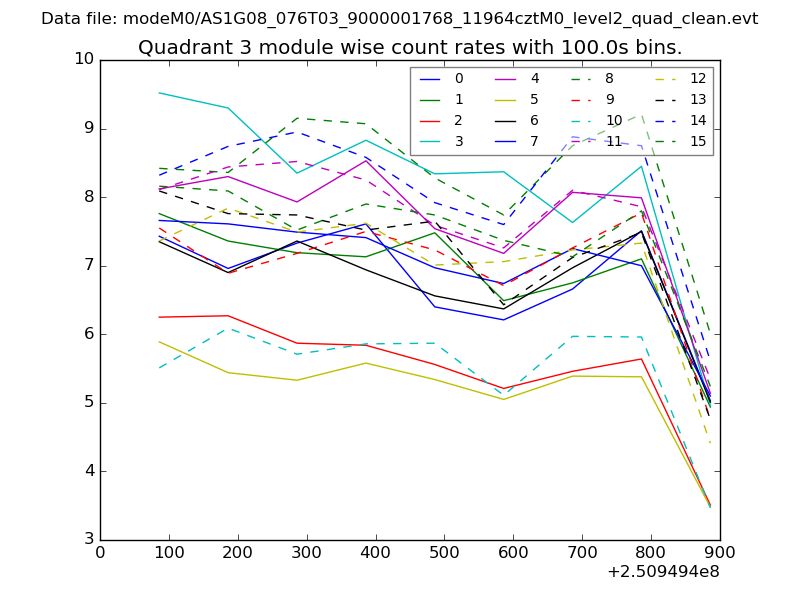
| Module-wise count rates for Quadrant C Data is divided into 100 sec bins |
 |
 |
| Module-wise count rates for Quadrant D Data is divided into 100 sec bins |
 |
 |
| Parameter | Plot |
|---|---|
| CZT HV Monitor | 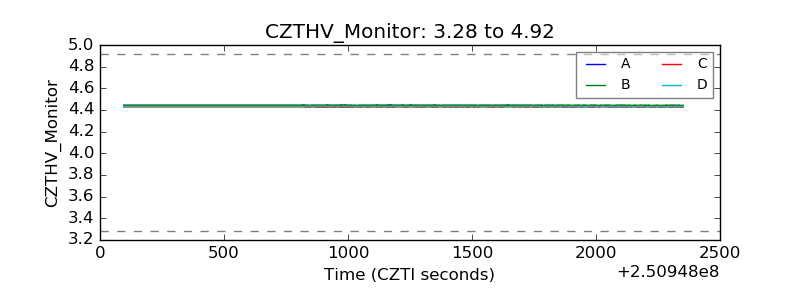 |
| D_VDD | 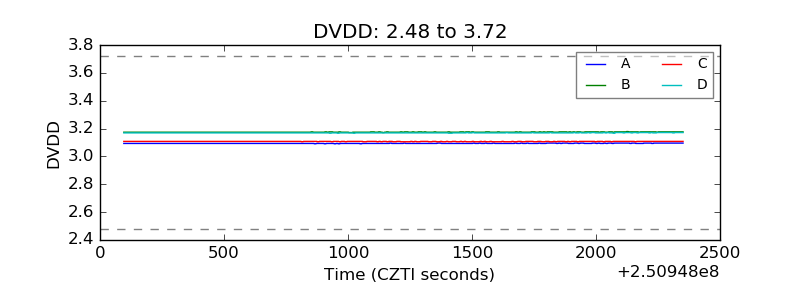 |
| Temperature 1 | 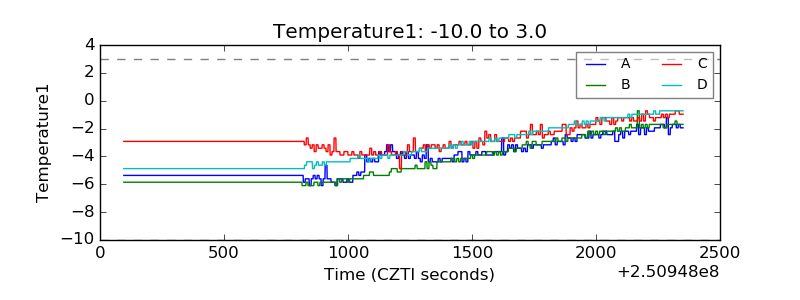 |
| Veto HV Monitor | 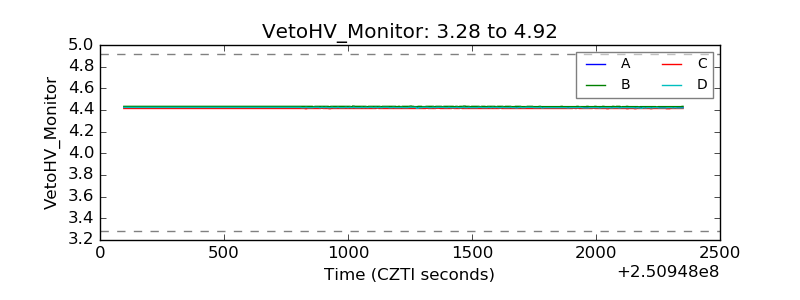 |
| Veto LLD | 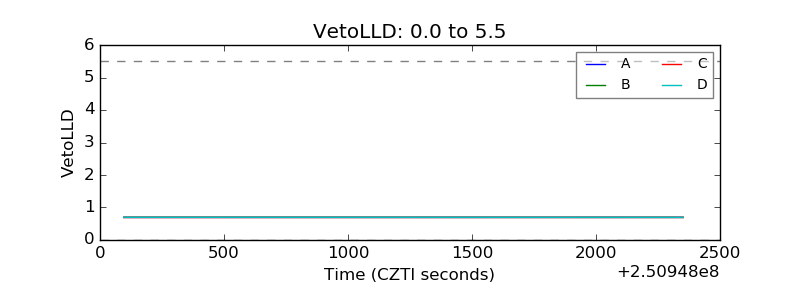 |
| Alpha Counter | 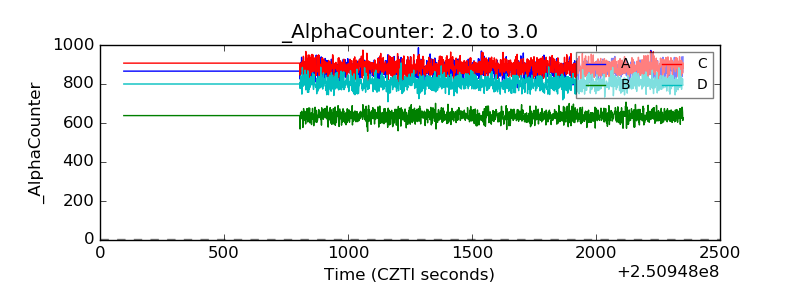 |
| _CPM_Rate | 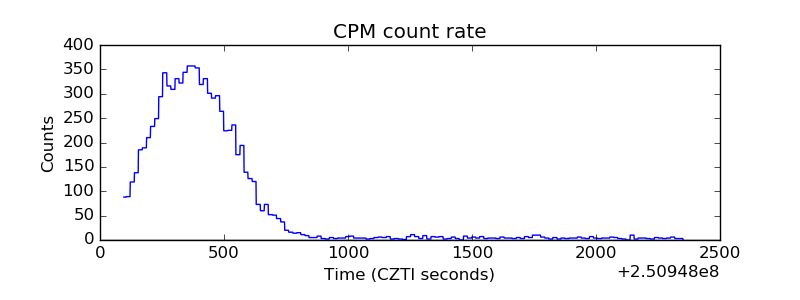 |
| CZT Counter | 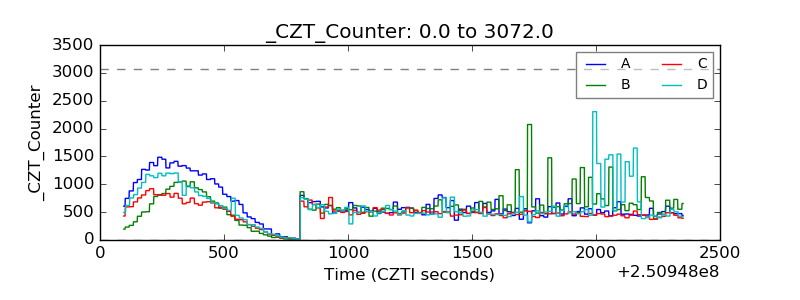 |
| +2.5 Volts monitor |  |
| +5 Volts monitor | 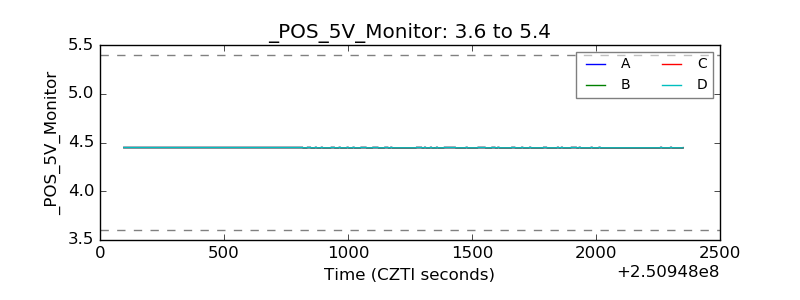 |
| _ROLL_ROT | 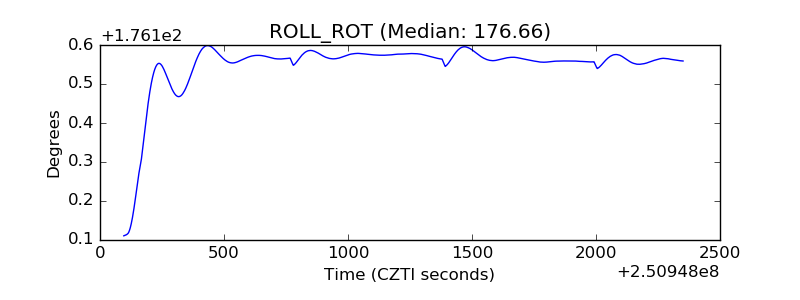 |
| _Roll_DEC | 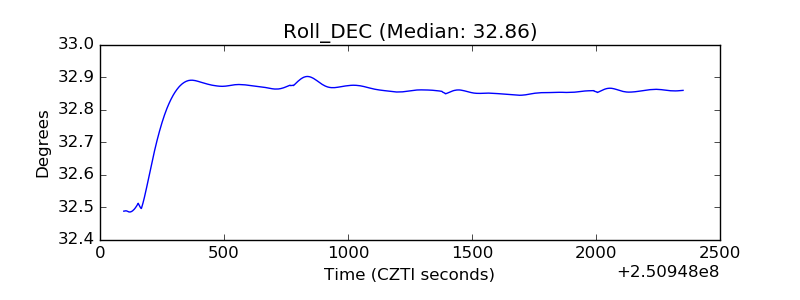 |
| _Roll_RA | 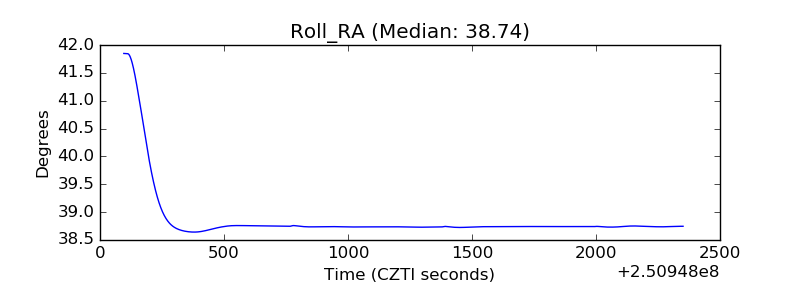 |
| Veto Counter | 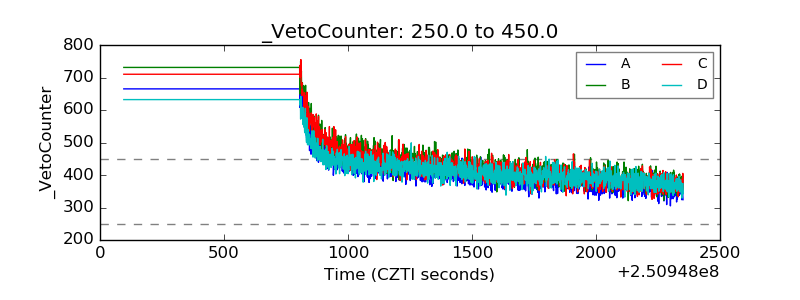 |