| Param | Original file | Final file |
|---|---|---|
| Filename | modeM0/AS1G08_076T03_9000001768_11965cztM0_level2.evt | modeM0/AS1G08_076T03_9000001768_11965cztM0_level2_quad_clean.evt |
| Size (bytes) | 456,125,760 | 90,671,040 |
| Size | 435.0 MB | 86.5 MB |
| Events in quadrant A | 3,125,648 | 587,623 |
| Events in quadrant B | 4,122,096 | 572,486 |
| Events in quadrant C | 2,743,584 | 593,256 |
| Events in quadrant D | 3,409,533 | 567,967 |
| Mode SS | |||
|---|---|---|---|
| Quadrant | BADHDUFLAG | Total packets | Discarded packets |
| A | 0 | 124 | 0 |
| B | 0 | 124 | 0 |
| C | 0 | 124 | 0 |
| D | 0 | 124 | 0 |
| Mode M9 | |||
|---|---|---|---|
| Quadrant | BADHDUFLAG | Total packets | Discarded packets |
| A | 0 | 10 | 0 |
| B | 0 | 10 | 0 |
| C | 0 | 10 | 0 |
| D | 0 | 10 | 0 |
| Mode M0 | |||
|---|---|---|---|
| Quadrant | BADHDUFLAG | Total packets | Discarded packets |
| A | 0 | 13279 | 2 |
| B | 0 | 16268 | 1 |
| C | 0 | 12347 | 1 |
| D | 0 | 14067 | 1 |
| Quadrant | Total seconds | Saturated seconds | Saturation percentage |
|---|---|---|---|
| A | 6078 | 70 | 1.151695% |
| B | 6078 | 357 | 5.873643% |
| C | 6078 | 30 | 0.493583% |
| D | 6078 | 109 | 1.793353% |
Noise dominated data is calculated using 1-second bins in cleaned event files. If a bin has >2000 counts, and if more than 50% of those come from <1% of pixels, then it is considered to be noise-dominated and hence unusable.
| Quadrant | # 1 sec bins | Bins with >0 counts | Bins with >2000 counts | High rate bins dominated by noise | Noise dominated (total time) | Noise dominated (detector-on time) | Marked lightcurve |
|---|---|---|---|---|---|---|---|
| A | 7055 | 6079 | 2 | 2 | 0.03% | 0.03% | 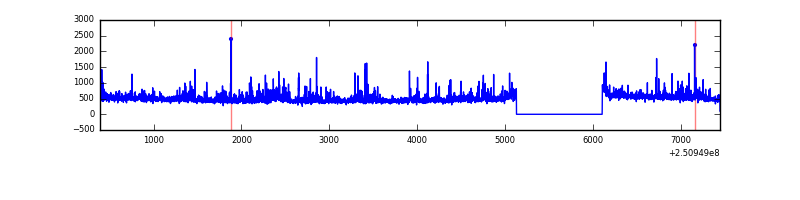 |
| B | 7055 | 6079 | 210 | 210 | 2.98% | 3.45% | 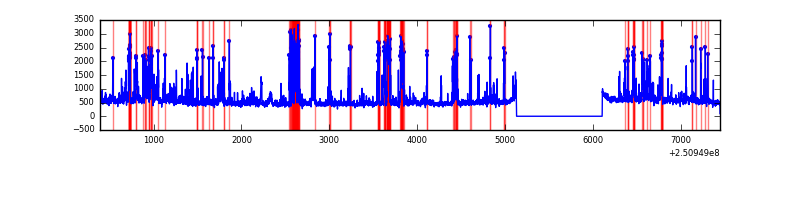 |
| C | 7055 | 6079 | 0 | 0 | 0.00% | 0.00% | 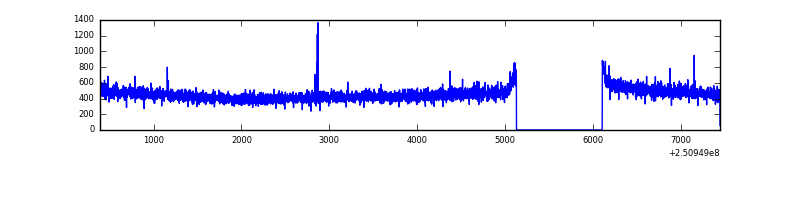 |
| D | 7055 | 6079 | 69 | 69 | 0.98% | 1.14% | 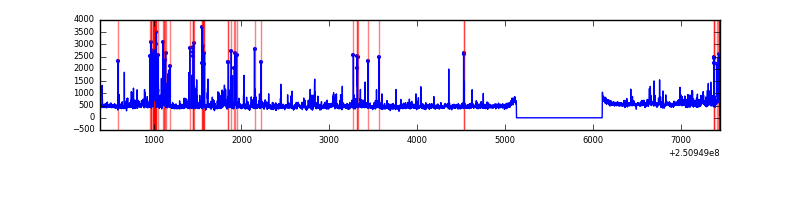 |
Top three noisy pixels from each quadrant. If the there are fewer than three noisy pixels in the level2.evt file, extra rows are filled as -1
| Pixel properties | Quadrant properties | ||||||
|---|---|---|---|---|---|---|---|
| Quadrant | DetID | PixID | Counts | Sigma | Mean | Median | Sigma |
| A | 1 | 162 | 115705 | 783.19 | 723 | 708 | 146.8 |
| A | 1 | 178 | 62427 | 420.34 | 723 | 708 | 146.8 |
| A | 1 | 161 | 54196 | 364.28 | 723 | 708 | 146.8 |
| B | 4 | 239 | 1014414 | 7405.87 | 706 | 690 | 136.9 |
| B | 15 | 204 | 131918 | 958.7 | 706 | 690 | 136.9 |
| B | 11 | 51 | 68343 | 494.25 | 706 | 690 | 136.9 |
| C | 14 | 234 | 6406 | 35.18 | 701 | 707 | 162.0 |
| C | 13 | 61 | 5251 | 28.05 | 701 | 707 | 162.0 |
| C | 0 | 207 | 4852 | 25.59 | 701 | 707 | 162.0 |
| D | 1 | 52 | 283803 | 1703.82 | 700 | 680 | 166.2 |
| D | 8 | 195 | 140273 | 840.07 | 700 | 680 | 166.2 |
| D | 13 | 104 | 78869 | 470.54 | 700 | 680 | 166.2 |
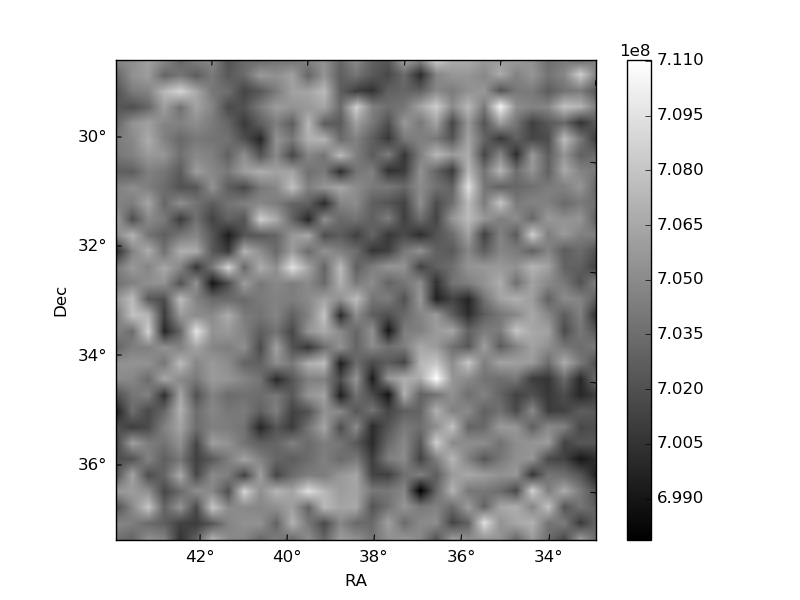
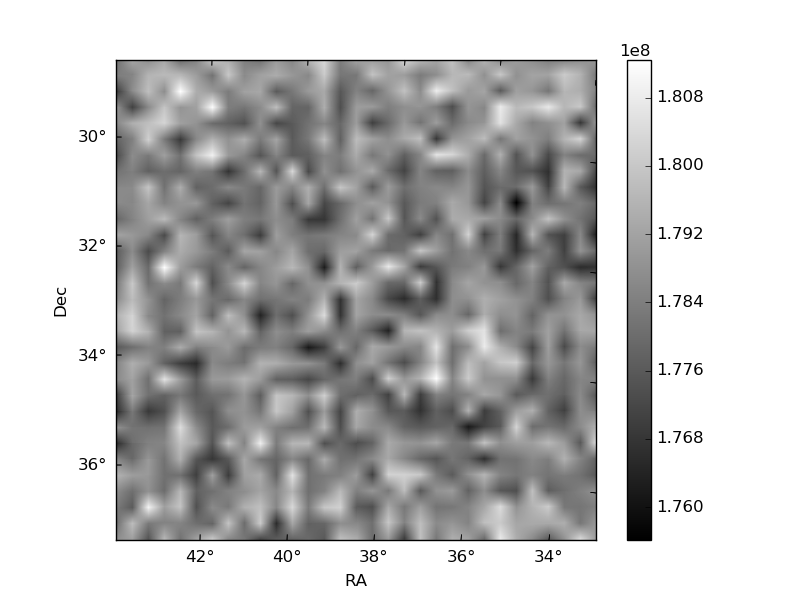
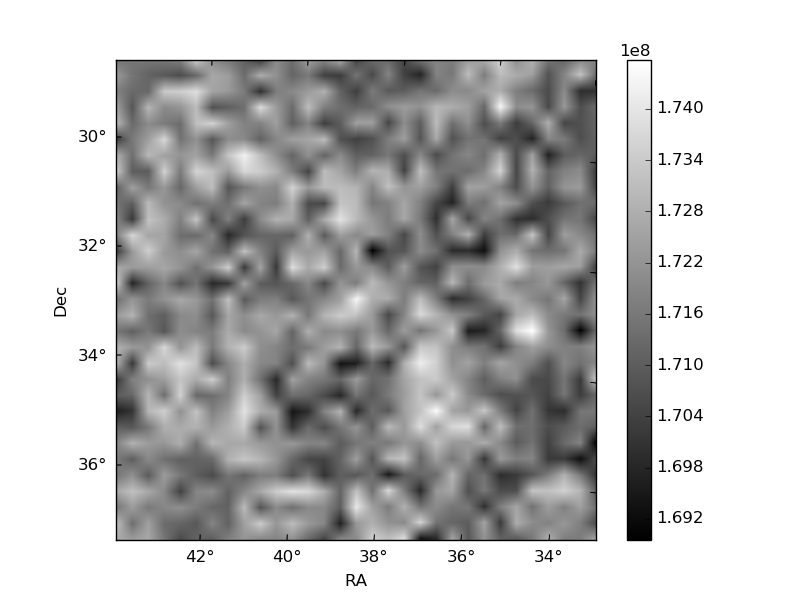
Histogram calculated using DETX and DETY for each event in the final _common_clean file
| Quadrant A | 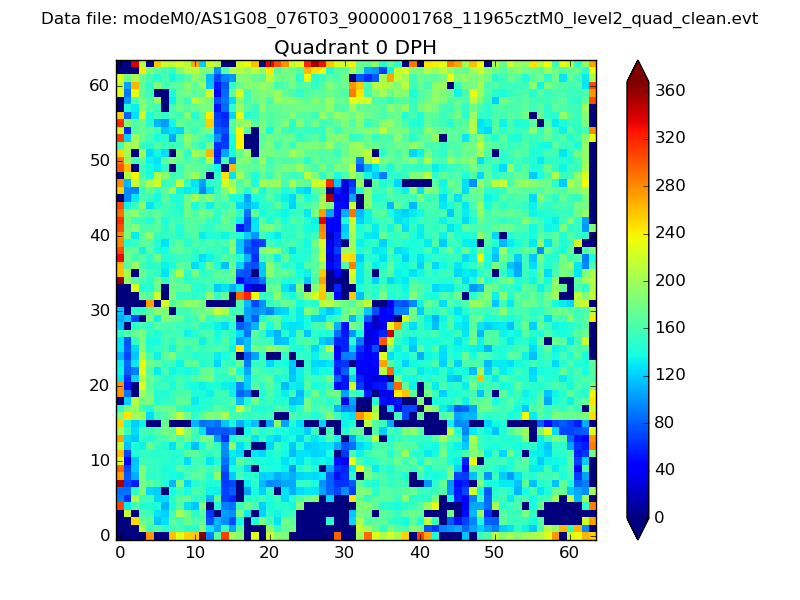 |
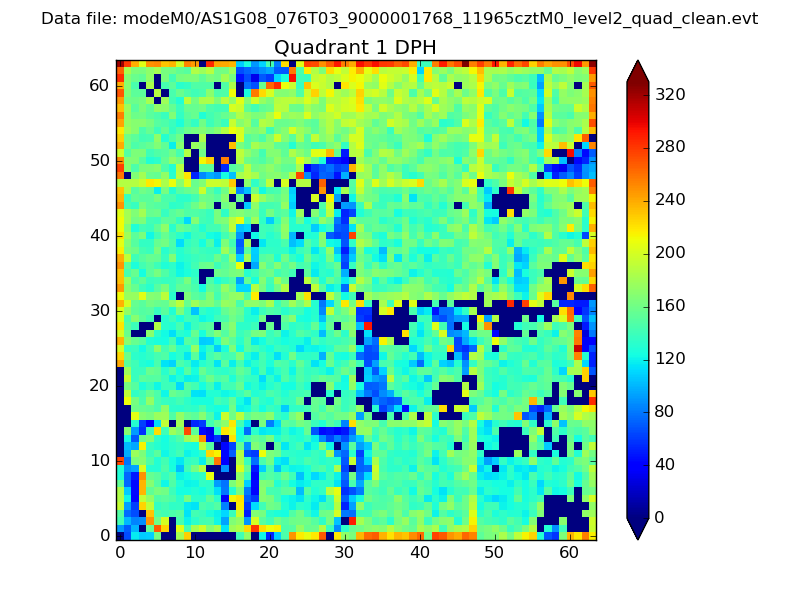 |
Quadrant B |
|---|---|---|---|
| Quadrant D | 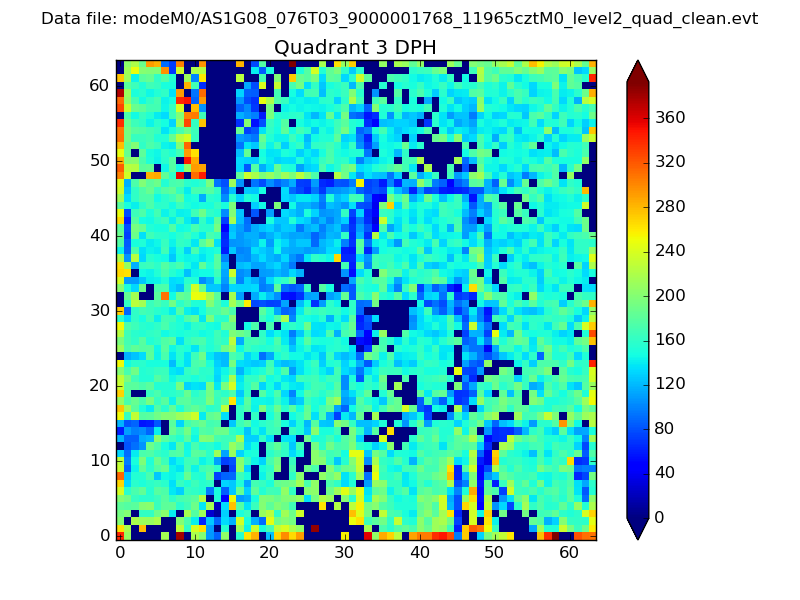 |
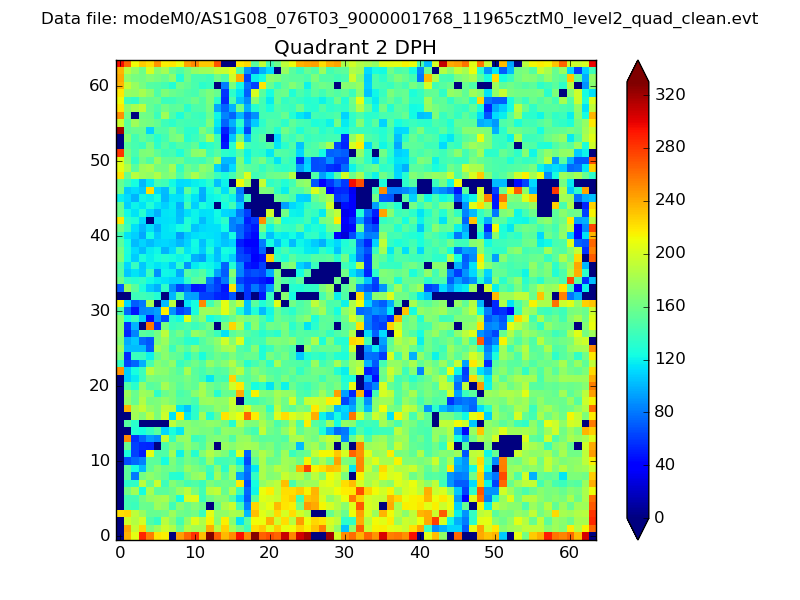 |
Quadrant C |
| Plot type | Count rate plots | Images |
|---|---|---|
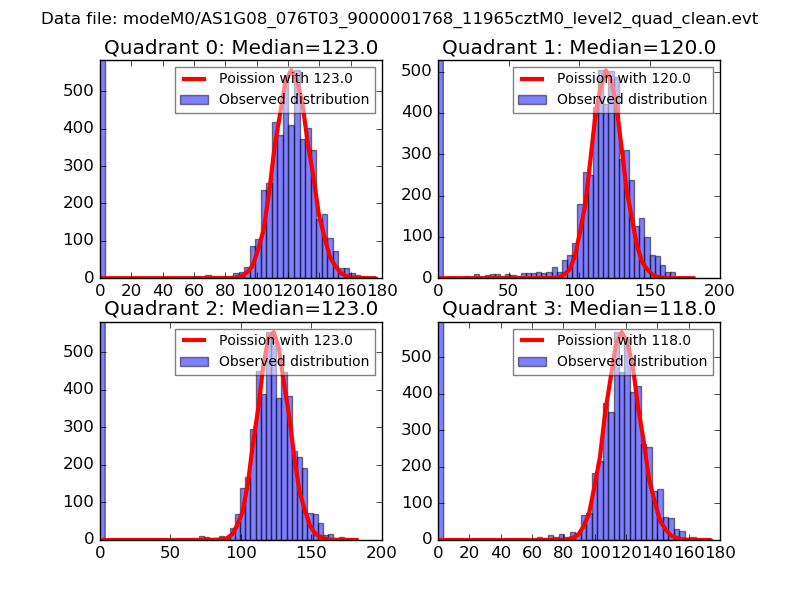
| Comparison with Poisson distribution Blue bars denote a histogram of data divided into 1 sec bins. Red curve is a Poisson curve with rate = median count rate of data. |
 |
 |
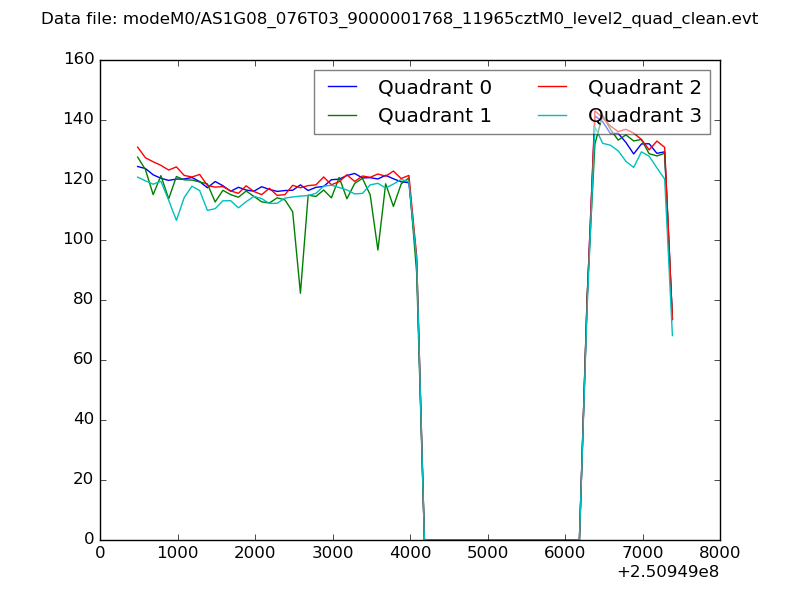
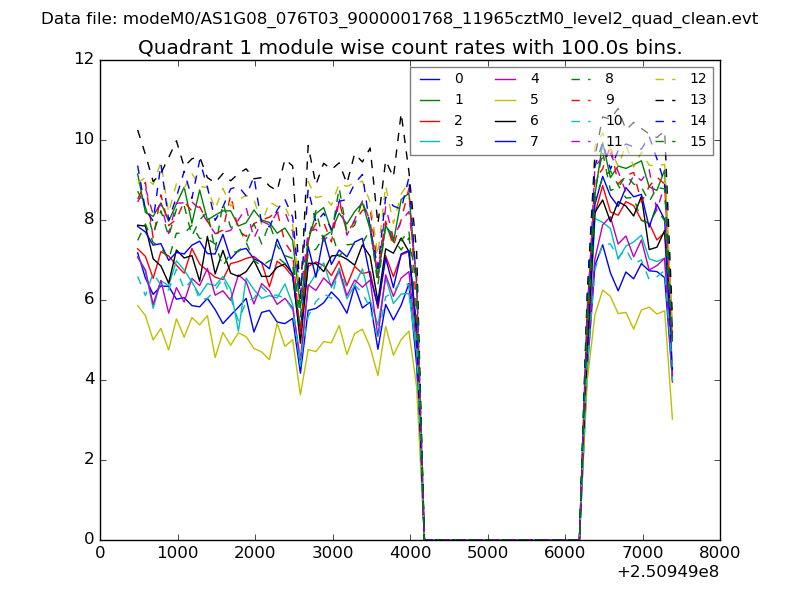
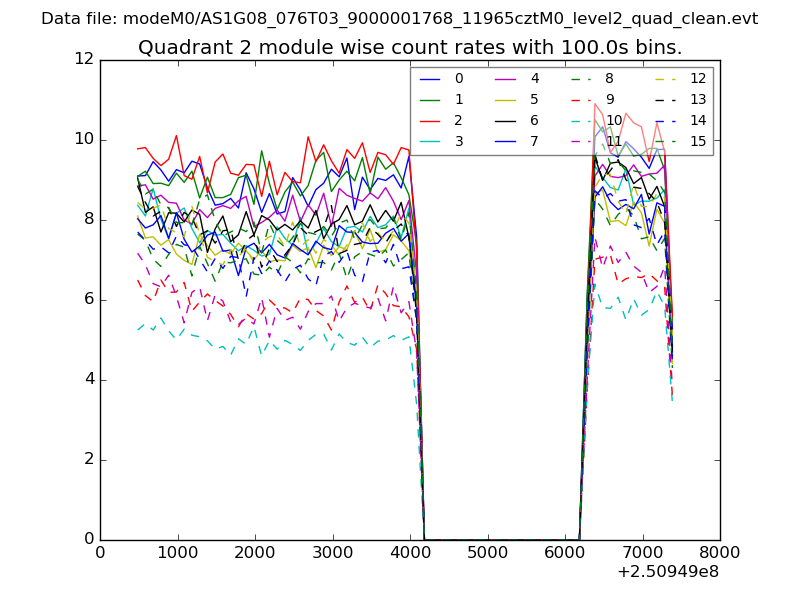
| Quadrant-wise count rates Data is divided into 100 sec bins |
 |
|
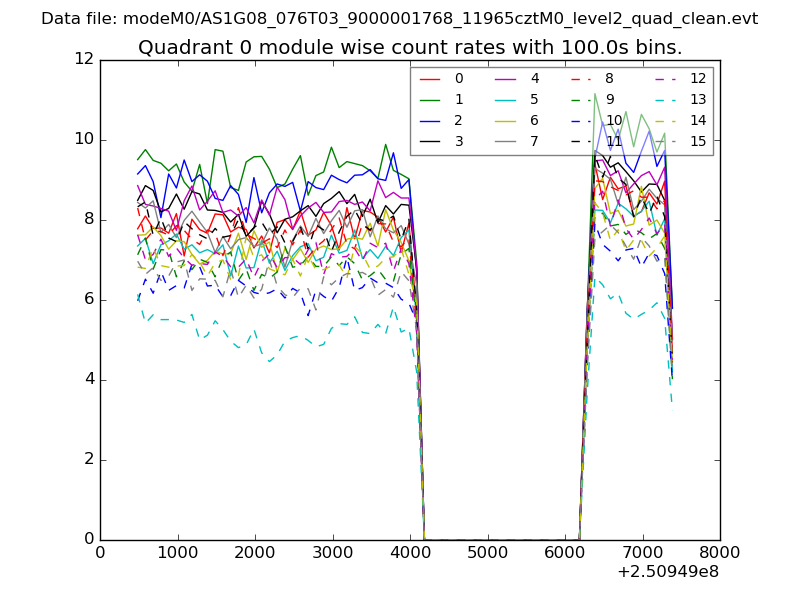
| Module-wise count rates for Quadrant A Data is divided into 100 sec bins |
 |
 |
| Module-wise count rates for Quadrant B Data is divided into 100 sec bins |
 |
 |
| Module-wise count rates for Quadrant C Data is divided into 100 sec bins |
 |
 |
| Module-wise count rates for Quadrant D Data is divided into 100 sec bins |
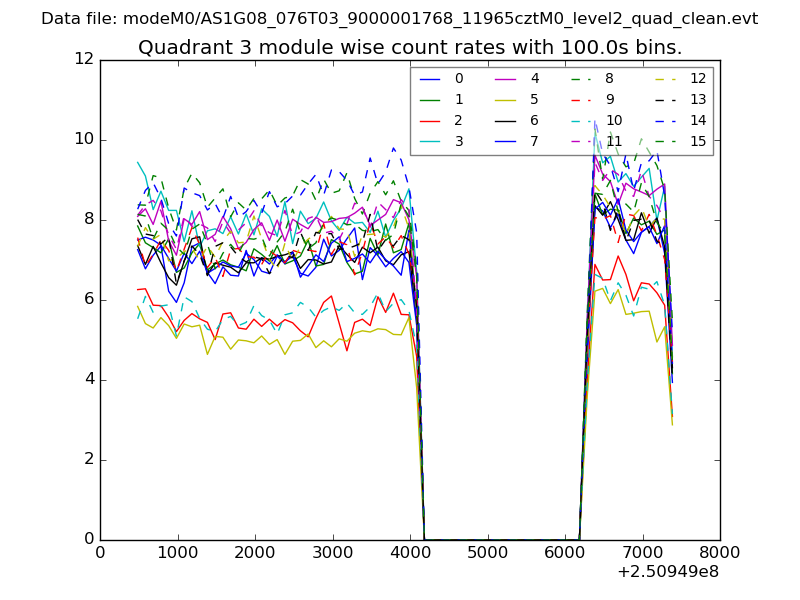 |
 |
| Parameter | Plot |
|---|---|
| CZT HV Monitor | 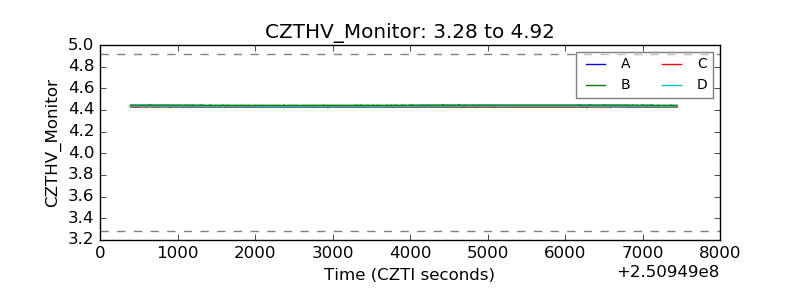 |
| D_VDD | 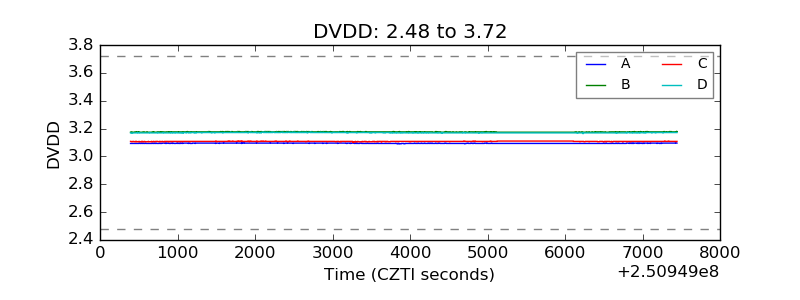 |
| Temperature 1 | 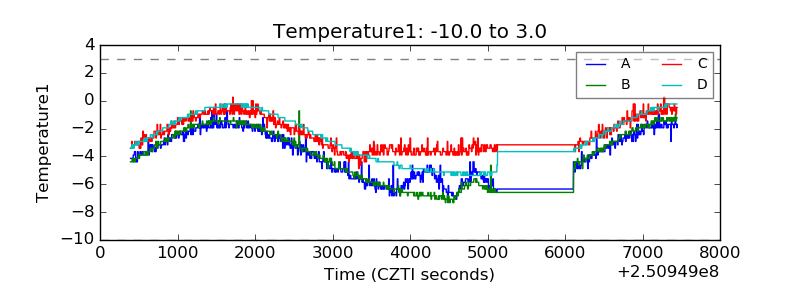 |
| Veto HV Monitor | 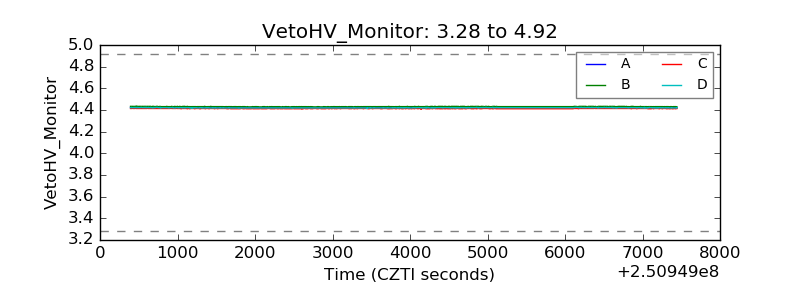 |
| Veto LLD | 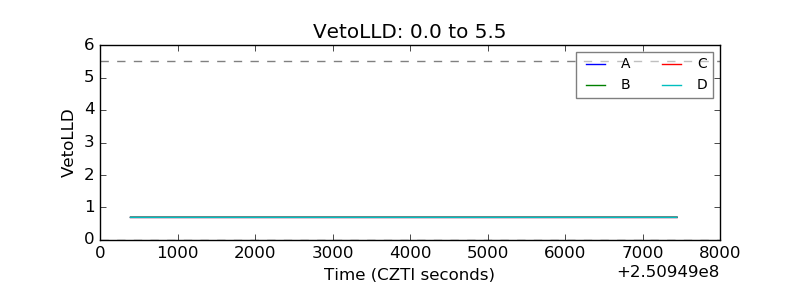 |
| Alpha Counter | 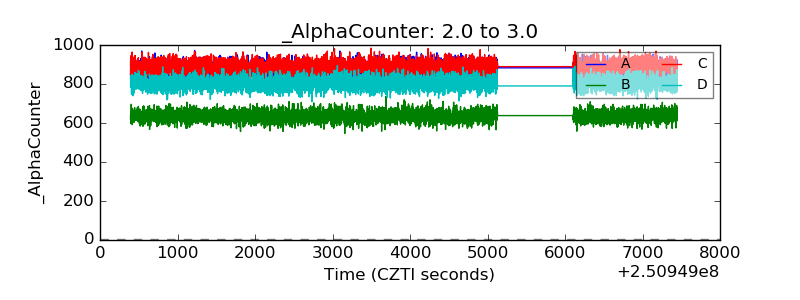 |
| _CPM_Rate | 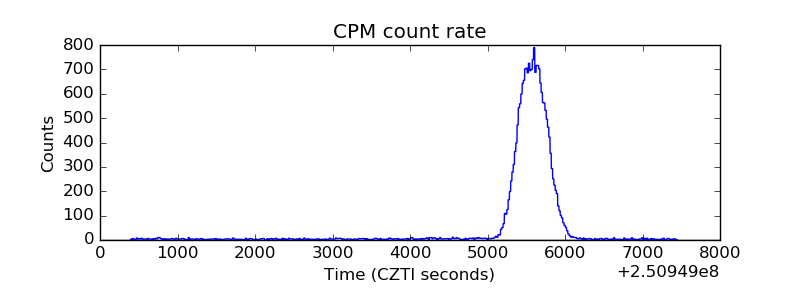 |
| CZT Counter | 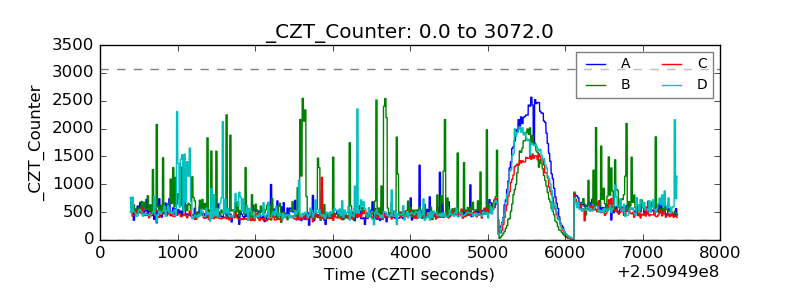 |
| +2.5 Volts monitor |  |
| +5 Volts monitor |  |
| _ROLL_ROT | 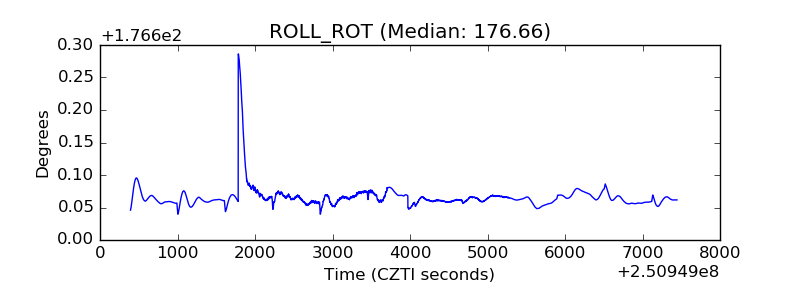 |
| _Roll_DEC | 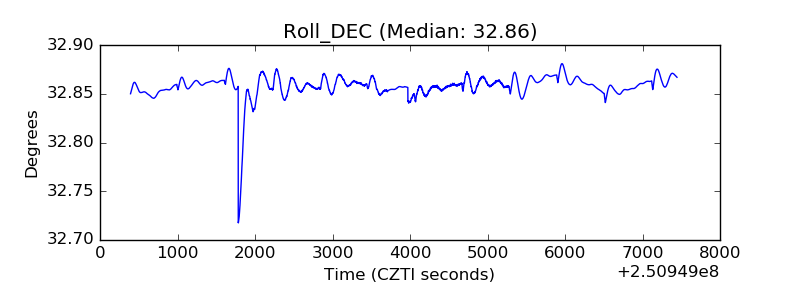 |
| _Roll_RA | 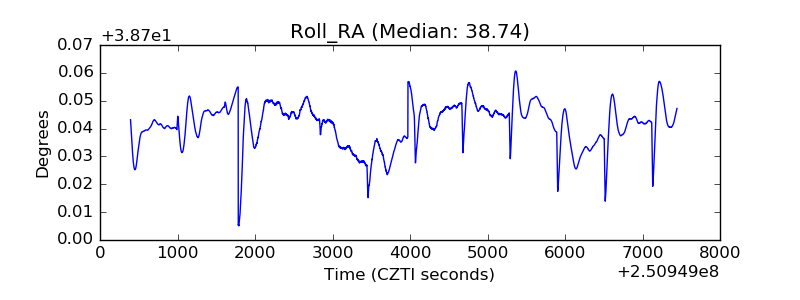 |
| Veto Counter | 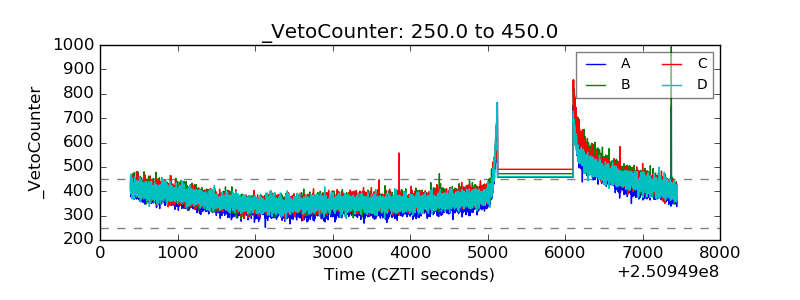 |