| Param | Original file | Final file |
|---|---|---|
| Filename | modeM0/AS1G08_076T03_9000001768_11969cztM0_level2.evt | modeM0/AS1G08_076T03_9000001768_11969cztM0_level2_quad_clean.evt |
| Size (bytes) | 137,341,440 | 32,967,360 |
| Size | 131.0 MB | 31.4 MB |
| Events in quadrant A | 1,053,266 | 223,627 |
| Events in quadrant B | 1,214,501 | 223,607 |
| Events in quadrant C | 761,450 | 224,596 |
| Events in quadrant D | 1,027,190 | 216,225 |
| Mode SS | |||
|---|---|---|---|
| Quadrant | BADHDUFLAG | Total packets | Discarded packets |
| A | 0 | 30 | 0 |
| B | 0 | 30 | 0 |
| C | 0 | 30 | 0 |
| D | 0 | 30 | 0 |
| Mode M9 | |||
|---|---|---|---|
| Quadrant | BADHDUFLAG | Total packets | Discarded packets |
| A | 1 | 273359709408 | 0 |
| B | 1 | -1 | -1 |
| C | 1 | -1 | -1 |
| D | 1 | -1 | -1 |
| Mode M0 | |||
|---|---|---|---|
| Quadrant | BADHDUFLAG | Total packets | Discarded packets |
| A | 0 | 4125 | 1 |
| B | 0 | 4687 | 1 |
| C | 0 | 3143 | 1 |
| D | 0 | 4170 | 1 |
| Quadrant | Total seconds | Saturated seconds | Saturation percentage |
|---|---|---|---|
| A | 1480 | 72 | 4.864865% |
| B | 1480 | 70 | 4.729730% |
| C | 1480 | 2 | 0.135135% |
| D | 1480 | 27 | 1.824324% |
Noise dominated data is calculated using 1-second bins in cleaned event files. If a bin has >2000 counts, and if more than 50% of those come from <1% of pixels, then it is considered to be noise-dominated and hence unusable.
| Quadrant | # 1 sec bins | Bins with >0 counts | Bins with >2000 counts | High rate bins dominated by noise | Noise dominated (total time) | Noise dominated (detector-on time) | Marked lightcurve |
|---|---|---|---|---|---|---|---|
| A | 1481 | 1481 | 55 | 55 | 3.71% | 3.71% | 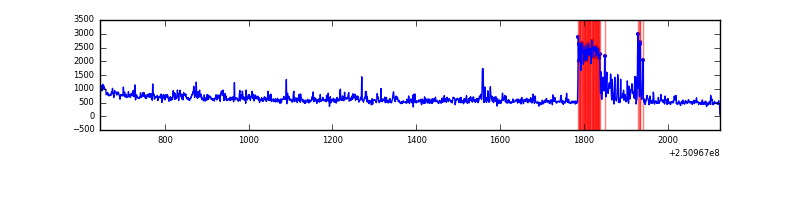 |
| B | 1481 | 1481 | 45 | 45 | 3.04% | 3.04% | 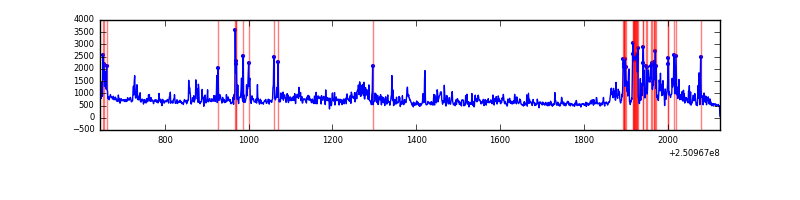 |
| C | 1481 | 1481 | 0 | 0 | 0.00% | 0.00% | 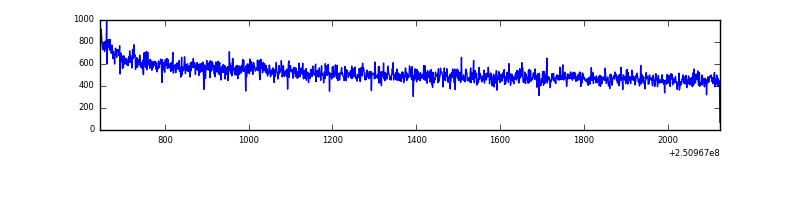 |
| D | 1481 | 1481 | 21 | 21 | 1.42% | 1.42% | 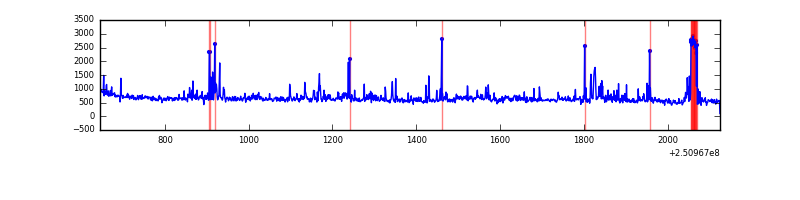 |
Top three noisy pixels from each quadrant. If the there are fewer than three noisy pixels in the level2.evt file, extra rows are filled as -1
| Pixel properties | Quadrant properties | ||||||
|---|---|---|---|---|---|---|---|
| Quadrant | DetID | PixID | Counts | Sigma | Mean | Median | Sigma |
| A | 11 | 29 | 103848 | 2428.95 | 204 | 200 | 42.7 |
| A | 6 | 254 | 65488 | 1530.0 | 204 | 200 | 42.7 |
| A | 1 | 162 | 36017 | 839.36 | 204 | 200 | 42.7 |
| B | 4 | 239 | 274309 | 6960.14 | 199 | 195 | 39.4 |
| B | 11 | 51 | 67222 | 1701.91 | 199 | 195 | 39.4 |
| B | 15 | 204 | 66612 | 1686.42 | 199 | 195 | 39.4 |
| C | 13 | 61 | 1444 | 27.15 | 195 | 195 | 46.0 |
| C | 7 | 247 | 507 | 6.78 | 195 | 195 | 46.0 |
| C | 3 | 202 | 481 | 6.22 | 195 | 195 | 46.0 |
| D | 8 | 195 | 94108 | 1938.99 | 199 | 194 | 48.4 |
| D | 13 | 112 | 37443 | 769.06 | 199 | 194 | 48.4 |
| D | 2 | 136 | 30055 | 616.52 | 199 | 194 | 48.4 |
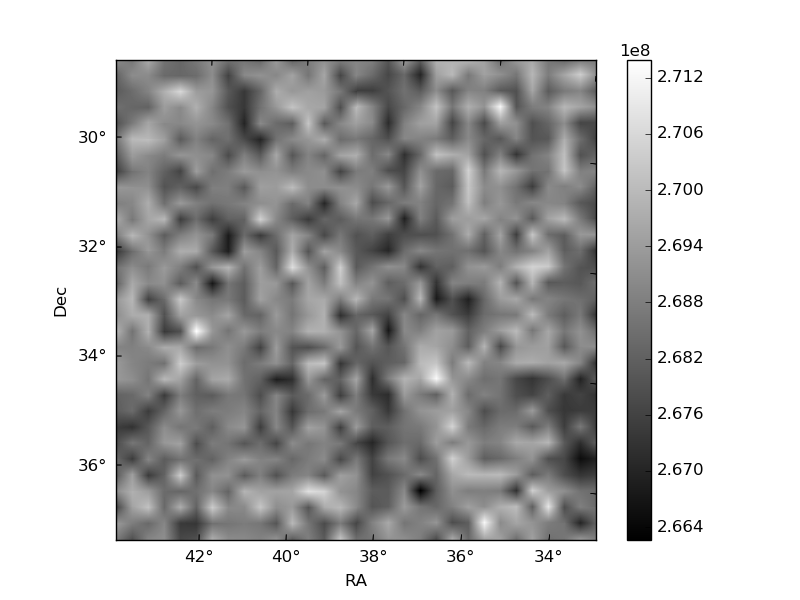
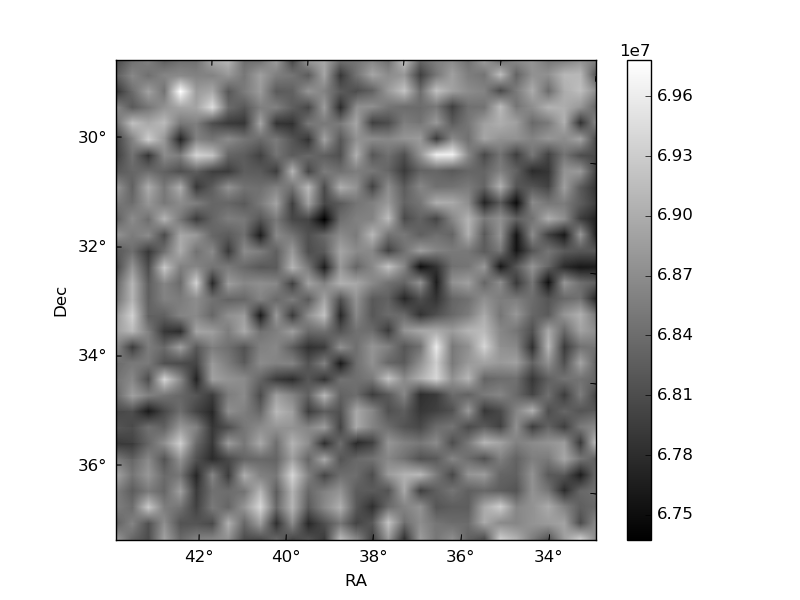
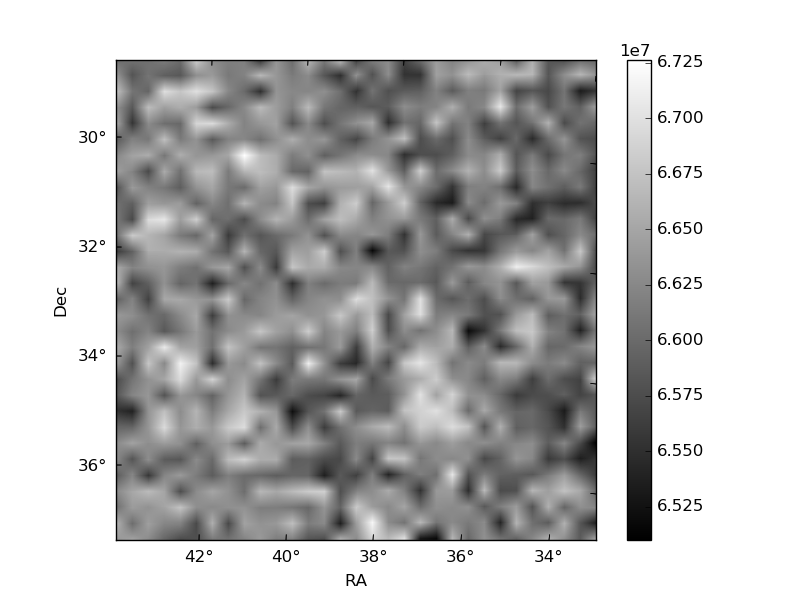
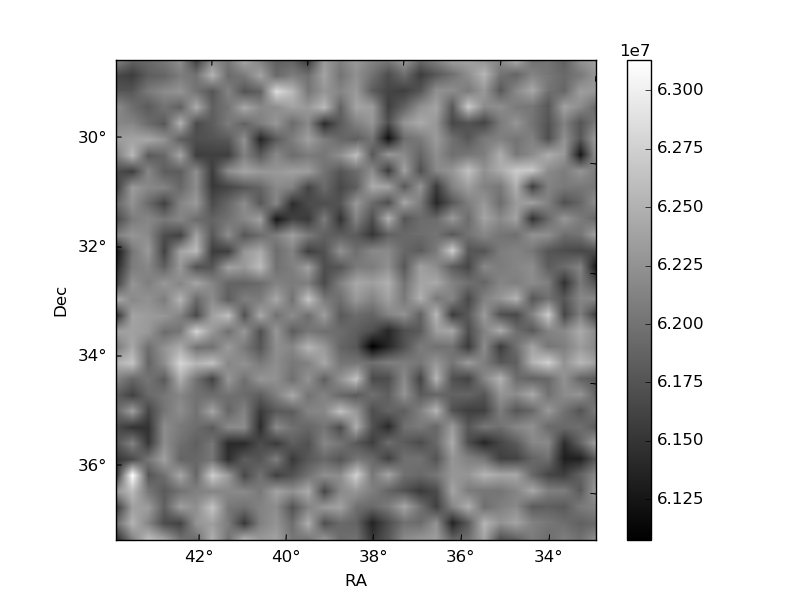
Histogram calculated using DETX and DETY for each event in the final _common_clean file
| Quadrant A | 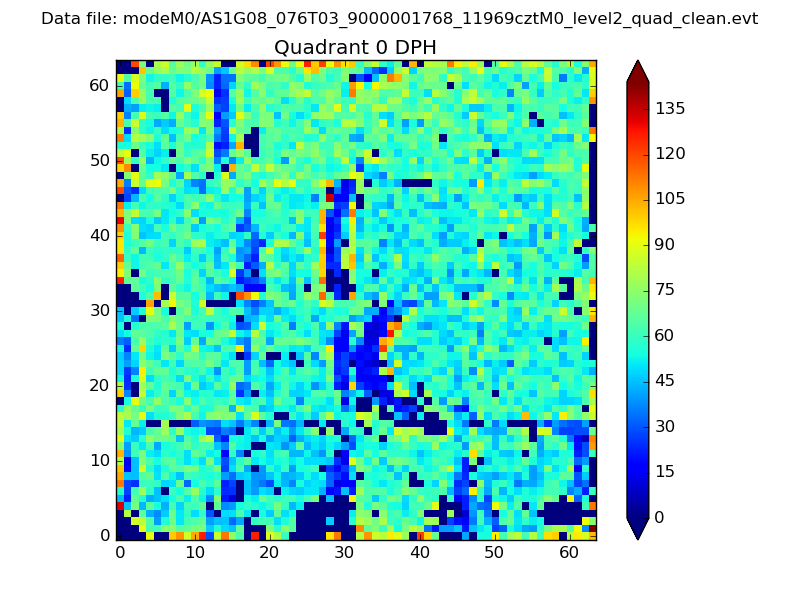 |
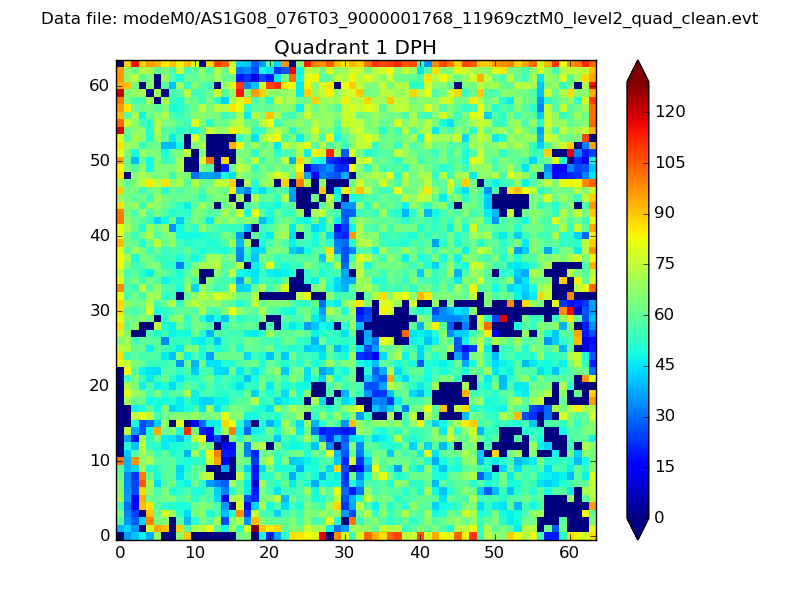 |
Quadrant B |
|---|---|---|---|
| Quadrant D | 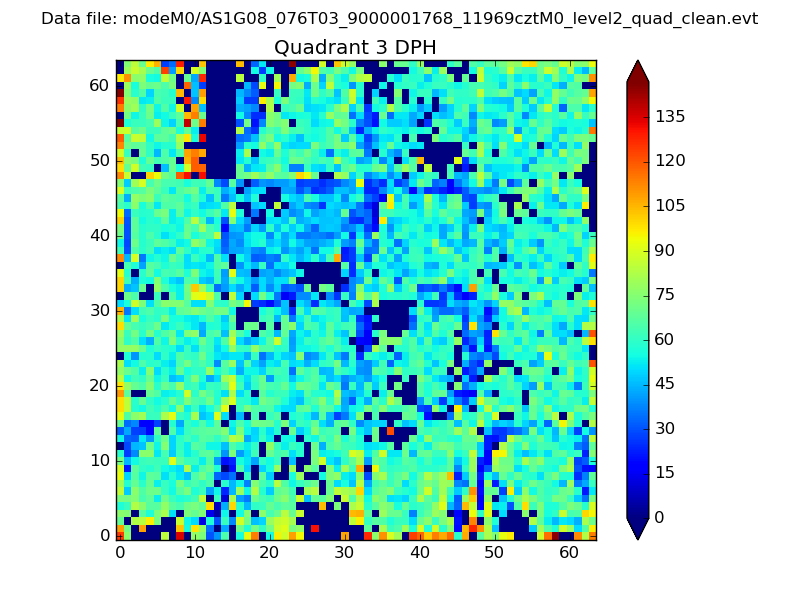 |
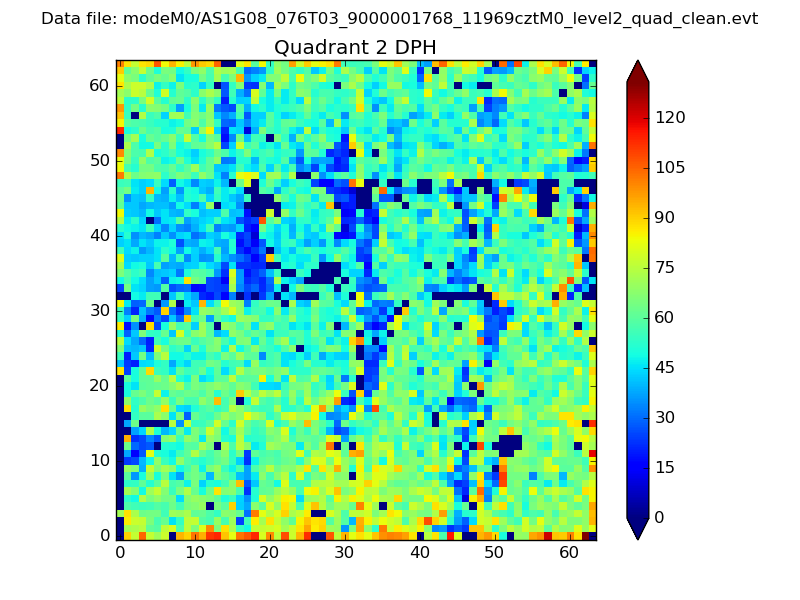 |
Quadrant C |
| Plot type | Count rate plots | Images |
|---|---|---|
| Comparison with Poisson distribution Blue bars denote a histogram of data divided into 1 sec bins. Red curve is a Poisson curve with rate = median count rate of data. |
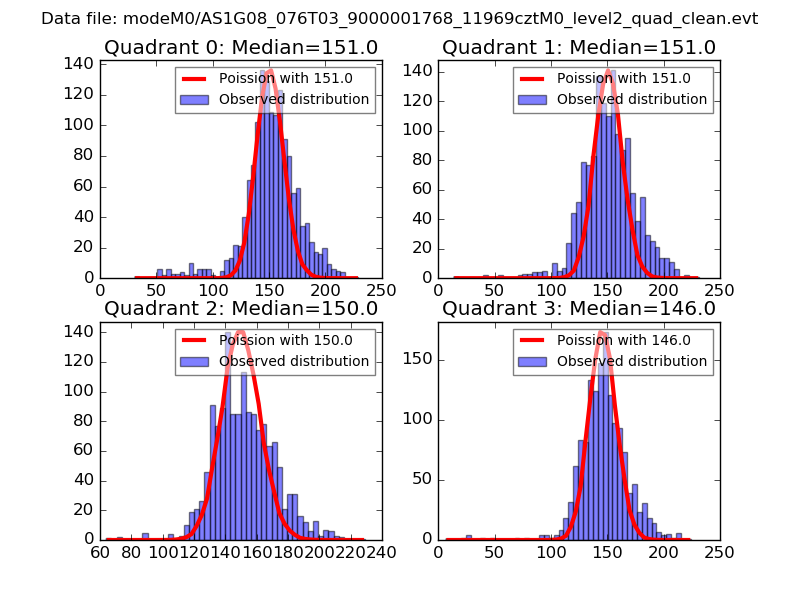 |
 |
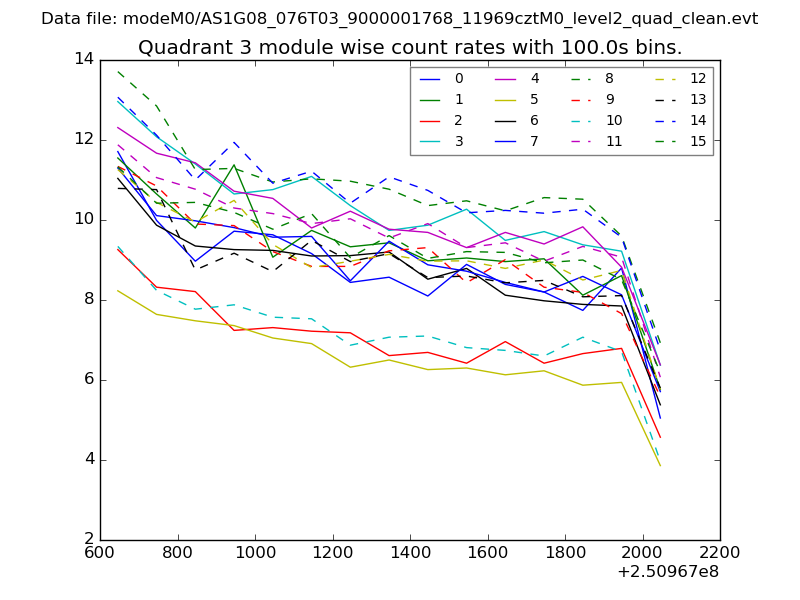
| Quadrant-wise count rates Data is divided into 100 sec bins |
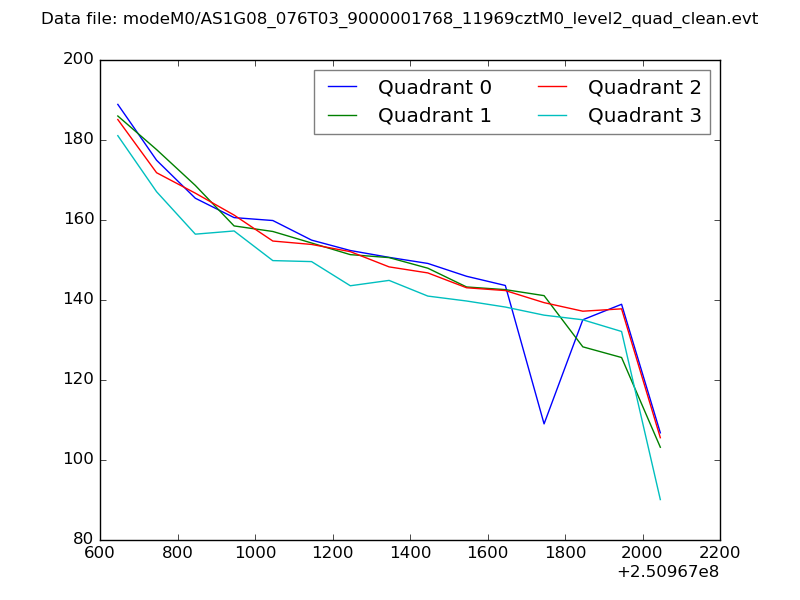 |
|
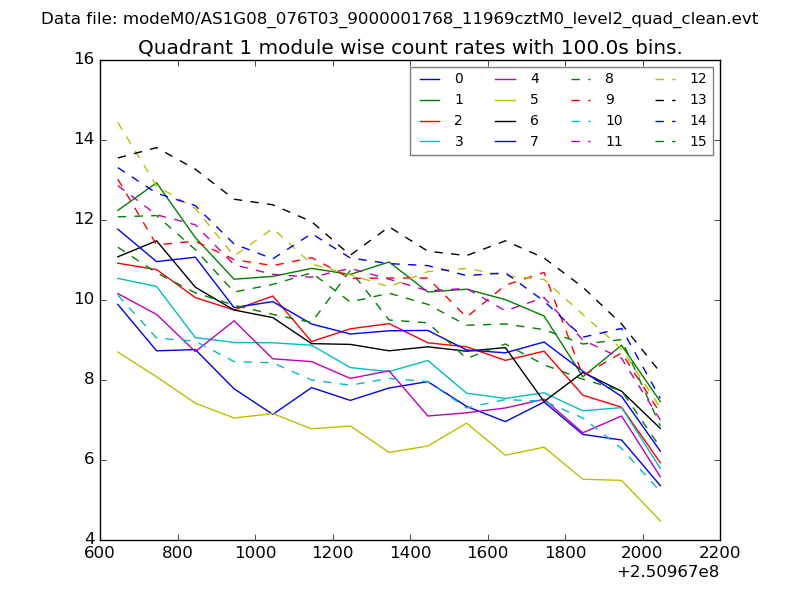
| Module-wise count rates for Quadrant A Data is divided into 100 sec bins |
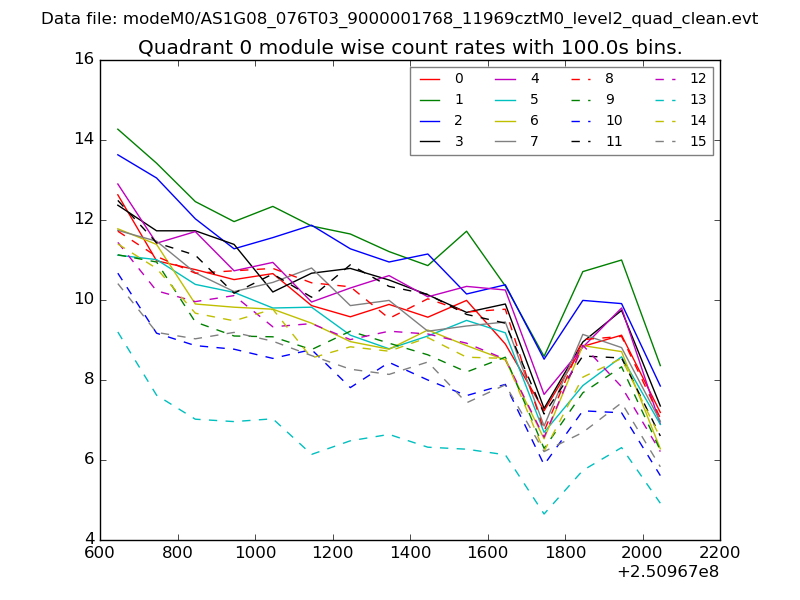 |
 |
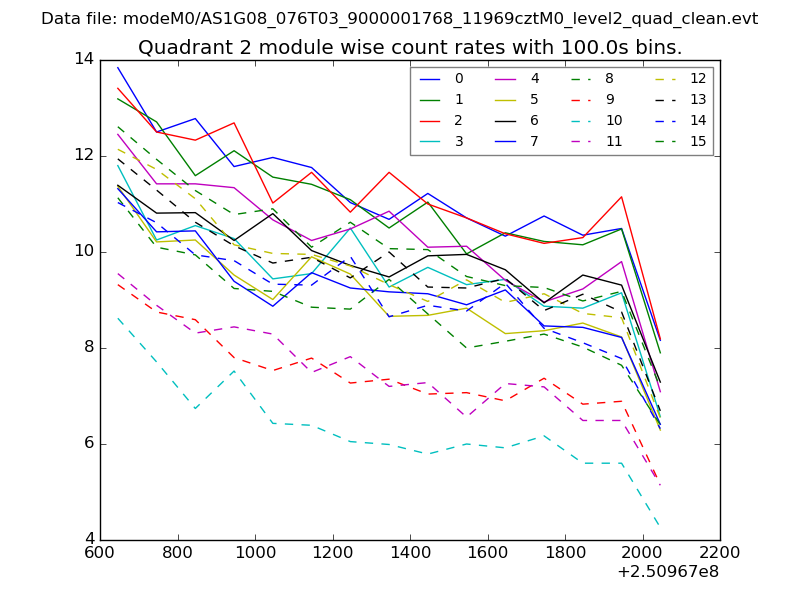
| Module-wise count rates for Quadrant B Data is divided into 100 sec bins |
 |
 |
| Module-wise count rates for Quadrant C Data is divided into 100 sec bins |
 |
 |
| Module-wise count rates for Quadrant D Data is divided into 100 sec bins |
 |
 |
| Parameter | Plot |
|---|---|
| CZT HV Monitor | 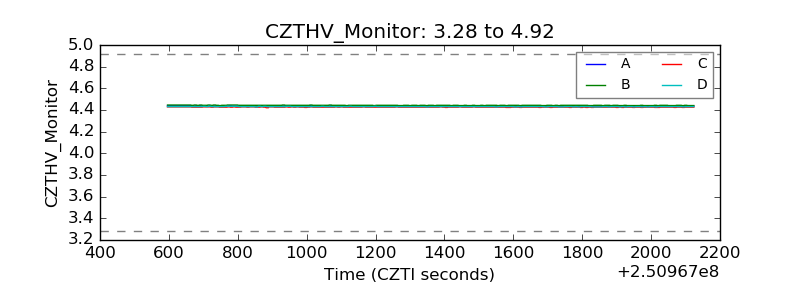 |
| D_VDD | 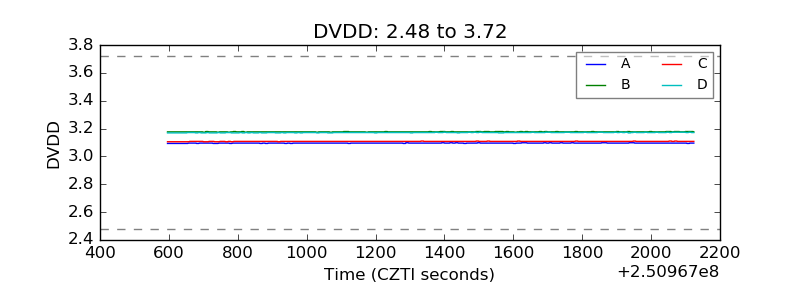 |
| Temperature 1 | 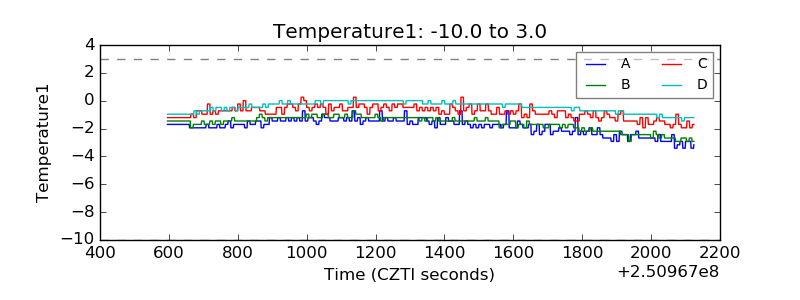 |
| Veto HV Monitor | 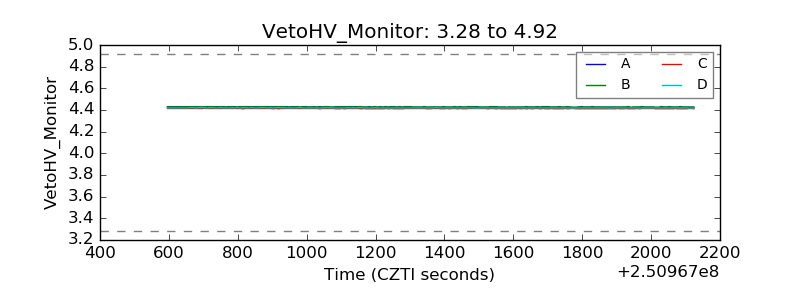 |
| Veto LLD | 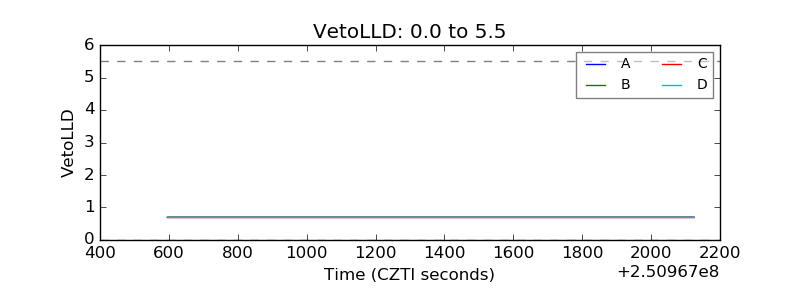 |
| Alpha Counter | 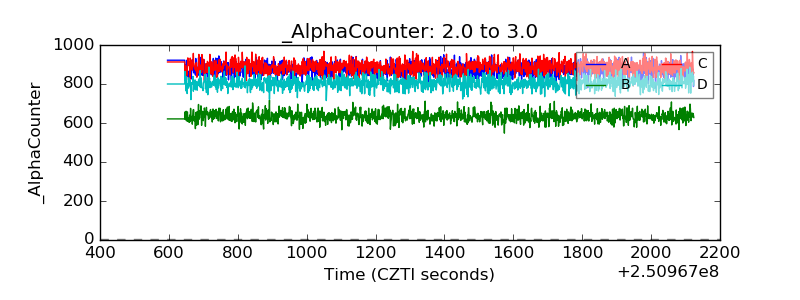 |
| _CPM_Rate | 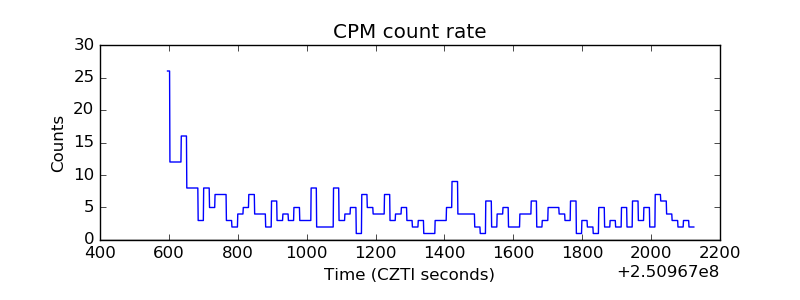 |
| CZT Counter | 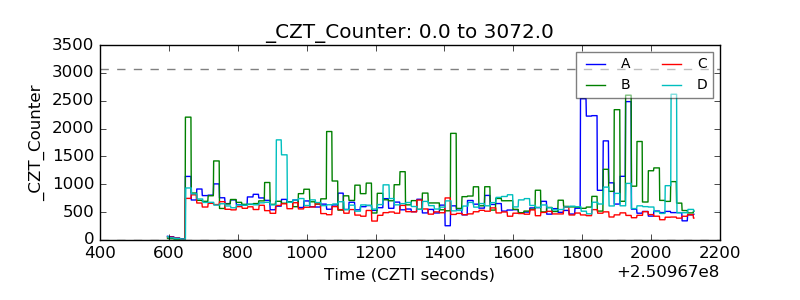 |
| +2.5 Volts monitor |  |
| +5 Volts monitor |  |
| _ROLL_ROT | 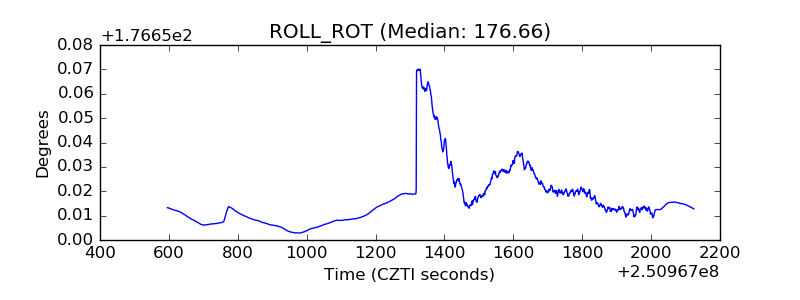 |
| _Roll_DEC | 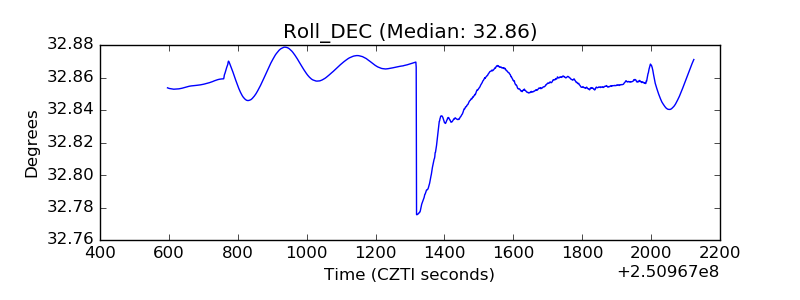 |
| _Roll_RA | 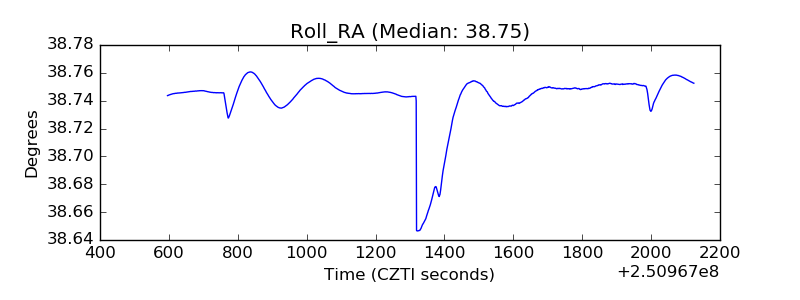 |
| Veto Counter | 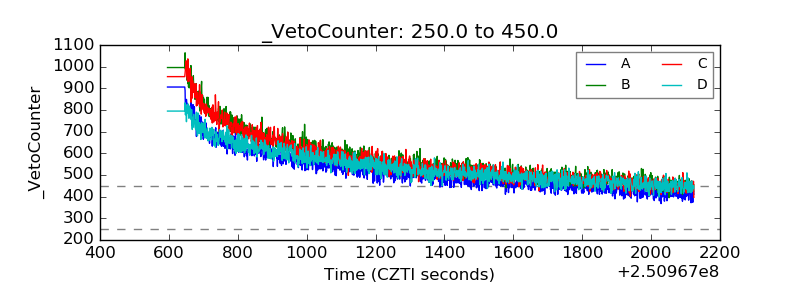 |