| Param | Original file | Final file |
|---|---|---|
| Filename | modeM0/AS1A04_082T01_9000001772cztM0_level2.fits | modeM0/AS1A04_082T01_9000001772cztM0_level2_quad_clean.evt |
| Size (bytes) | 1,128,110,400 | 1,214,864,640 |
| Size | 1.1 GB | 1.1 GB |
| Events in quadrant A | 6,800,800 | 7,554,520 |
| Events in quadrant B | 6,505,066 | 7,223,354 |
| Events in quadrant C | 6,735,876 | 7,138,557 |
| Events in quadrant D | 5,649,184 | 6,409,445 |
| Mode SS | |||
|---|---|---|---|
| Quadrant | BADHDUFLAG | Total packets | Discarded packets |
| A | 0 | 2516 | 0 |
| B | 0 | 2516 | 0 |
| C | 0 | 2516 | 0 |
| D | 0 | 2516 | 0 |
| Mode M0 | |||
|---|---|---|---|
| Quadrant | BADHDUFLAG | Total packets | Discarded packets |
| A | 0 | 269081 | 0 |
| B | 0 | 313705 | 0 |
| C | 0 | 254673 | 0 |
| D | 0 | 326825 | 0 |
| Mode M9 | |||
|---|---|---|---|
| Quadrant | BADHDUFLAG | Total packets | Discarded packets |
| A | 0 | 176 | 0 |
| B | 0 | 176 | 0 |
| C | 0 | 176 | 0 |
| D | 0 | 176 | 0 |
| Quadrant | Total seconds | Saturated seconds | Saturation percentage |
|---|---|---|---|
| A | 123586 | 2079 | 1.682229% |
| B | 123586 | 6745 | 5.457738% |
| C | 123586 | 1149 | 0.929717% |
| D | 123586 | 6790 | 5.494150% |
Noise dominated data is calculated using 1-second bins in cleaned event files. If a bin has >2000 counts, and if more than 50% of those come from <1% of pixels, then it is considered to be noise-dominated and hence unusable.
| Quadrant | # 1 sec bins | Bins with >0 counts | Bins with >2000 counts | High rate bins dominated by noise | Noise dominated (total time) | Noise dominated (detector-on time) | Marked lightcurve |
|---|---|---|---|---|---|---|---|
| A | 140621 | 123563 | 0 | 0 | 0.00% | 0.00% |  |
| B | 140621 | 123528 | 0 | 0 | 0.00% | 0.00% |  |
| C | 140621 | 123570 | 0 | 0 | 0.00% | 0.00% |  |
| D | 140621 | 123479 | 0 | 0 | 0.00% | 0.00% |  |
Top three noisy pixels from each quadrant. If the there are fewer than three noisy pixels in the level2.evt file, extra rows are filled as -1
| Pixel properties | Quadrant properties | ||||||
|---|---|---|---|---|---|---|---|
| Quadrant | DetID | PixID | Counts | Sigma | Mean | Median | Sigma |
| A | 0 | 29 | 6689 | 11.22 | 1772 | 1649 | 449.1 |
| A | 7 | 110 | 5715 | 9.05 | 1772 | 1649 | 449.1 |
| A | 0 | 30 | 5220 | 7.95 | 1772 | 1649 | 449.1 |
| B | 2 | 9 | 5760 | 12.18 | 1714 | 1634 | 338.8 |
| B | 2 | 8 | 4261 | 7.75 | 1714 | 1634 | 338.8 |
| B | 3 | 17 | 4248 | 7.72 | 1714 | 1634 | 338.8 |
| C | 12 | 241 | 4908 | 7.0 | 1780 | 1647 | 466.0 |
| C | 2 | 191 | 4540 | 6.21 | 1780 | 1647 | 466.0 |
| C | 3 | 126 | 4422 | 5.95 | 1780 | 1647 | 466.0 |
| D | 3 | 14 | 4282 | 6.62 | 1611 | 1463 | 425.5 |
| D | 6 | 231 | 4119 | 6.24 | 1611 | 1463 | 425.5 |
| D | 6 | 67 | 4019 | 6.01 | 1611 | 1463 | 425.5 |
Histogram calculated using DETX and DETY for each event in the final _common_clean file
| Quadrant A |  |
 |
Quadrant B |
|---|---|---|---|
| Quadrant D |  |
 |
Quadrant C |
| Plot type | Count rate plots | Images |
|---|---|---|
| Comparison with Poisson distribution Blue bars denote a histogram of data divided into 1 sec bins. Red curve is a Poisson curve with rate = median count rate of data. |
 |
 |
| Quadrant-wise count rates Data is divided into 100 sec bins |
 |
|
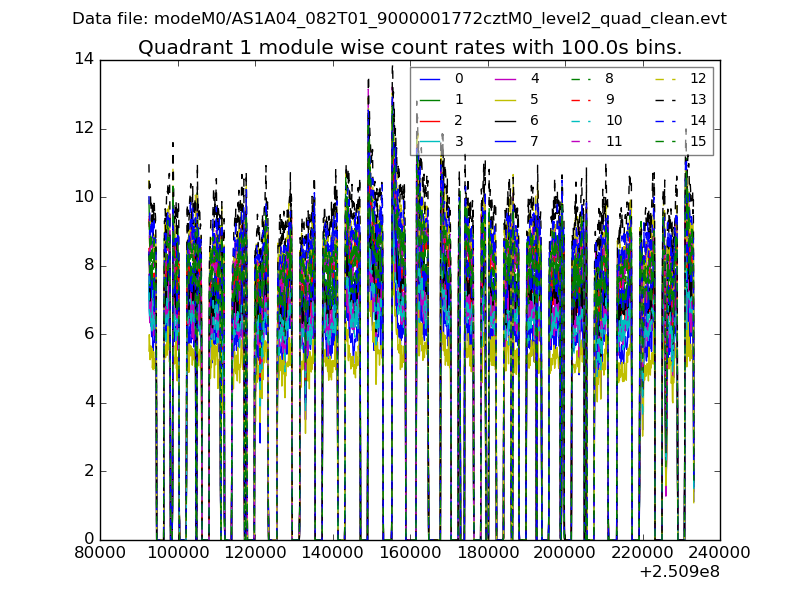
| Module-wise count rates for Quadrant A Data is divided into 100 sec bins |
 |
 |
| Module-wise count rates for Quadrant B Data is divided into 100 sec bins |
 |
 |
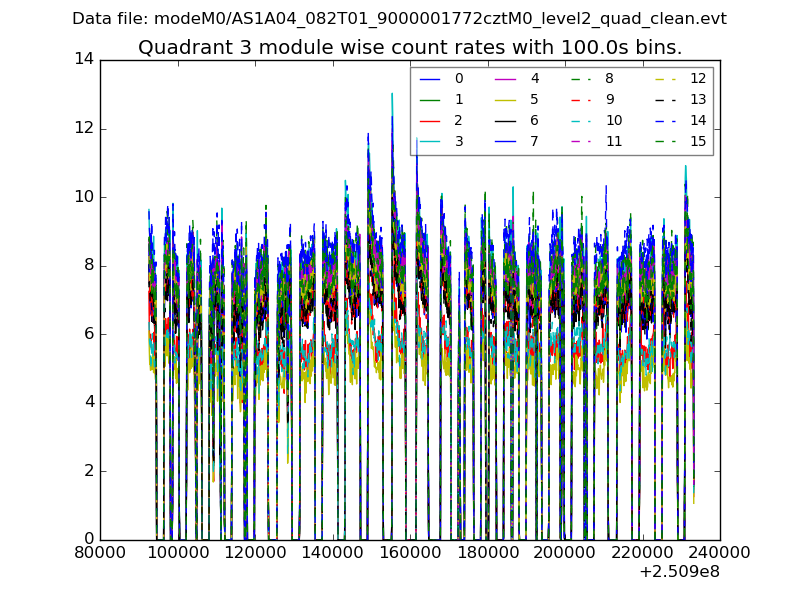
| Module-wise count rates for Quadrant C Data is divided into 100 sec bins |
 |
 |
| Module-wise count rates for Quadrant D Data is divided into 100 sec bins |
 |
 |
| Parameter | Plot |
|---|---|
| CZT HV Monitor |  |
| D_VDD | 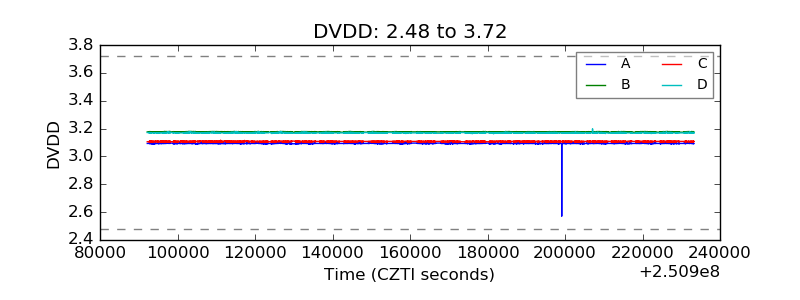 |
| Temperature 1 |  |
| Veto HV Monitor |  |
| Veto LLD |  |
| Alpha Counter |  |
| _CPM_Rate |  |
| CZT Counter |  |
| +2.5 Volts monitor |  |
| +5 Volts monitor | 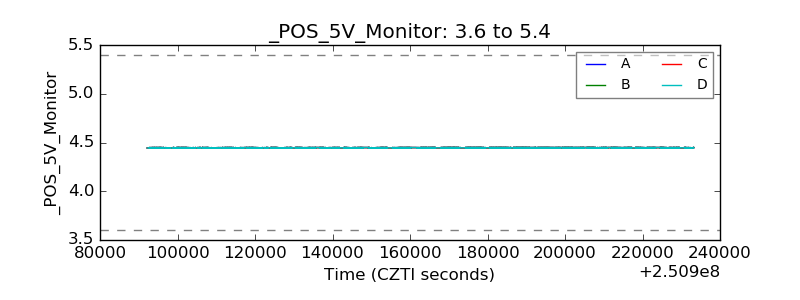 |
| _ROLL_ROT |  |
| _Roll_DEC |  |
| _Roll_RA | 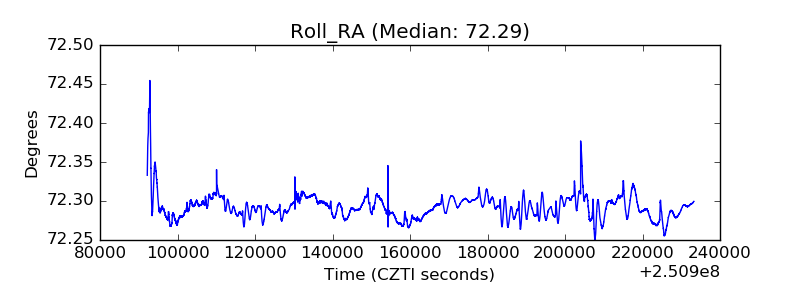 |
| Veto Counter |  |