| Param | Original file | Final file |
|---|---|---|
| Filename | modeM0/AS1A04_082T01_9000001772_11973cztM0_level2.evt | modeM0/AS1A04_082T01_9000001772_11973cztM0_level2_quad_clean.evt |
| Size (bytes) | 494,974,080 | 98,366,400 |
| Size | 472.0 MB | 93.8 MB |
| Events in quadrant A | 3,421,935 | 632,793 |
| Events in quadrant B | 4,047,680 | 633,622 |
| Events in quadrant C | 3,097,061 | 624,322 |
| Events in quadrant D | 3,943,909 | 596,227 |
| Mode SS | |||
|---|---|---|---|
| Quadrant | BADHDUFLAG | Total packets | Discarded packets |
| A | 0 | 142 | 0 |
| B | 0 | 142 | 0 |
| C | 0 | 142 | 0 |
| D | 0 | 142 | 0 |
| Mode M0 | |||
|---|---|---|---|
| Quadrant | BADHDUFLAG | Total packets | Discarded packets |
| A | 0 | 14965 | 3 |
| B | 0 | 16812 | 2 |
| C | 0 | 14341 | 2 |
| D | 0 | 16340 | 2 |
| Mode M9 | |||
|---|---|---|---|
| Quadrant | BADHDUFLAG | Total packets | Discarded packets |
| A | 0 | 12 | 0 |
| B | 0 | 12 | 0 |
| C | 0 | 12 | 0 |
| D | 0 | 12 | 0 |
| Quadrant | Total seconds | Saturated seconds | Saturation percentage |
|---|---|---|---|
| A | 7069 | 71 | 1.004385% |
| B | 7069 | 202 | 2.857547% |
| C | 7069 | 27 | 0.381949% |
| D | 7069 | 98 | 1.386335% |
Noise dominated data is calculated using 1-second bins in cleaned event files. If a bin has >2000 counts, and if more than 50% of those come from <1% of pixels, then it is considered to be noise-dominated and hence unusable.
| Quadrant | # 1 sec bins | Bins with >0 counts | Bins with >2000 counts | High rate bins dominated by noise | Noise dominated (total time) | Noise dominated (detector-on time) | Marked lightcurve |
|---|---|---|---|---|---|---|---|
| A | 7705 | 7071 | 14 | 14 | 0.18% | 0.20% | 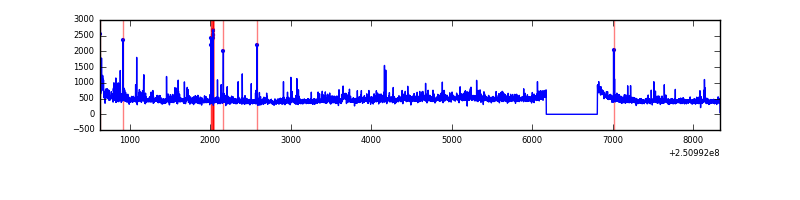 |
| B | 7705 | 7071 | 86 | 86 | 1.12% | 1.22% | 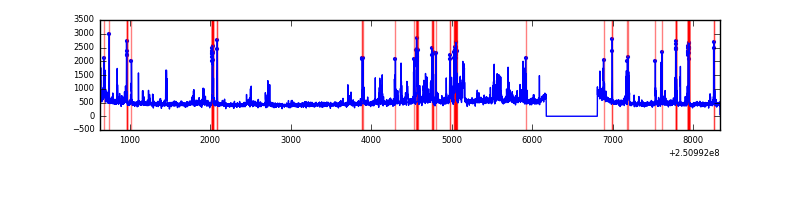 |
| C | 7705 | 7071 | 0 | 0 | 0.00% | 0.00% | 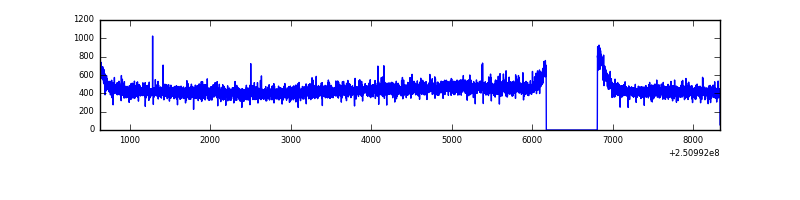 |
| D | 7705 | 7071 | 60 | 60 | 0.78% | 0.85% | 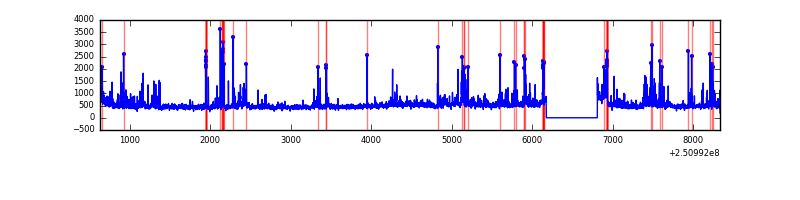 |
Top three noisy pixels from each quadrant. If the there are fewer than three noisy pixels in the level2.evt file, extra rows are filled as -1
| Pixel properties | Quadrant properties | ||||||
|---|---|---|---|---|---|---|---|
| Quadrant | DetID | PixID | Counts | Sigma | Mean | Median | Sigma |
| A | 1 | 162 | 99780 | 599.79 | 809 | 790 | 165.0 |
| A | 11 | 29 | 79164 | 474.88 | 809 | 790 | 165.0 |
| A | 1 | 178 | 47688 | 284.16 | 809 | 790 | 165.0 |
| B | 4 | 239 | 649143 | 4183.5 | 813 | 791 | 155.0 |
| B | 15 | 204 | 80832 | 516.46 | 813 | 791 | 155.0 |
| B | 11 | 51 | 48035 | 304.84 | 813 | 791 | 155.0 |
| C | 0 | 207 | 8482 | 42.03 | 792 | 794 | 182.9 |
| C | 13 | 61 | 5833 | 27.55 | 792 | 794 | 182.9 |
| C | 14 | 234 | 2229 | 7.85 | 792 | 794 | 182.9 |
| D | 8 | 195 | 272214 | 1321.51 | 771 | 755 | 205.4 |
| D | 4 | 95 | 198021 | 960.32 | 771 | 755 | 205.4 |
| D | 2 | 136 | 110004 | 531.84 | 771 | 755 | 205.4 |
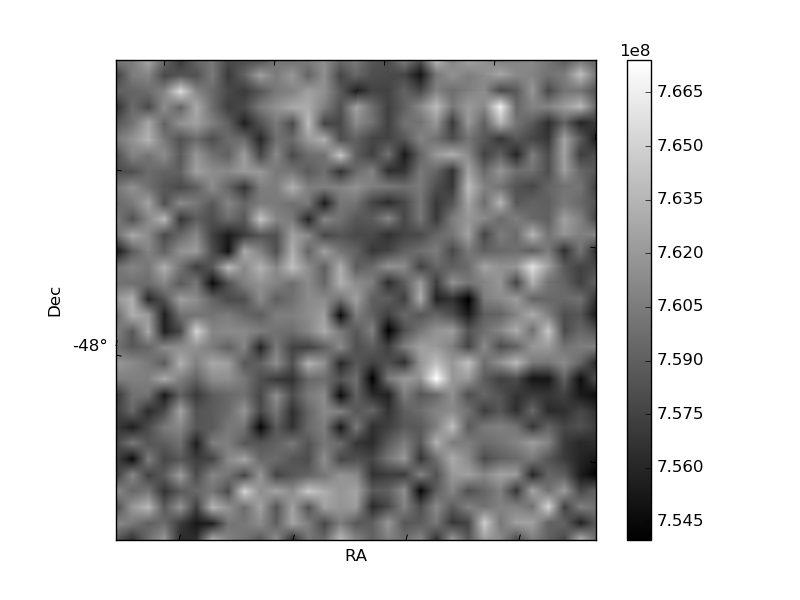
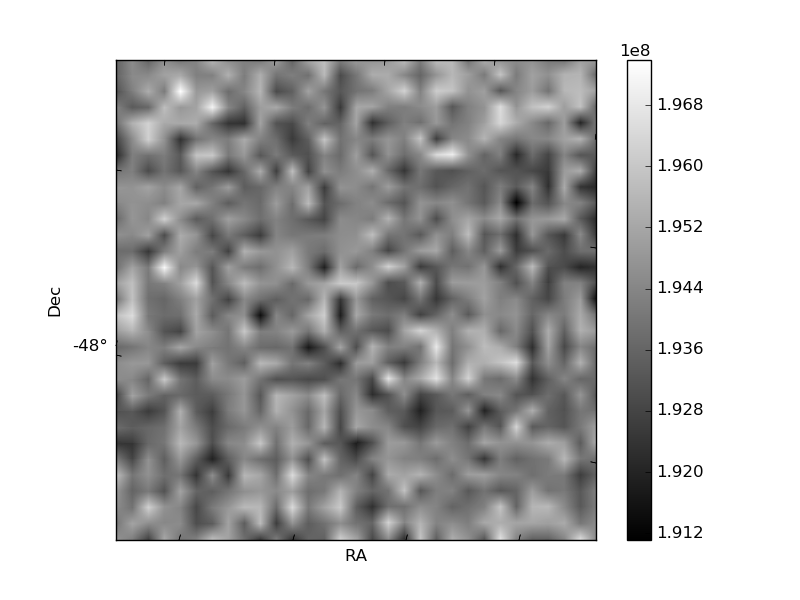
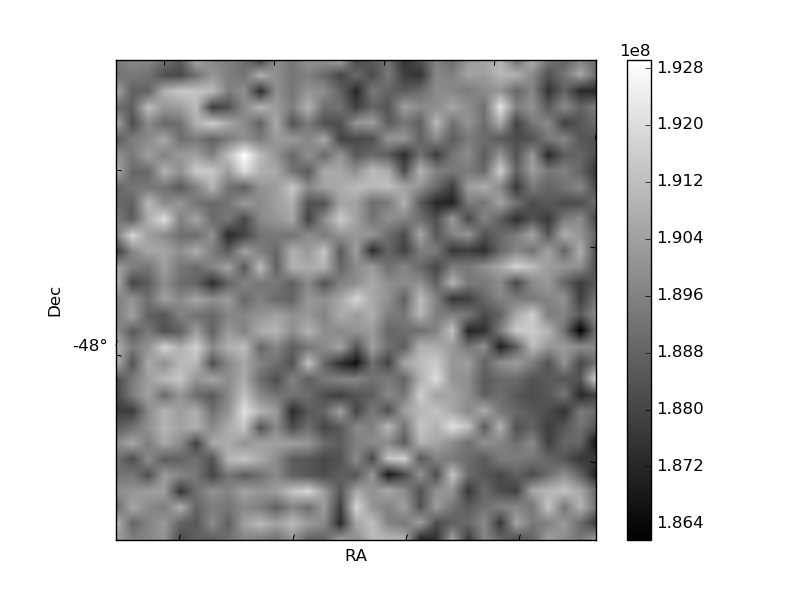
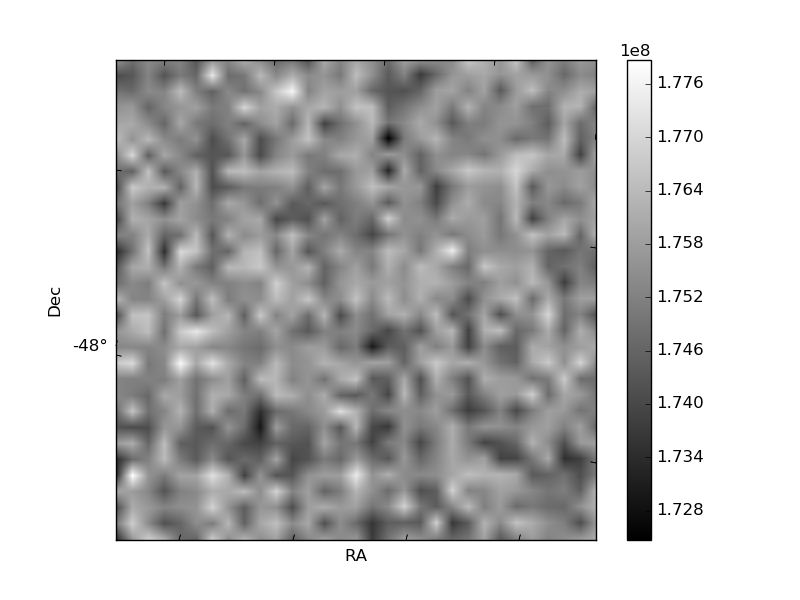
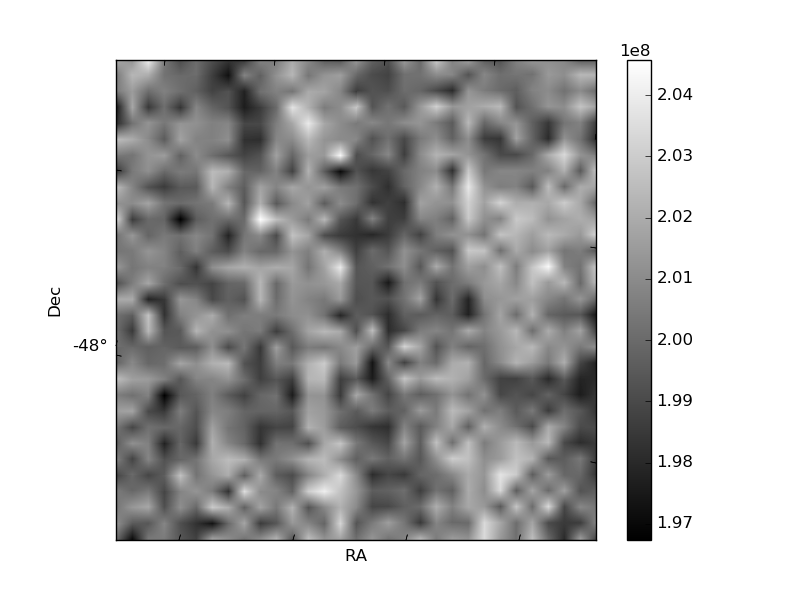
Histogram calculated using DETX and DETY for each event in the final _common_clean file
| Quadrant A | 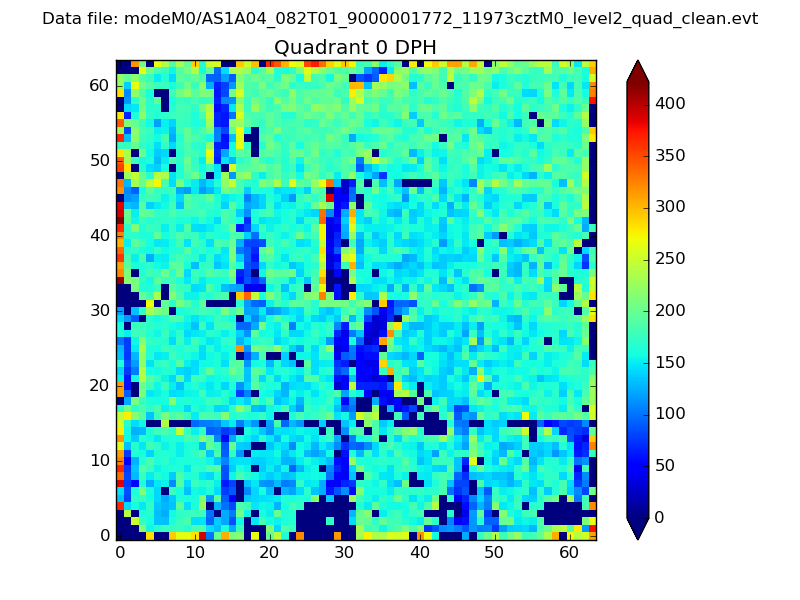 |
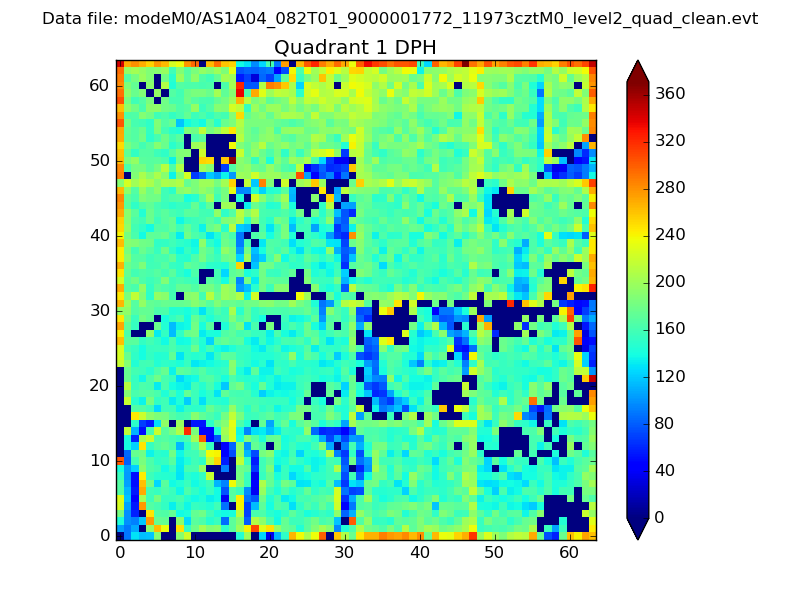 |
Quadrant B |
|---|---|---|---|
| Quadrant D | 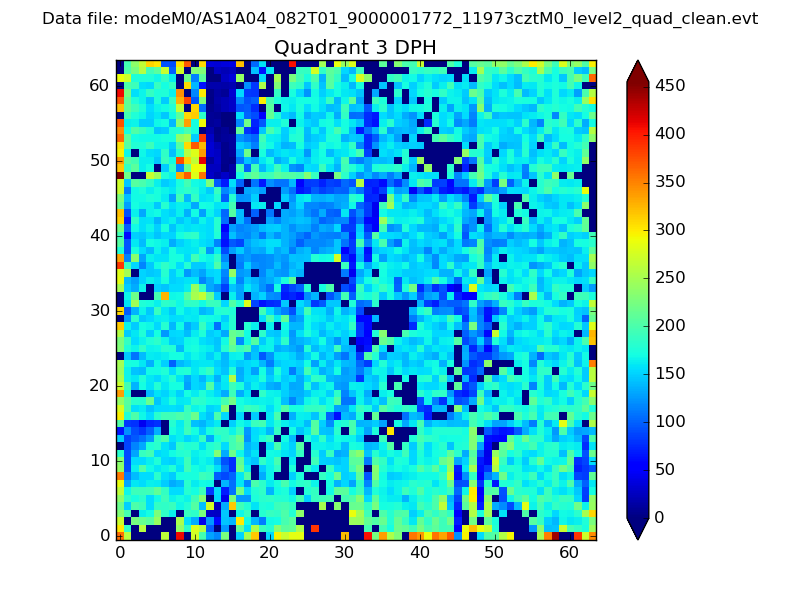 |
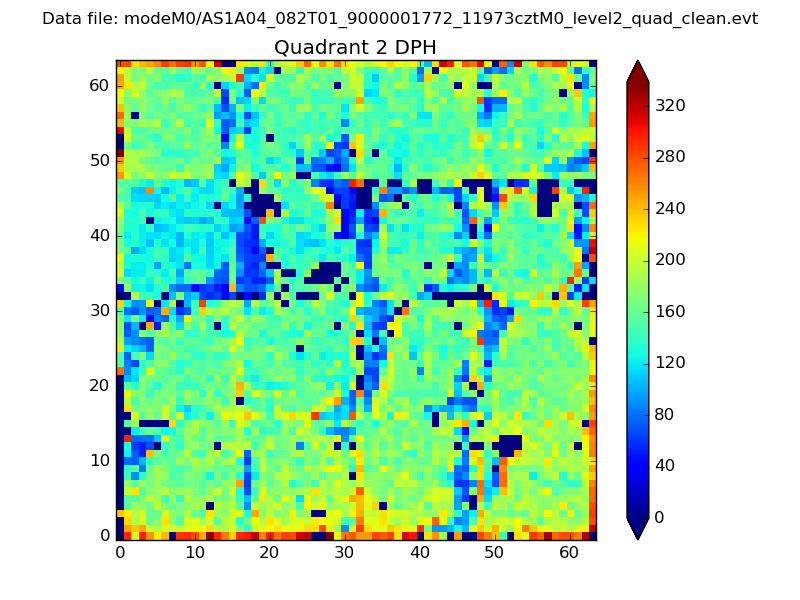 |
Quadrant C |
| Plot type | Count rate plots | Images |
|---|---|---|
| Comparison with Poisson distribution Blue bars denote a histogram of data divided into 1 sec bins. Red curve is a Poisson curve with rate = median count rate of data. |
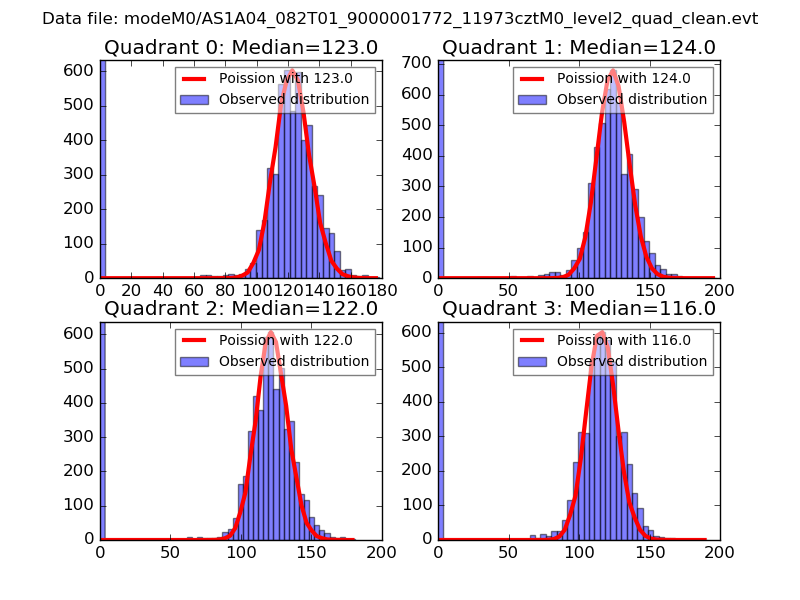 |
 |
| Quadrant-wise count rates Data is divided into 100 sec bins |
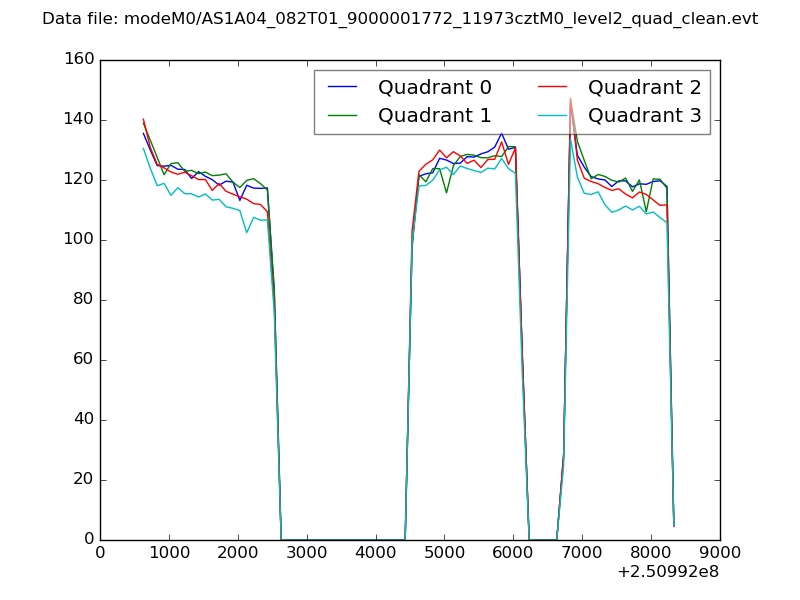 |
|
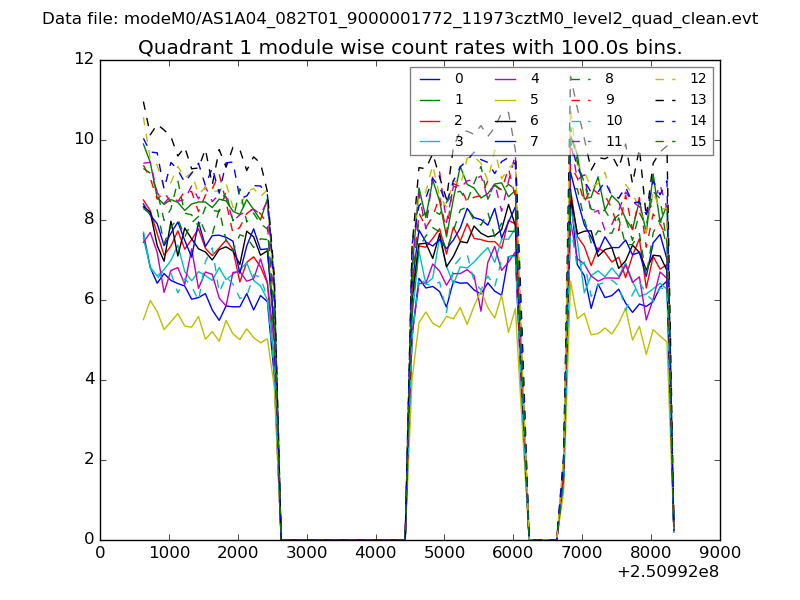
| Module-wise count rates for Quadrant A Data is divided into 100 sec bins |
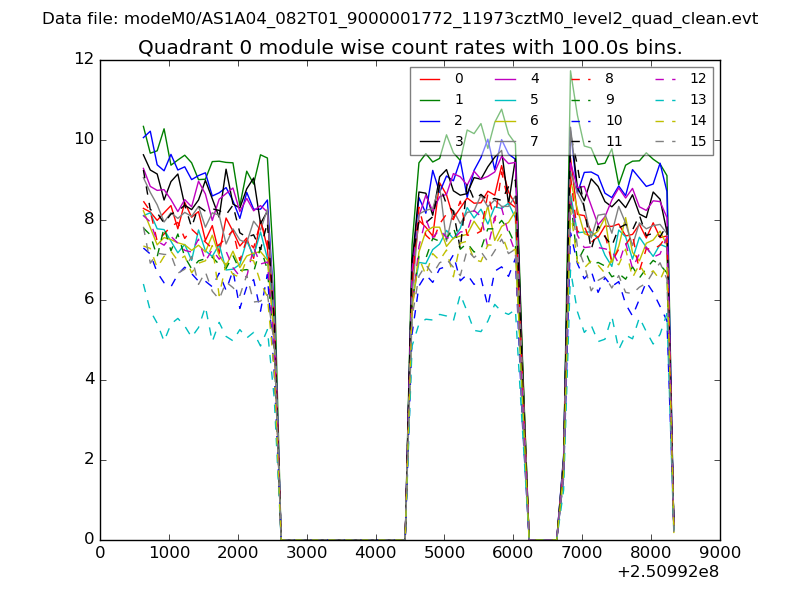 |
 |
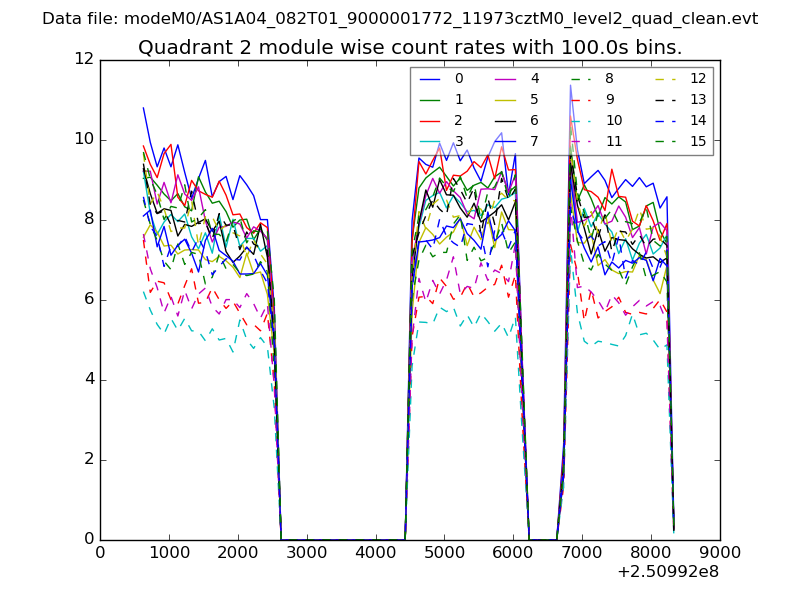
| Module-wise count rates for Quadrant B Data is divided into 100 sec bins |
 |
 |
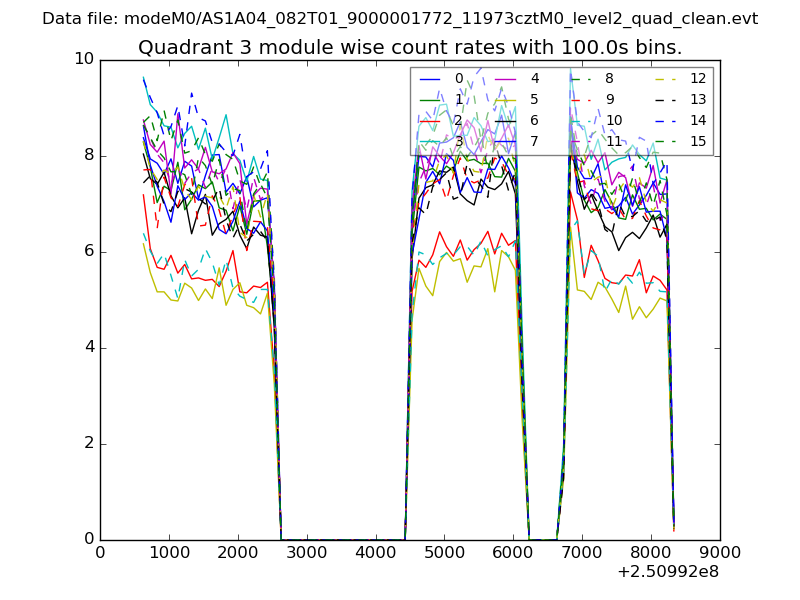
| Module-wise count rates for Quadrant C Data is divided into 100 sec bins |
 |
 |
| Module-wise count rates for Quadrant D Data is divided into 100 sec bins |
 |
 |
| Parameter | Plot |
|---|---|
| CZT HV Monitor | 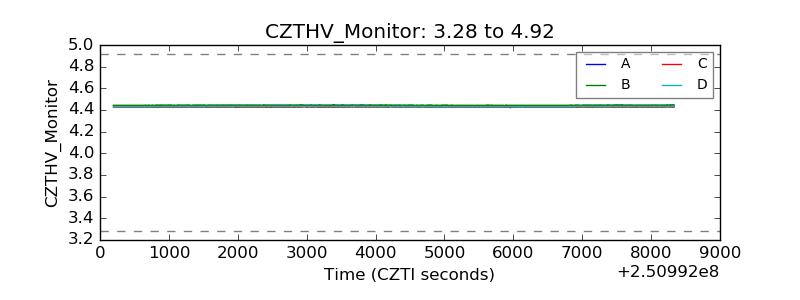 |
| D_VDD | 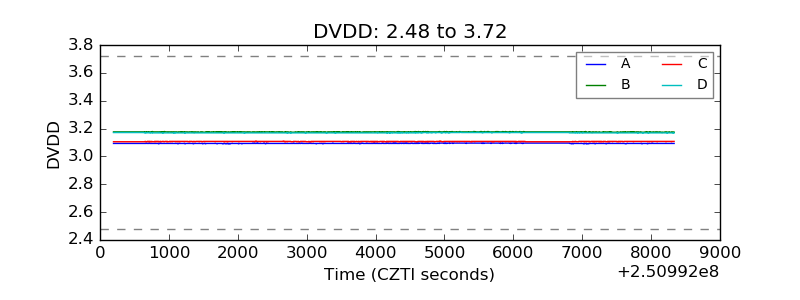 |
| Temperature 1 | 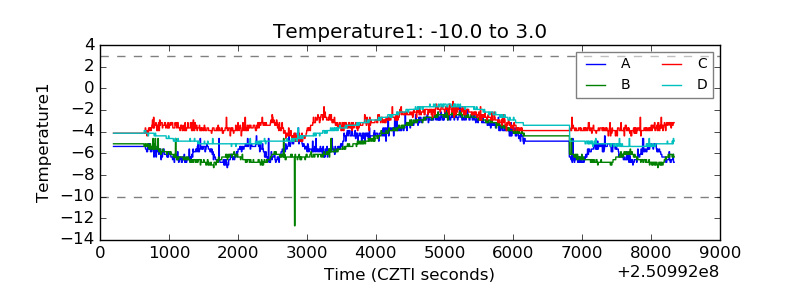 |
| Veto HV Monitor | 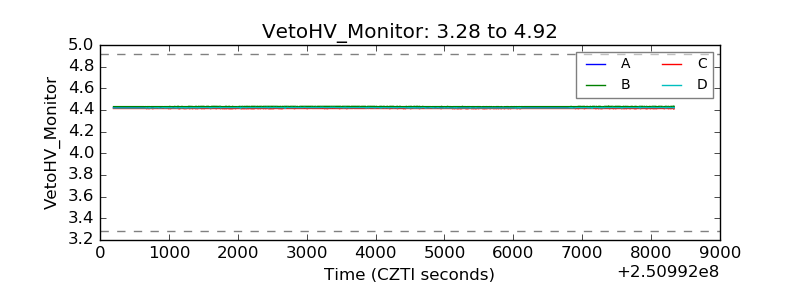 |
| Veto LLD | 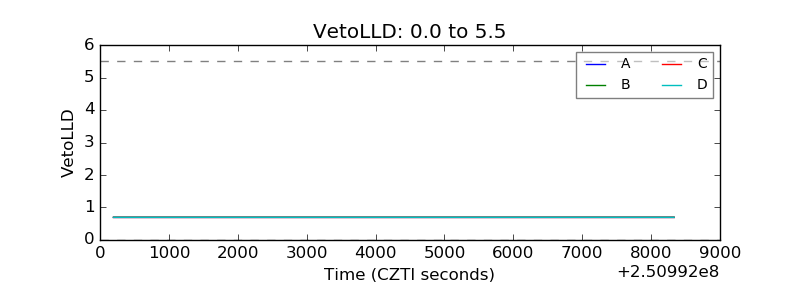 |
| Alpha Counter | 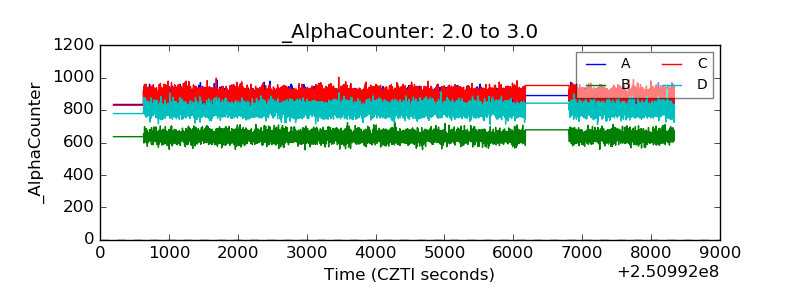 |
| _CPM_Rate | 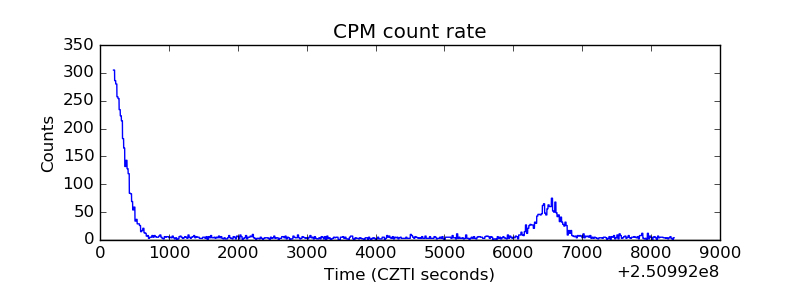 |
| CZT Counter | 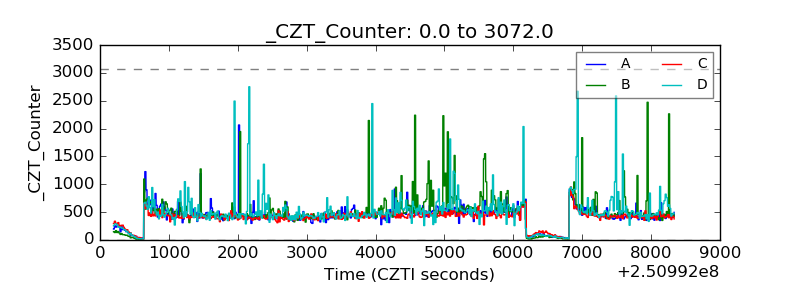 |
| +2.5 Volts monitor |  |
| +5 Volts monitor |  |
| _ROLL_ROT | 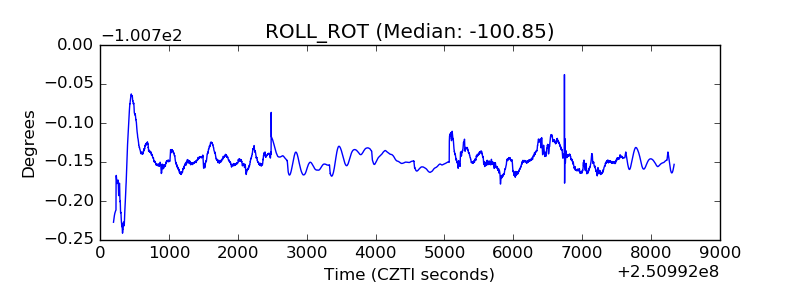 |
| _Roll_DEC | 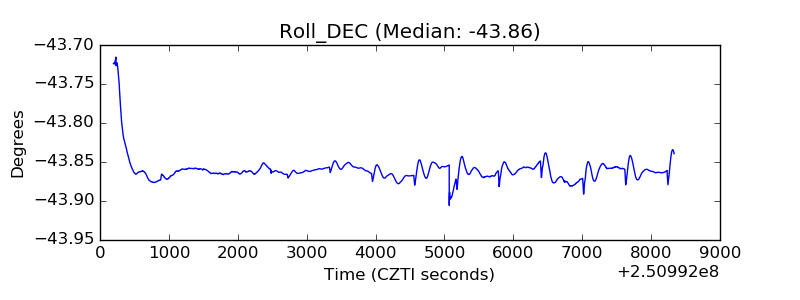 |
| _Roll_RA | 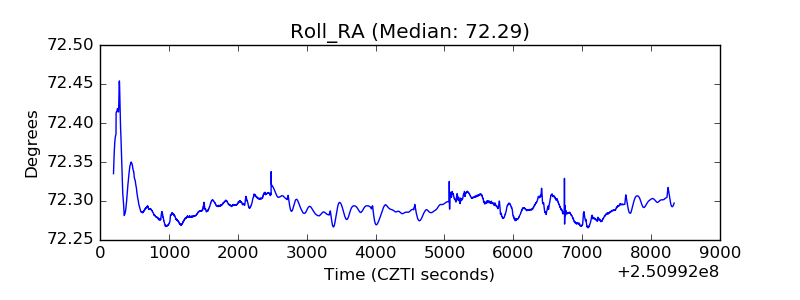 |
| Veto Counter | 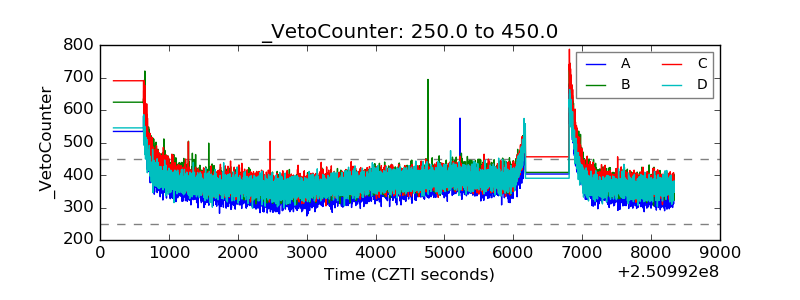 |