| Param | Original file | Final file |
|---|---|---|
| Filename | modeM0/AS1A04_082T01_9000001772_11974cztM0_level2.evt | modeM0/AS1A04_082T01_9000001772_11974cztM0_level2_quad_clean.evt |
| Size (bytes) | 634,003,200 | 115,182,720 |
| Size | 604.6 MB | 109.8 MB |
| Events in quadrant A | 3,970,054 | 748,383 |
| Events in quadrant B | 4,785,374 | 746,815 |
| Events in quadrant C | 3,690,081 | 735,975 |
| Events in quadrant D | 6,194,534 | 682,130 |
| Mode SS | |||
|---|---|---|---|
| Quadrant | BADHDUFLAG | Total packets | Discarded packets |
| A | 0 | 168 | 0 |
| B | 0 | 168 | 0 |
| C | 0 | 168 | 0 |
| D | 0 | 168 | 0 |
| Mode M0 | |||
|---|---|---|---|
| Quadrant | BADHDUFLAG | Total packets | Discarded packets |
| A | 0 | 17447 | 3 |
| B | 0 | 19780 | 2 |
| C | 0 | 16960 | 2 |
| D | 0 | 23895 | 2 |
| Mode M9 | |||
|---|---|---|---|
| Quadrant | BADHDUFLAG | Total packets | Discarded packets |
| A | 0 | 10 | 0 |
| B | 0 | 10 | 0 |
| C | 0 | 10 | 0 |
| D | 0 | 10 | 0 |
| Quadrant | Total seconds | Saturated seconds | Saturation percentage |
|---|---|---|---|
| A | 8276 | 115 | 1.389560% |
| B | 8276 | 285 | 3.443693% |
| C | 8276 | 80 | 0.966651% |
| D | 8276 | 502 | 6.065732% |
Noise dominated data is calculated using 1-second bins in cleaned event files. If a bin has >2000 counts, and if more than 50% of those come from <1% of pixels, then it is considered to be noise-dominated and hence unusable.
| Quadrant | # 1 sec bins | Bins with >0 counts | Bins with >2000 counts | High rate bins dominated by noise | Noise dominated (total time) | Noise dominated (detector-on time) | Marked lightcurve |
|---|---|---|---|---|---|---|---|
| A | 9227 | 8278 | 6 | 6 | 0.07% | 0.07% | 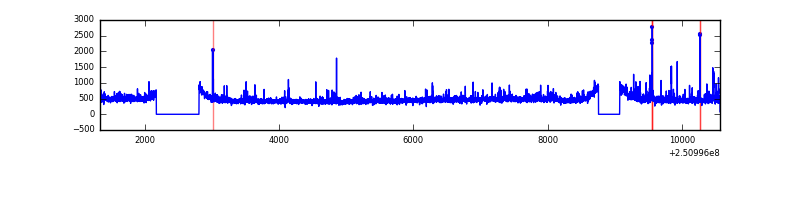 |
| B | 9227 | 8278 | 88 | 88 | 0.95% | 1.06% | 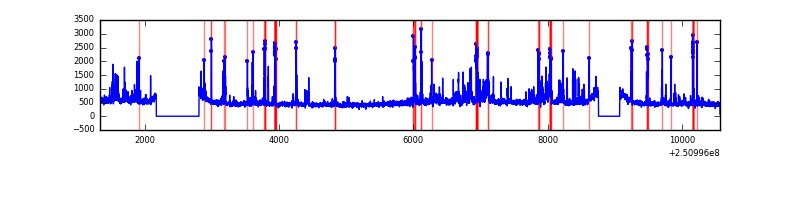 |
| C | 9227 | 8278 | 0 | 0 | 0.00% | 0.00% | 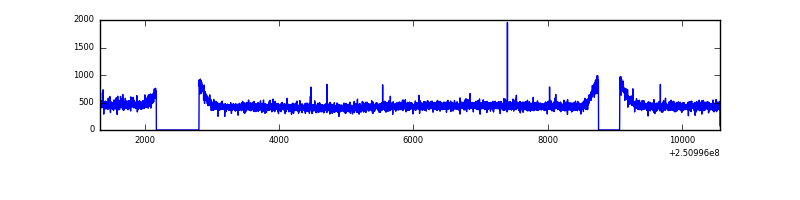 |
| D | 9227 | 8278 | 360 | 360 | 3.90% | 4.35% | 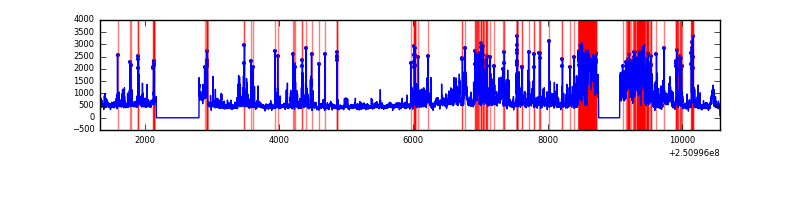 |
Top three noisy pixels from each quadrant. If the there are fewer than three noisy pixels in the level2.evt file, extra rows are filled as -1
| Pixel properties | Quadrant properties | ||||||
|---|---|---|---|---|---|---|---|
| Quadrant | DetID | PixID | Counts | Sigma | Mean | Median | Sigma |
| A | 1 | 162 | 90413 | 452.05 | 968 | 946 | 197.9 |
| A | 1 | 178 | 42634 | 210.64 | 968 | 946 | 197.9 |
| A | 11 | 29 | 38857 | 191.55 | 968 | 946 | 197.9 |
| B | 4 | 239 | 722216 | 3871.1 | 969 | 943 | 186.3 |
| B | 15 | 204 | 99125 | 526.95 | 969 | 943 | 186.3 |
| B | 11 | 51 | 51587 | 271.81 | 969 | 943 | 186.3 |
| C | 0 | 207 | 9129 | 37.42 | 943 | 945 | 218.7 |
| C | 13 | 61 | 7057 | 27.95 | 943 | 945 | 218.7 |
| C | 14 | 234 | 3947 | 13.73 | 943 | 945 | 218.7 |
| D | 2 | 136 | 819318 | 3707.44 | 910 | 881 | 220.8 |
| D | 1 | 52 | 781838 | 3537.66 | 910 | 881 | 220.8 |
| D | 4 | 95 | 455036 | 2057.28 | 910 | 881 | 220.8 |
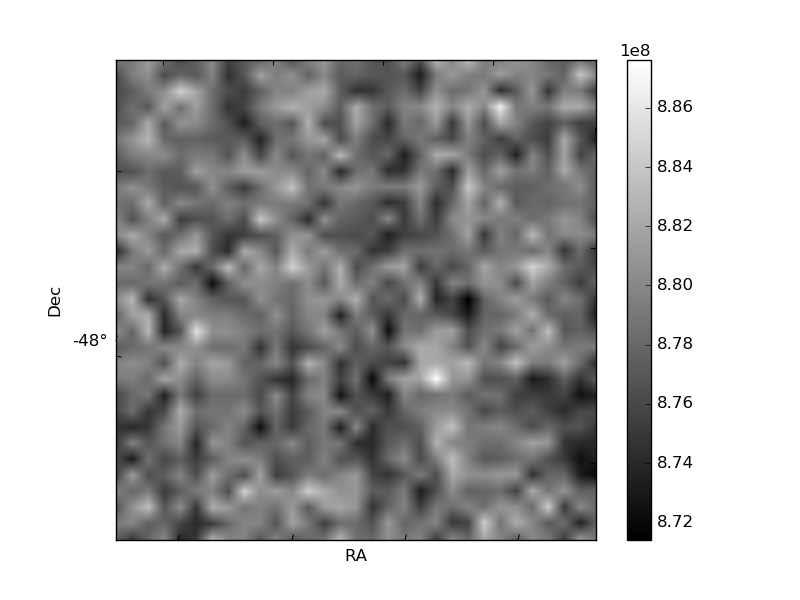
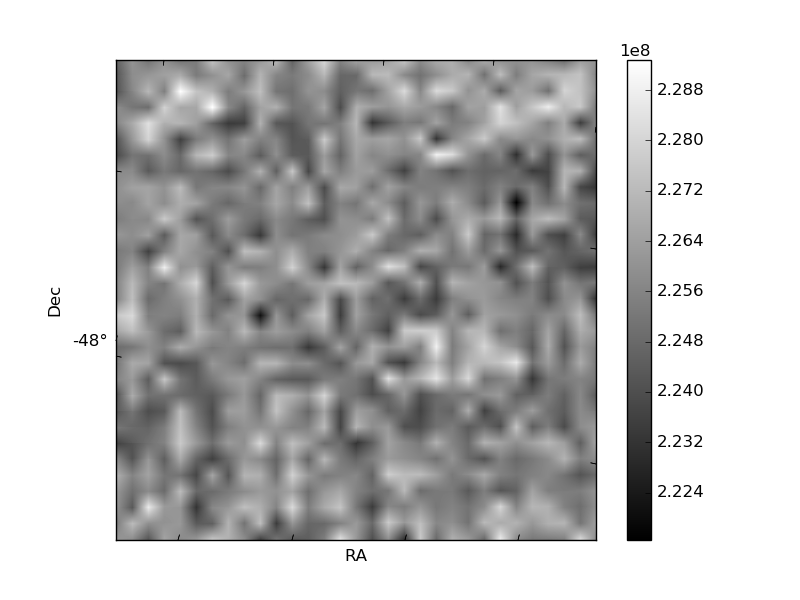
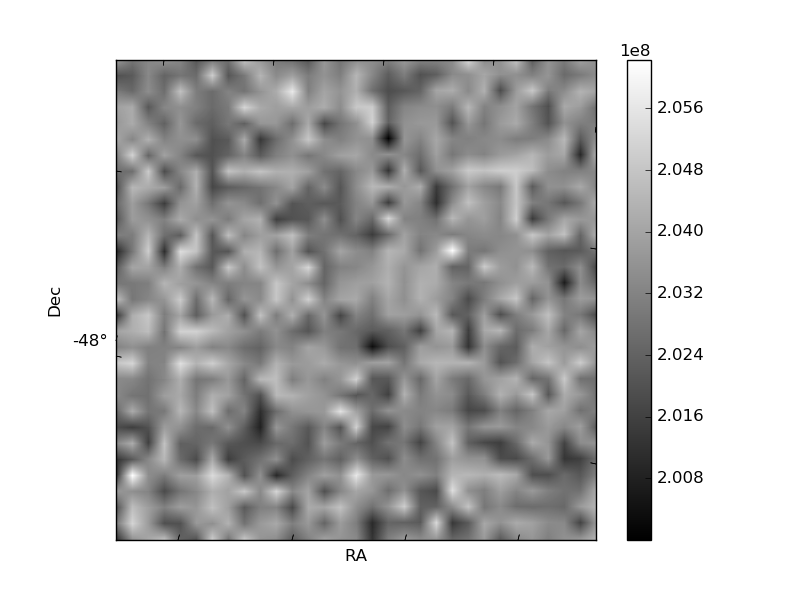
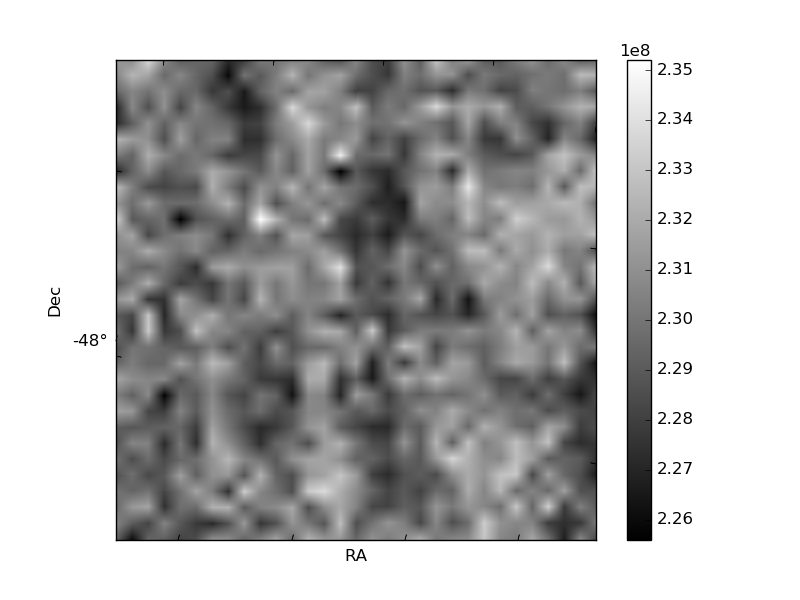
Histogram calculated using DETX and DETY for each event in the final _common_clean file
| Quadrant A | 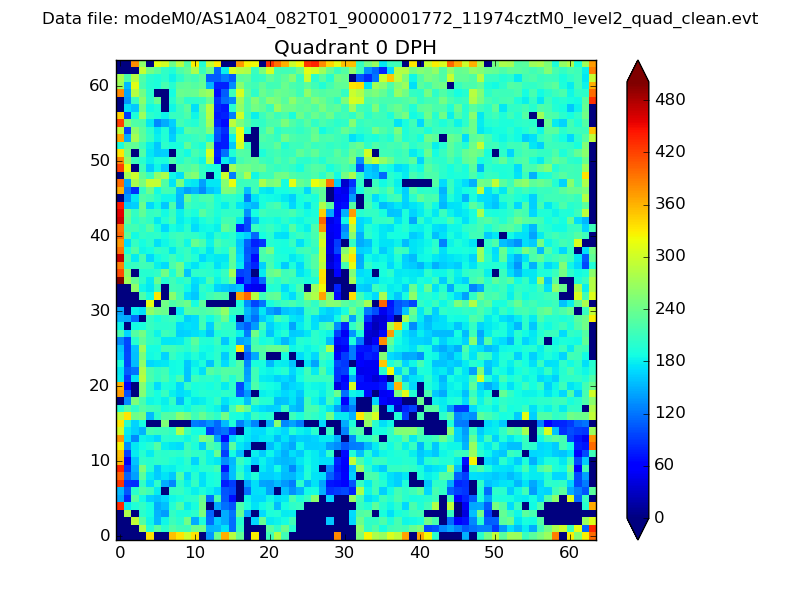 |
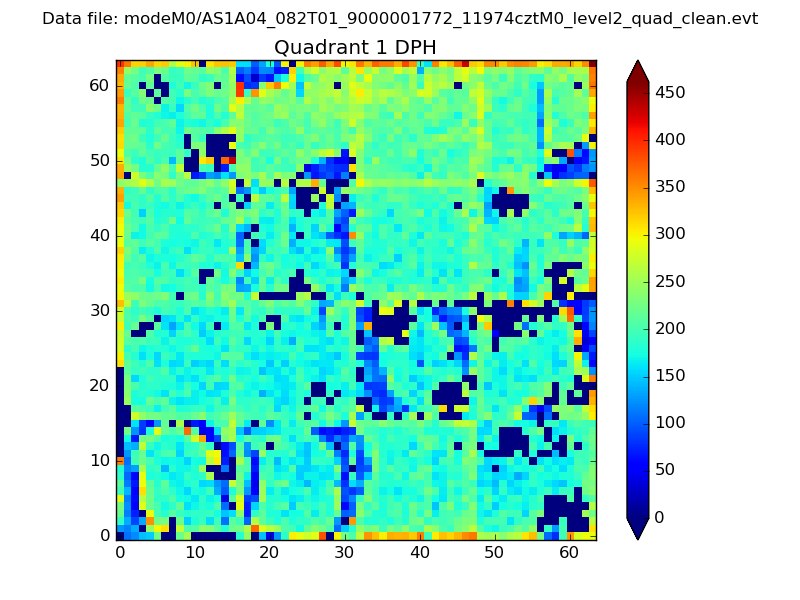 |
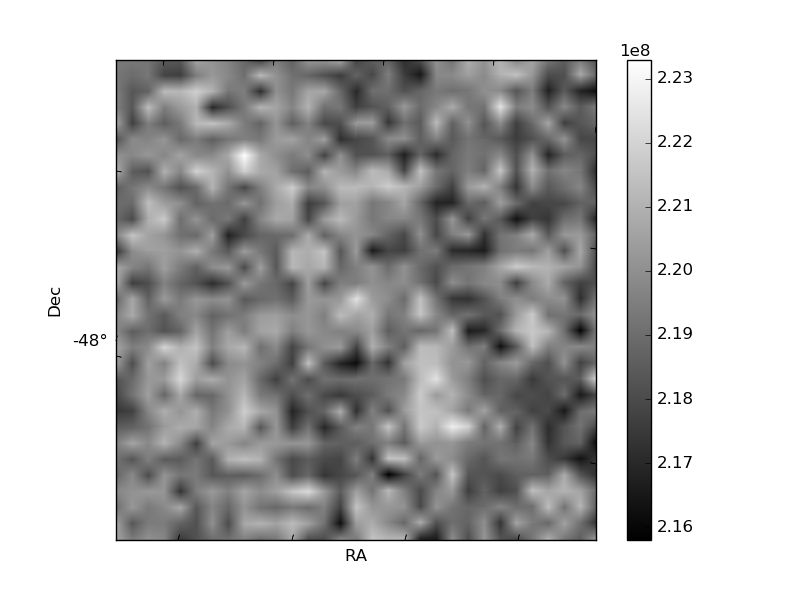
Quadrant B |
|---|---|---|---|
| Quadrant D | 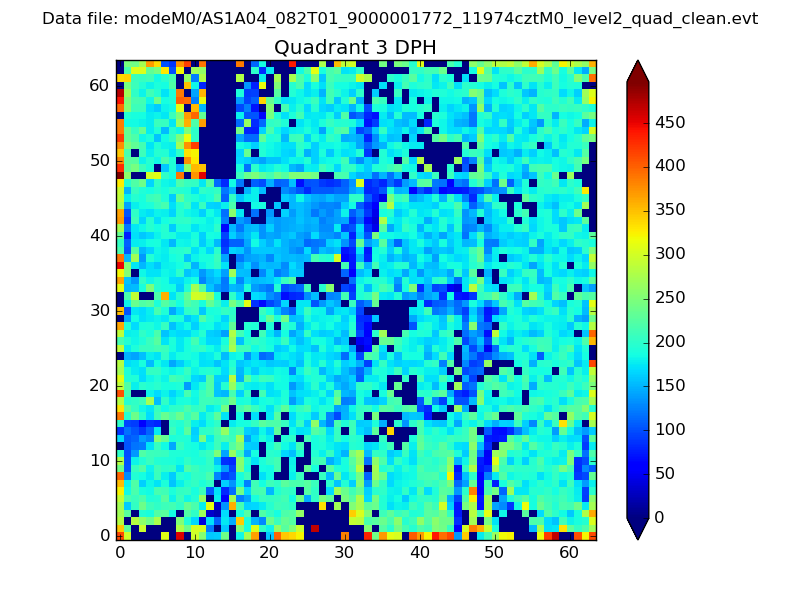 |
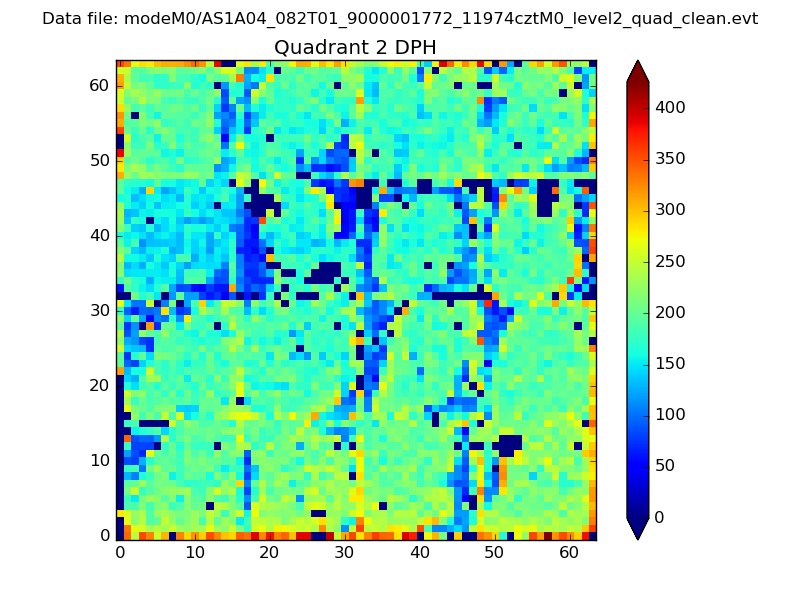 |
Quadrant C |
| Plot type | Count rate plots | Images |
|---|---|---|
| Comparison with Poisson distribution Blue bars denote a histogram of data divided into 1 sec bins. Red curve is a Poisson curve with rate = median count rate of data. |
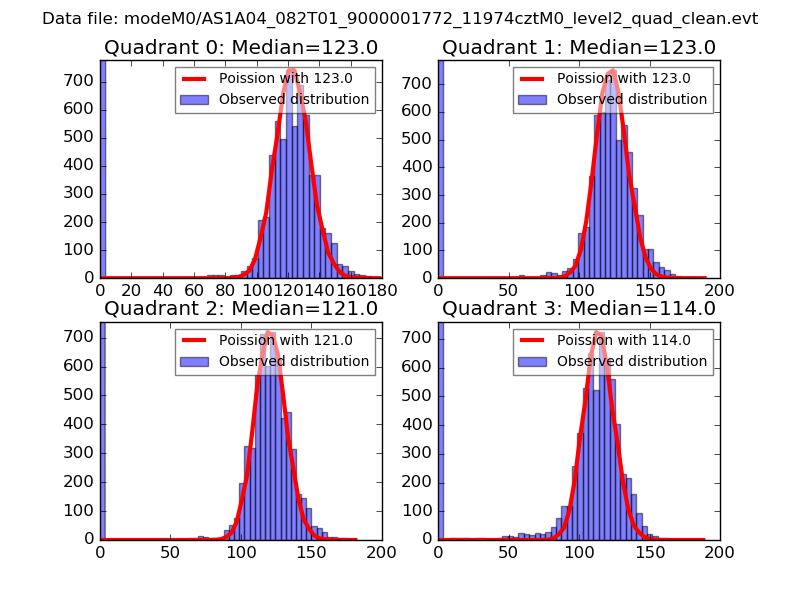 |
 |
| Quadrant-wise count rates Data is divided into 100 sec bins |
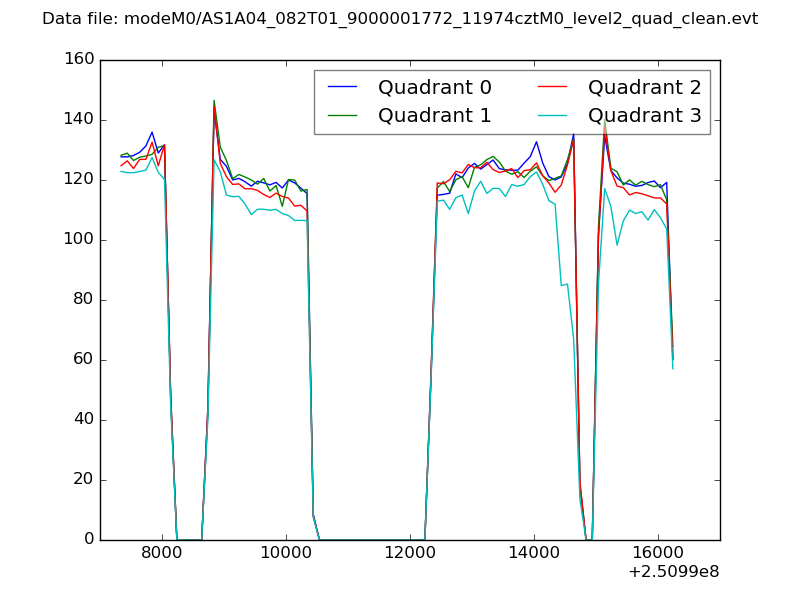 |
|
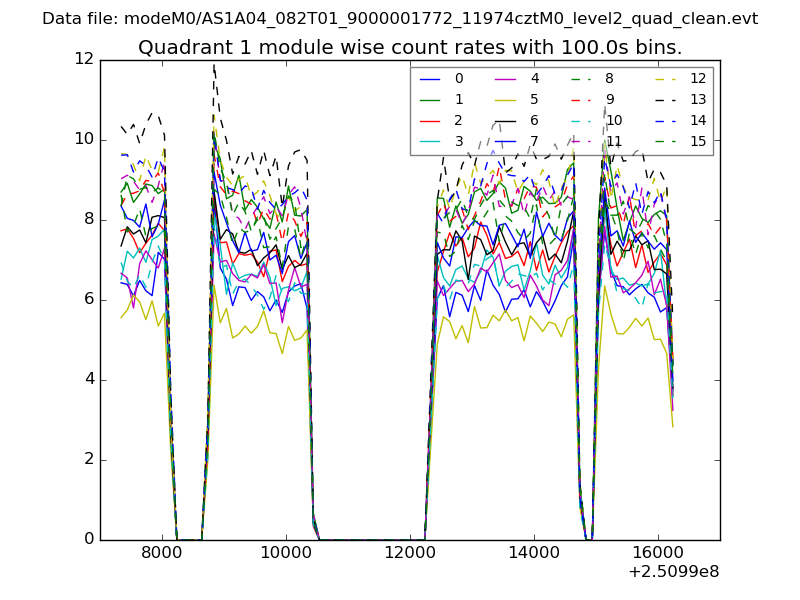
| Module-wise count rates for Quadrant A Data is divided into 100 sec bins |
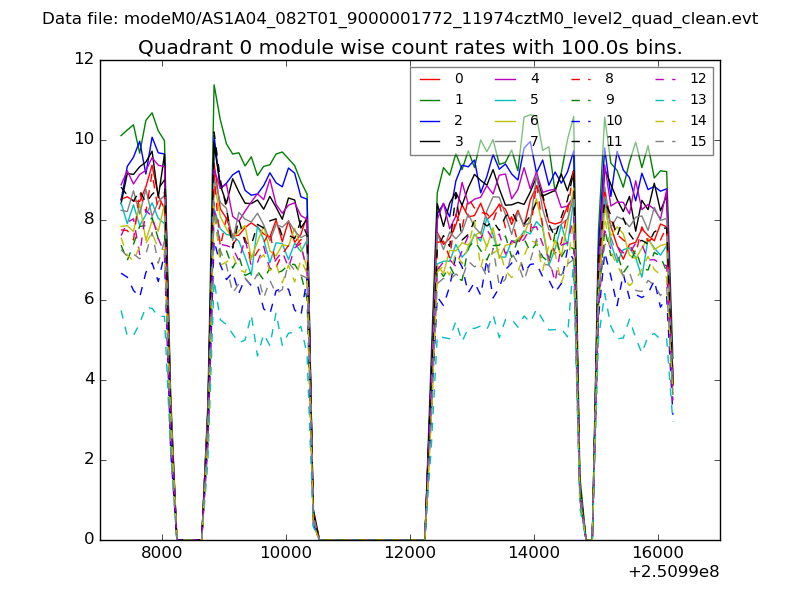 |
 |
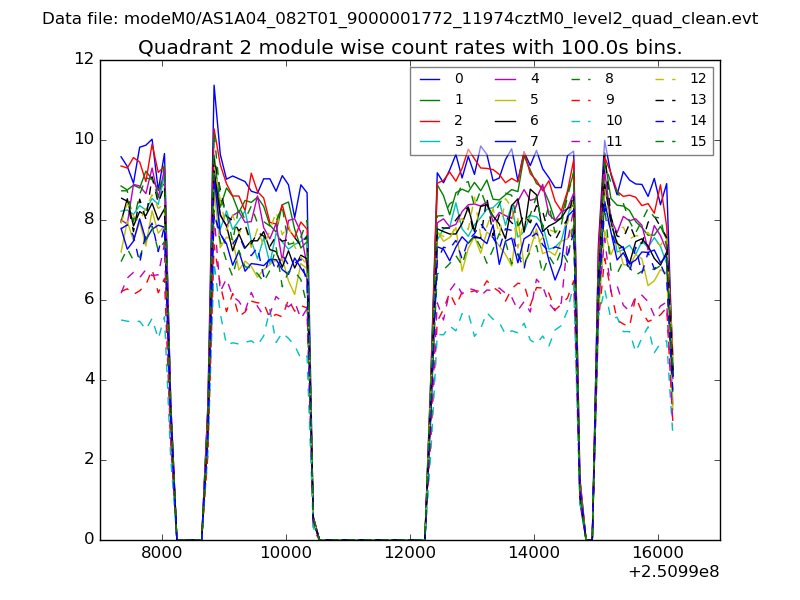
| Module-wise count rates for Quadrant B Data is divided into 100 sec bins |
 |
 |
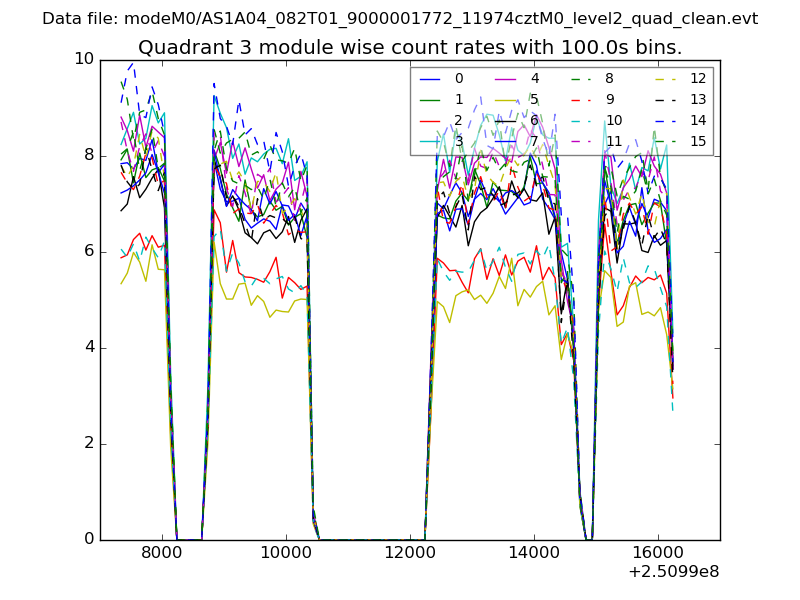
| Module-wise count rates for Quadrant C Data is divided into 100 sec bins |
 |
 |
| Module-wise count rates for Quadrant D Data is divided into 100 sec bins |
 |
 |
| Parameter | Plot |
|---|---|
| CZT HV Monitor | 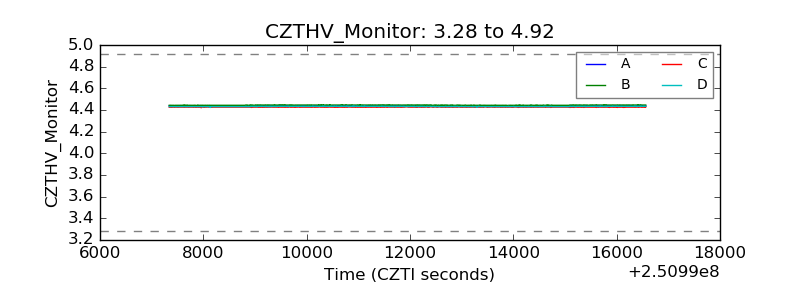 |
| D_VDD | 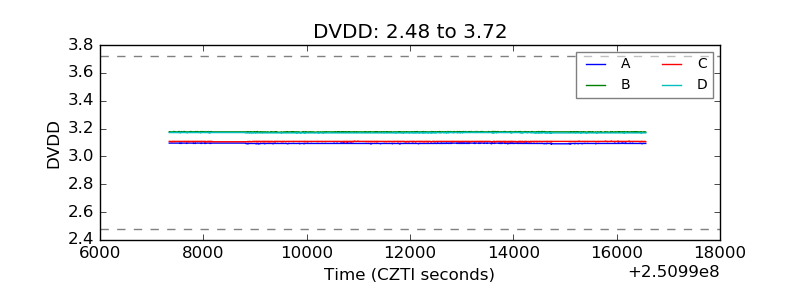 |
| Temperature 1 | 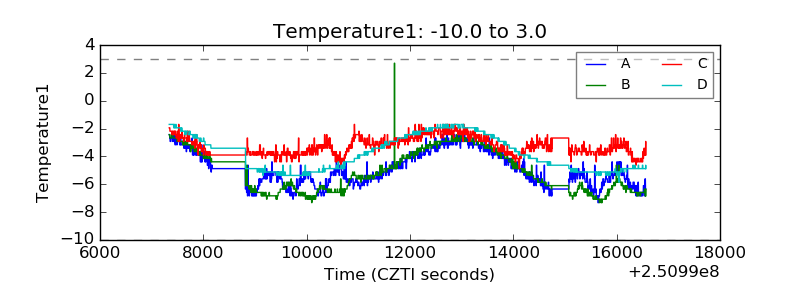 |
| Veto HV Monitor | 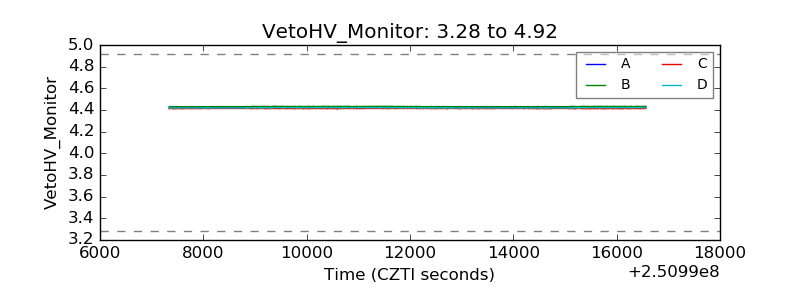 |
| Veto LLD |  |
| Alpha Counter | 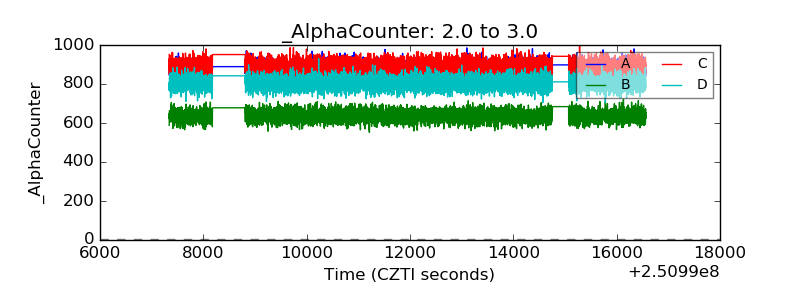 |
| _CPM_Rate | 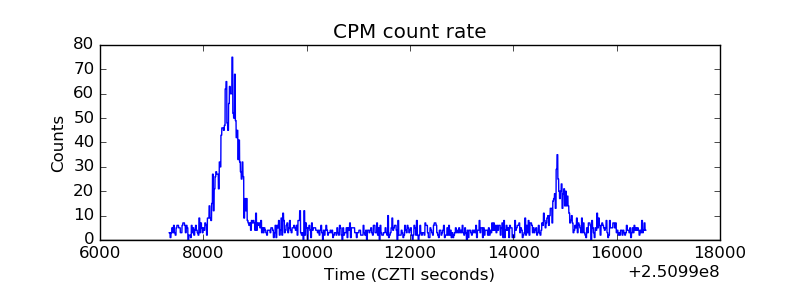 |
| CZT Counter | 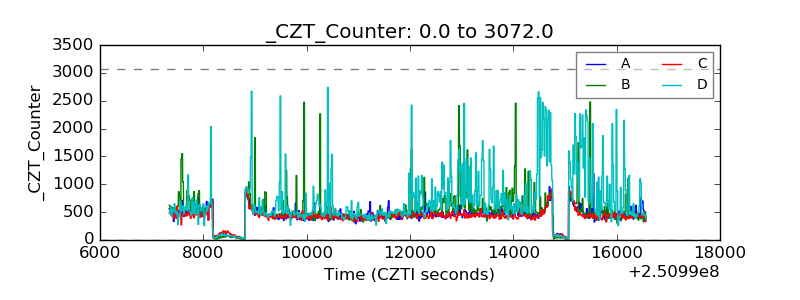 |
| +2.5 Volts monitor |  |
| +5 Volts monitor | 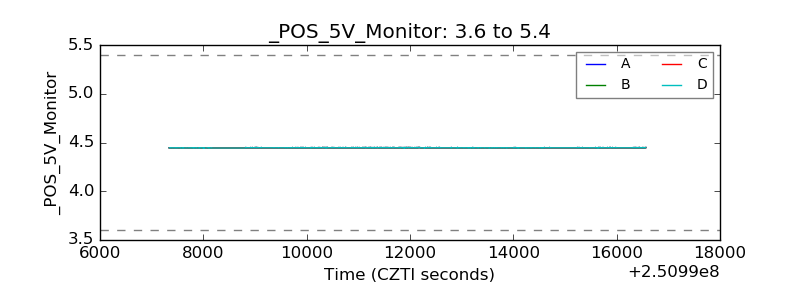 |
| _ROLL_ROT | 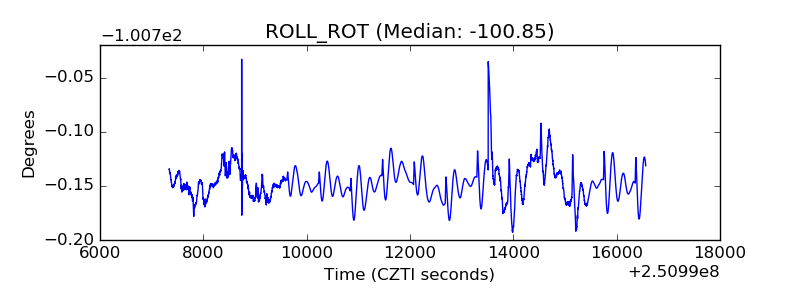 |
| _Roll_DEC | 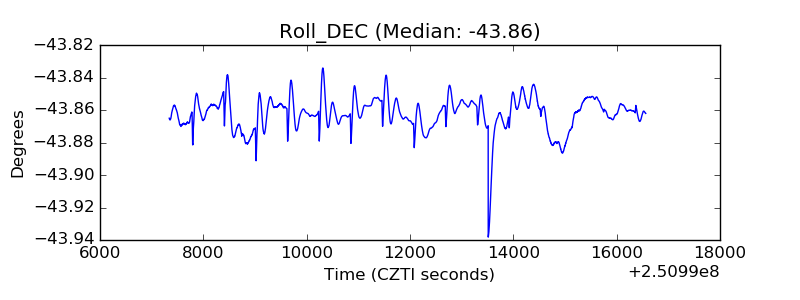 |
| _Roll_RA | 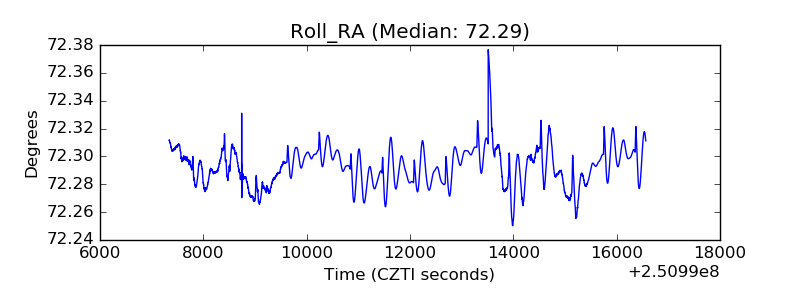 |
| Veto Counter |  |