| Param | Original file | Final file |
|---|---|---|
| Filename | modeM0/AS1A04_082T01_9000001772_11975cztM0_level2.evt | modeM0/AS1A04_082T01_9000001772_11975cztM0_level2_quad_clean.evt |
| Size (bytes) | 744,477,120 | 103,749,120 |
| Size | 710.0 MB | 98.9 MB |
| Events in quadrant A | 4,238,819 | 671,648 |
| Events in quadrant B | 5,690,168 | 654,527 |
| Events in quadrant C | 3,764,720 | 662,998 |
| Events in quadrant D | 8,289,250 | 573,423 |
| Mode SS | |||
|---|---|---|---|
| Quadrant | BADHDUFLAG | Total packets | Discarded packets |
| A | 0 | 172 | 0 |
| B | 0 | 172 | 0 |
| C | 0 | 172 | 0 |
| D | 0 | 172 | 0 |
| Mode M0 | |||
|---|---|---|---|
| Quadrant | BADHDUFLAG | Total packets | Discarded packets |
| A | 0 | 18295 | 4 |
| B | 0 | 22515 | 3 |
| C | 0 | 17267 | 3 |
| D | 0 | 30265 | 3 |
| Mode M9 | |||
|---|---|---|---|
| Quadrant | BADHDUFLAG | Total packets | Discarded packets |
| A | 0 | 5 | 0 |
| B | 0 | 5 | 0 |
| C | 0 | 5 | 0 |
| D | 0 | 5 | 0 |
| Quadrant | Total seconds | Saturated seconds | Saturation percentage |
|---|---|---|---|
| A | 8322 | 247 | 2.968037% |
| B | 8322 | 693 | 8.327325% |
| C | 8322 | 172 | 2.066811% |
| D | 8322 | 1340 | 16.101899% |
Noise dominated data is calculated using 1-second bins in cleaned event files. If a bin has >2000 counts, and if more than 50% of those come from <1% of pixels, then it is considered to be noise-dominated and hence unusable.
| Quadrant | # 1 sec bins | Bins with >0 counts | Bins with >2000 counts | High rate bins dominated by noise | Noise dominated (total time) | Noise dominated (detector-on time) | Marked lightcurve |
|---|---|---|---|---|---|---|---|
| A | 8868 | 8323 | 15 | 15 | 0.17% | 0.18% | 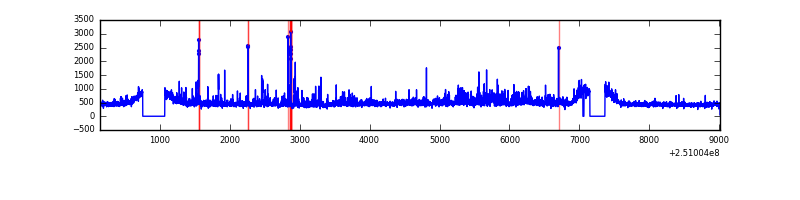 |
| B | 8868 | 8323 | 281 | 281 | 3.17% | 3.38% | 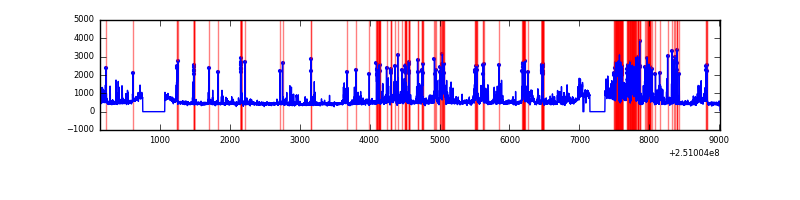 |
| C | 8868 | 8324 | 0 | 0 | 0.00% | 0.00% | 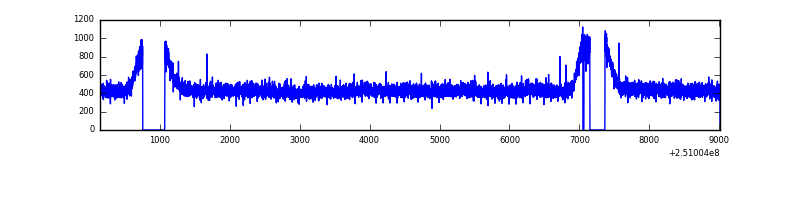 |
| D | 8868 | 8323 | 1141 | 1141 | 12.87% | 13.71% | 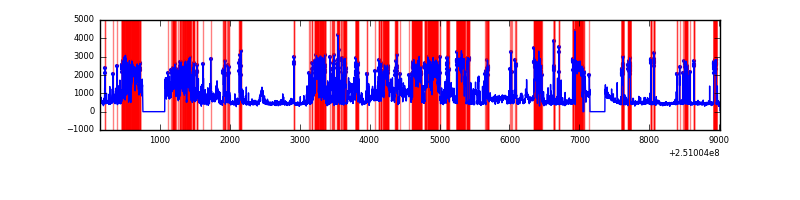 |
Top three noisy pixels from each quadrant. If the there are fewer than three noisy pixels in the level2.evt file, extra rows are filled as -1
| Pixel properties | Quadrant properties | ||||||
|---|---|---|---|---|---|---|---|
| Quadrant | DetID | PixID | Counts | Sigma | Mean | Median | Sigma |
| A | 1 | 162 | 152403 | 754.83 | 982 | 960 | 200.6 |
| A | 11 | 29 | 82819 | 408.01 | 982 | 960 | 200.6 |
| A | 1 | 178 | 77339 | 380.69 | 982 | 960 | 200.6 |
| B | 4 | 239 | 1006054 | 5323.92 | 969 | 940 | 188.8 |
| B | 0 | 85 | 663104 | 3507.37 | 969 | 940 | 188.8 |
| B | 15 | 204 | 82387 | 431.41 | 969 | 940 | 188.8 |
| C | 13 | 61 | 7116 | 27.34 | 964 | 968 | 224.9 |
| C | 5 | 96 | 3327 | 10.49 | 964 | 968 | 224.9 |
| C | 8 | 222 | 2671 | 7.57 | 964 | 968 | 224.9 |
| D | 1 | 52 | 3744507 | 17164.35 | 880 | 855 | 218.1 |
| D | 2 | 136 | 615330 | 2817.32 | 880 | 855 | 218.1 |
| D | 8 | 195 | 316198 | 1445.82 | 880 | 855 | 218.1 |
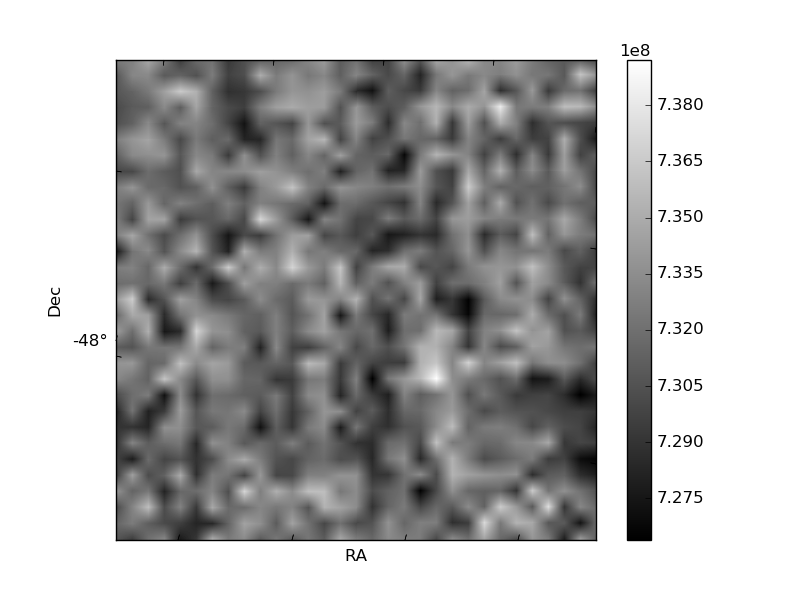
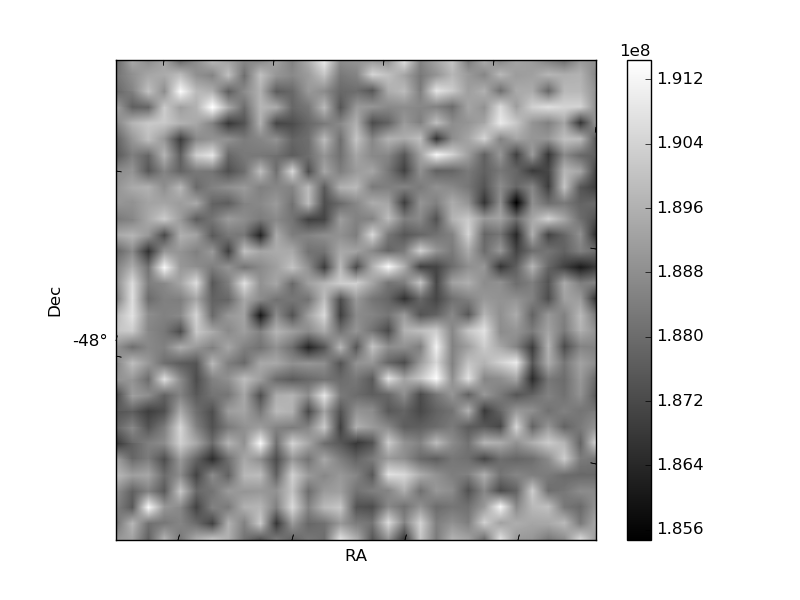
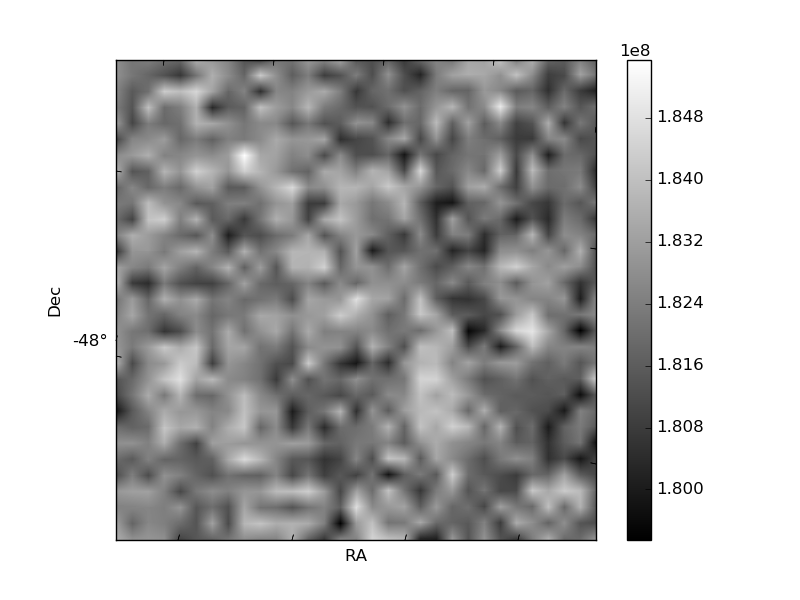
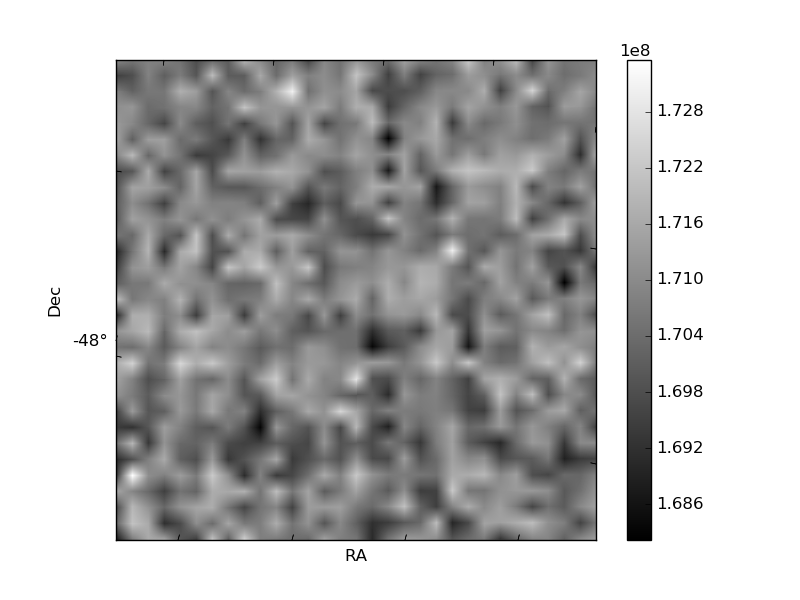
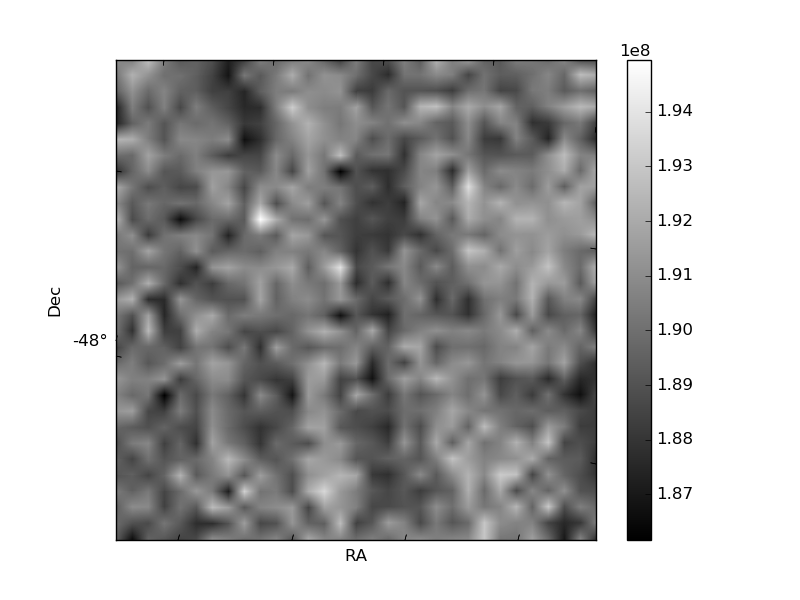
Histogram calculated using DETX and DETY for each event in the final _common_clean file
| Quadrant A | 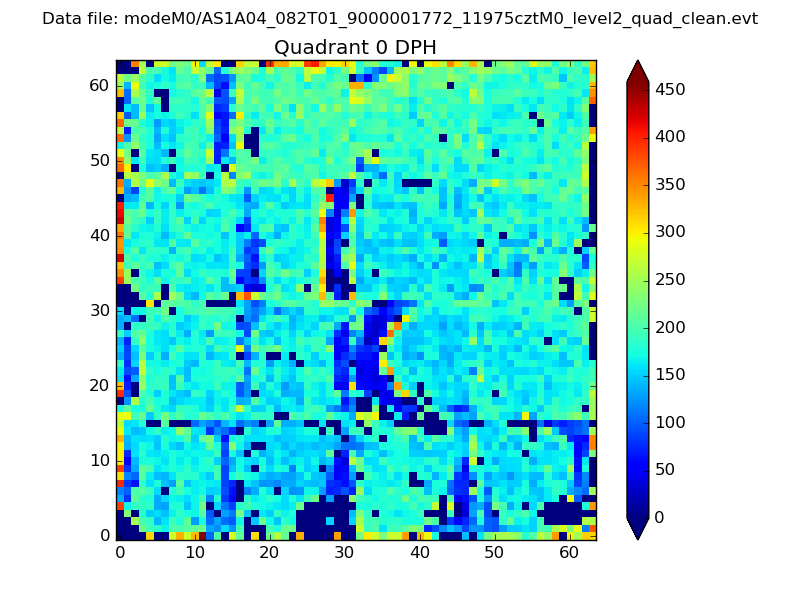 |
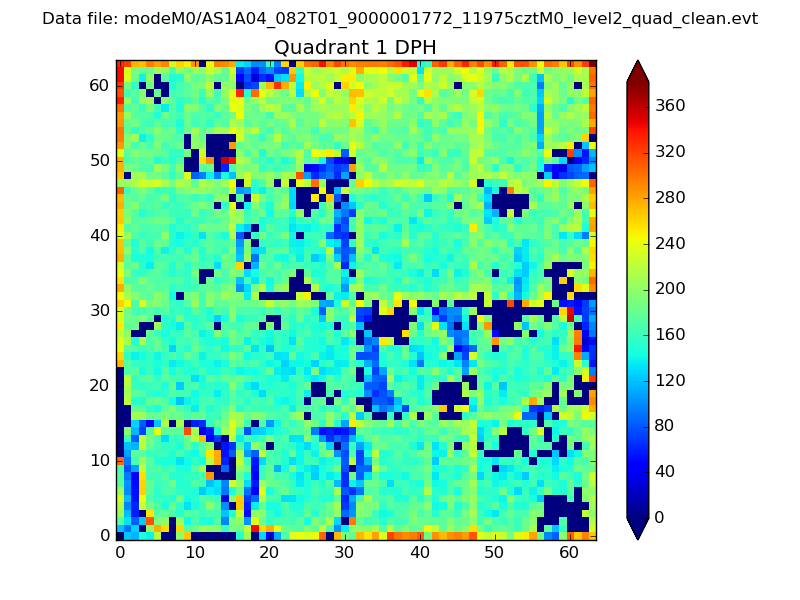 |
Quadrant B |
|---|---|---|---|
| Quadrant D | 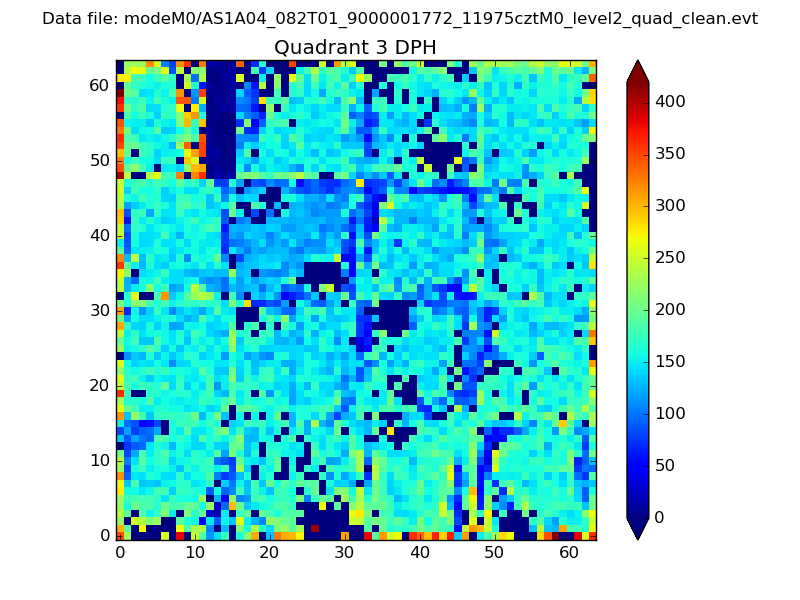 |
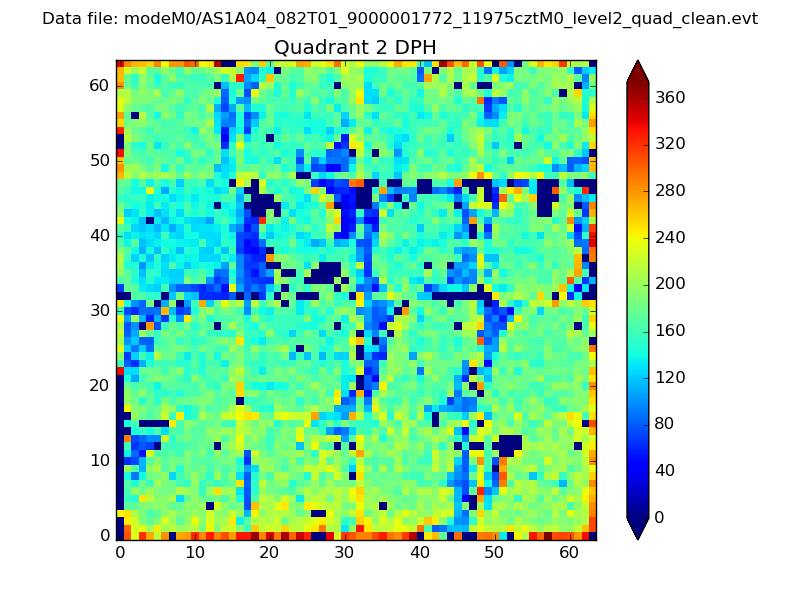 |
Quadrant C |
| Plot type | Count rate plots | Images |
|---|---|---|
| Comparison with Poisson distribution Blue bars denote a histogram of data divided into 1 sec bins. Red curve is a Poisson curve with rate = median count rate of data. |
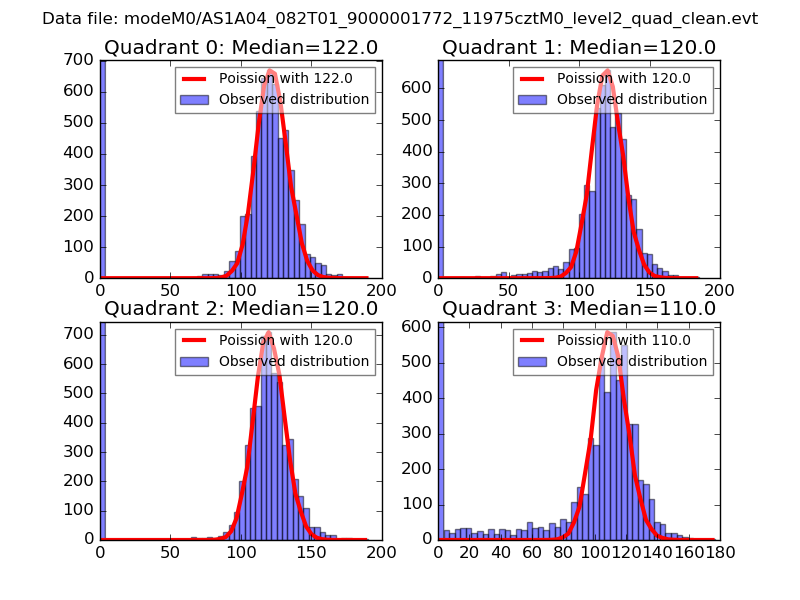 |
 |
| Quadrant-wise count rates Data is divided into 100 sec bins |
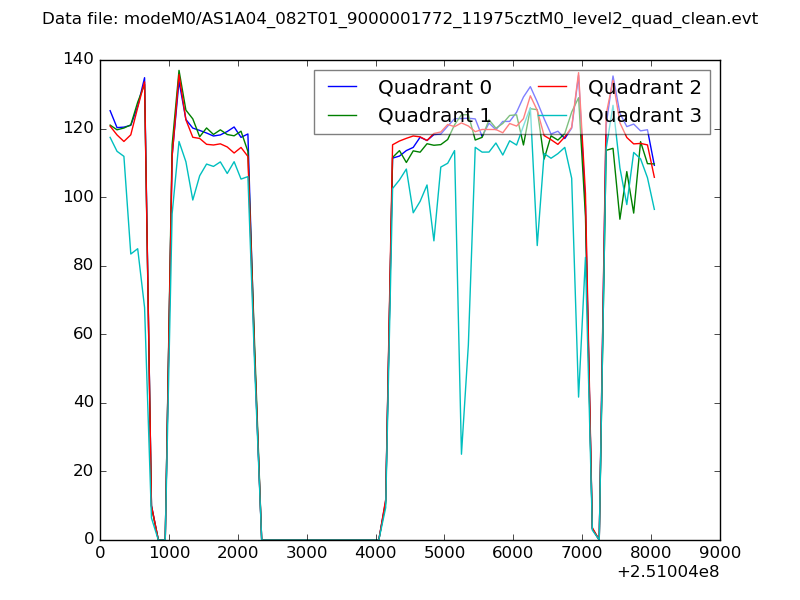 |
|
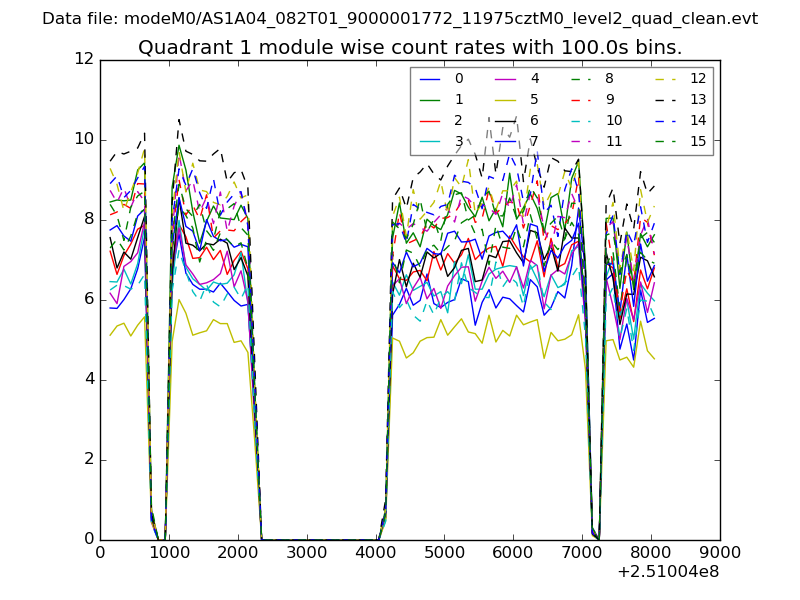
| Module-wise count rates for Quadrant A Data is divided into 100 sec bins |
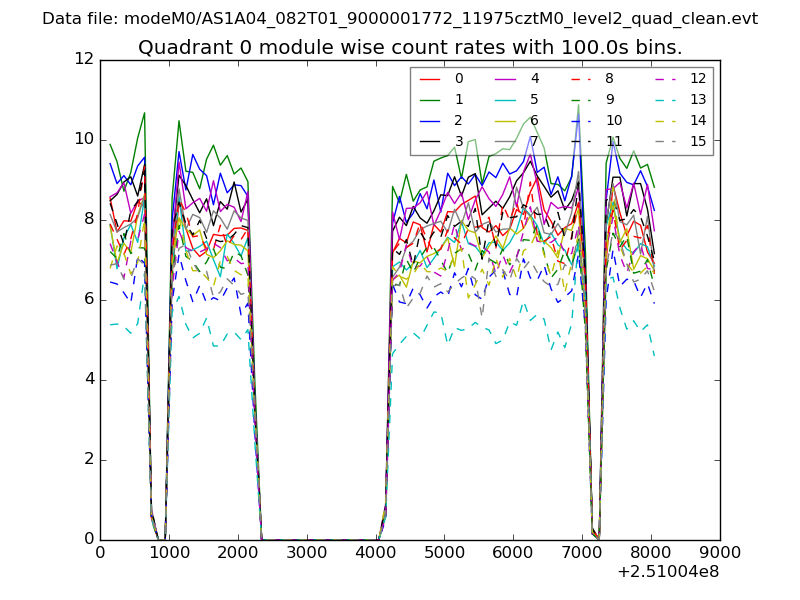 |
 |
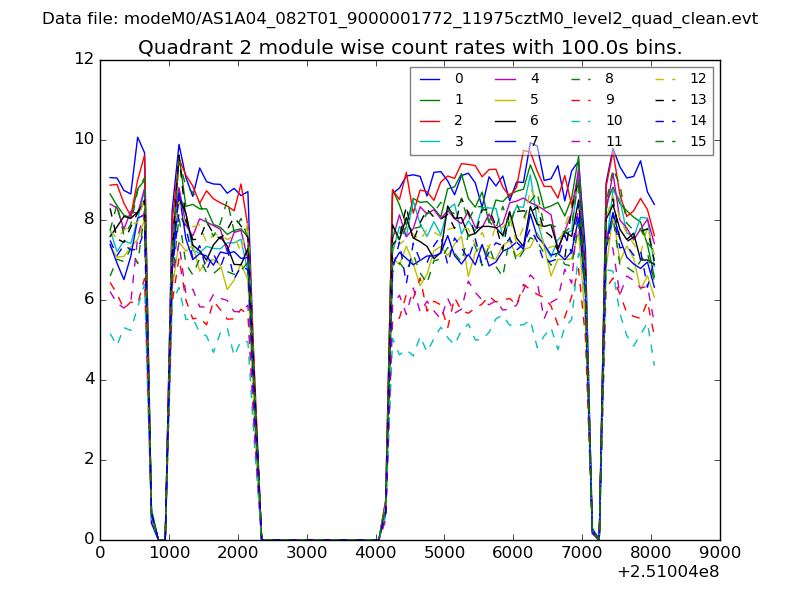
| Module-wise count rates for Quadrant B Data is divided into 100 sec bins |
 |
 |
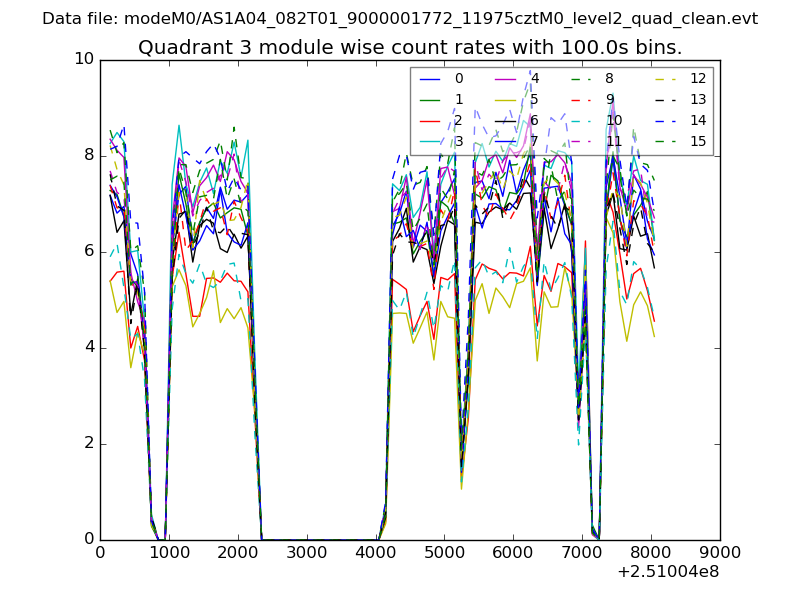
| Module-wise count rates for Quadrant C Data is divided into 100 sec bins |
 |
 |
| Module-wise count rates for Quadrant D Data is divided into 100 sec bins |
 |
 |
| Parameter | Plot |
|---|---|
| CZT HV Monitor | 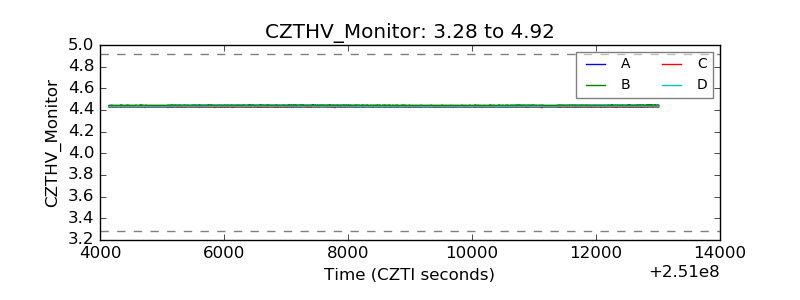 |
| D_VDD | 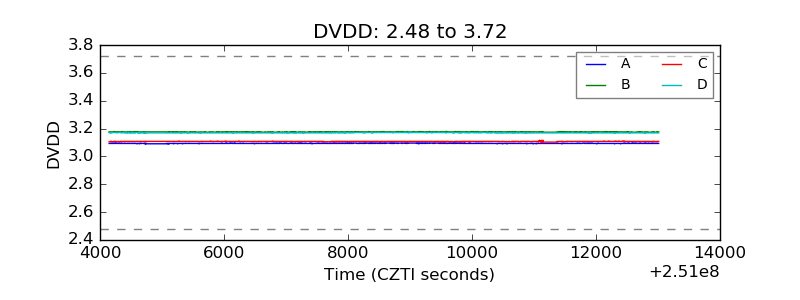 |
| Temperature 1 | 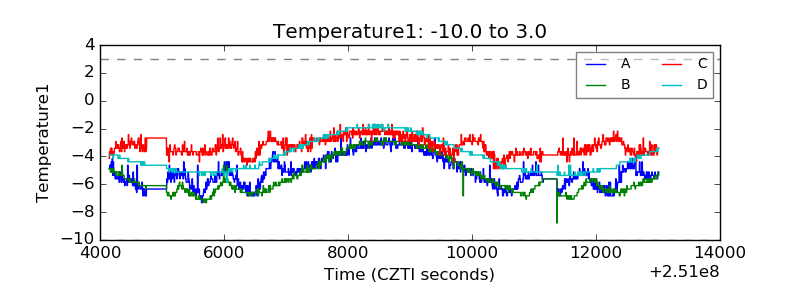 |
| Veto HV Monitor | 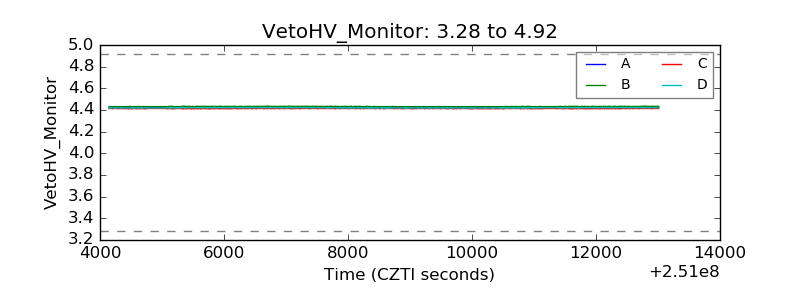 |
| Veto LLD | 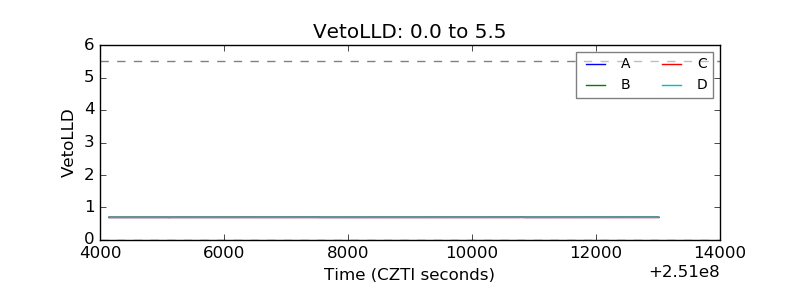 |
| Alpha Counter | 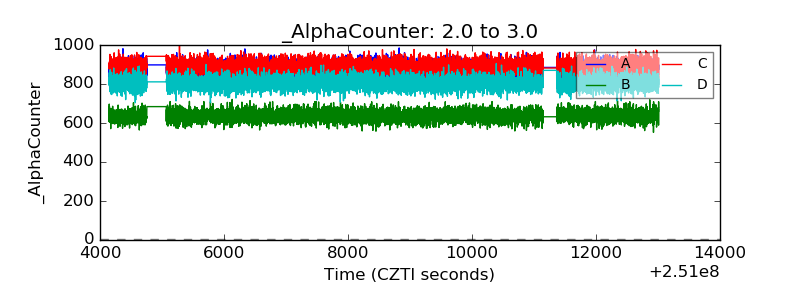 |
| _CPM_Rate | 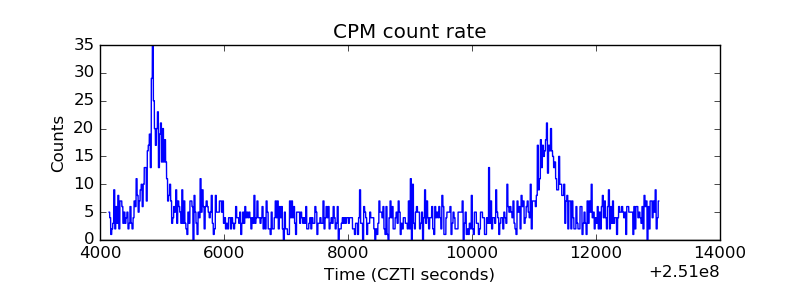 |
| CZT Counter | 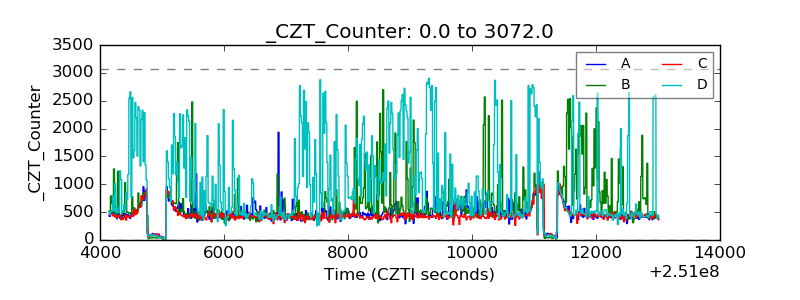 |
| +2.5 Volts monitor | 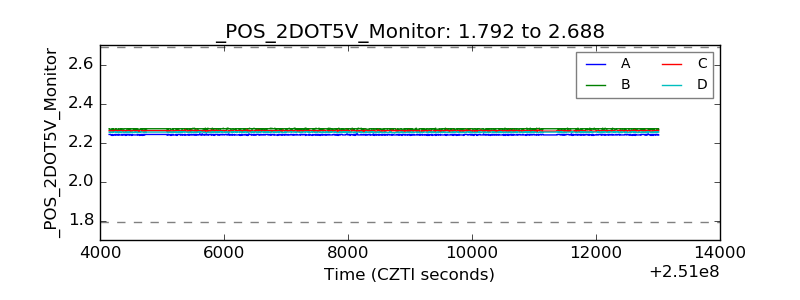 |
| +5 Volts monitor |  |
| _ROLL_ROT | 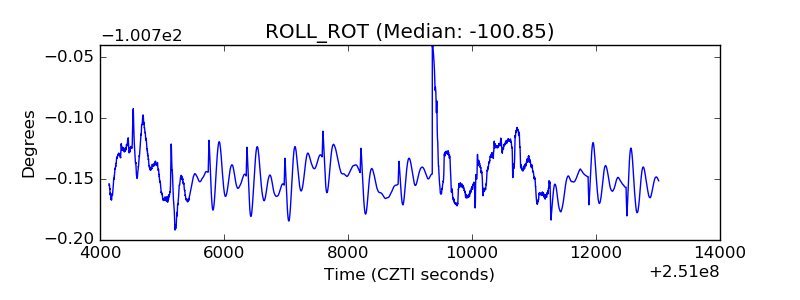 |
| _Roll_DEC | 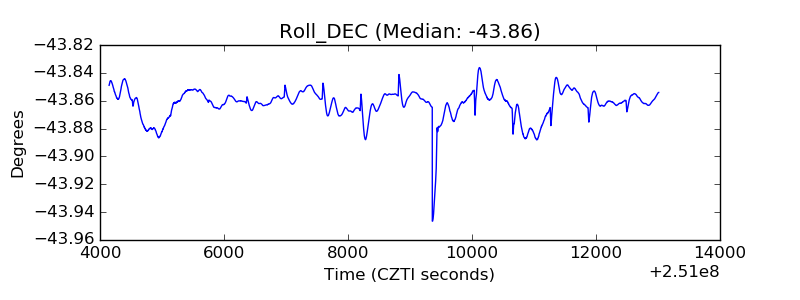 |
| _Roll_RA | 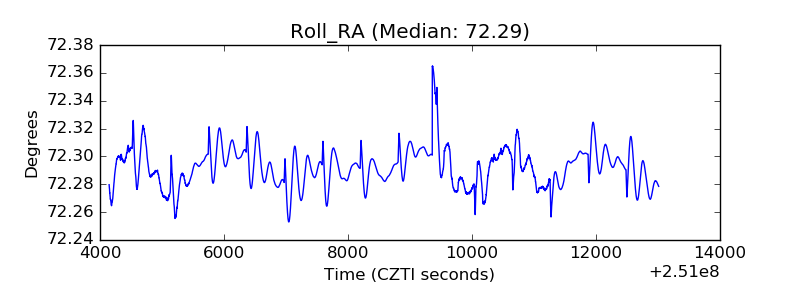 |
| Veto Counter | 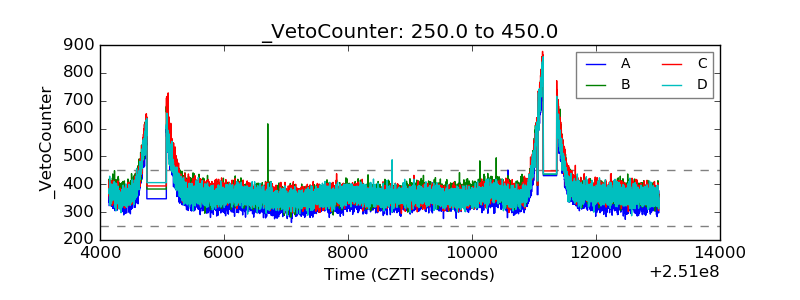 |