| Param | Original file | Final file |
|---|---|---|
| Filename | modeM0/AS1A04_082T01_9000001772_11979cztM0_level2.evt | modeM0/AS1A04_082T01_9000001772_11979cztM0_level2_quad_clean.evt |
| Size (bytes) | 1,425,355,200 | 208,575,360 |
| Size | 1.3 GB | 198.9 MB |
| Events in quadrant A | 8,171,725 | 1,331,074 |
| Events in quadrant B | 11,704,534 | 1,287,973 |
| Events in quadrant C | 7,497,069 | 1,327,214 |
| Events in quadrant D | 14,652,826 | 1,204,592 |
| Mode SS | |||
|---|---|---|---|
| Quadrant | BADHDUFLAG | Total packets | Discarded packets |
| A | 0 | 346 | 0 |
| B | 0 | 346 | 0 |
| C | 0 | 346 | 0 |
| D | 0 | 346 | 0 |
| Mode M0 | |||
|---|---|---|---|
| Quadrant | BADHDUFLAG | Total packets | Discarded packets |
| A | 0 | 35901 | 6 |
| B | 0 | 45935 | 5 |
| C | 0 | 34818 | 5 |
| D | 0 | 54725 | 5 |
| Mode M9 | |||
|---|---|---|---|
| Quadrant | BADHDUFLAG | Total packets | Discarded packets |
| A | 0 | 11 | 0 |
| B | 0 | 11 | 0 |
| C | 0 | 11 | 0 |
| D | 0 | 11 | 0 |
| Quadrant | Total seconds | Saturated seconds | Saturation percentage |
|---|---|---|---|
| A | 16886 | 423 | 2.505034% |
| B | 16886 | 1461 | 8.652138% |
| C | 16886 | 316 | 1.871373% |
| D | 16886 | 2285 | 13.531920% |
Noise dominated data is calculated using 1-second bins in cleaned event files. If a bin has >2000 counts, and if more than 50% of those come from <1% of pixels, then it is considered to be noise-dominated and hence unusable.
| Quadrant | # 1 sec bins | Bins with >0 counts | Bins with >2000 counts | High rate bins dominated by noise | Noise dominated (total time) | Noise dominated (detector-on time) | Marked lightcurve |
|---|---|---|---|---|---|---|---|
| A | 18052 | 16887 | 10 | 10 | 0.06% | 0.06% | 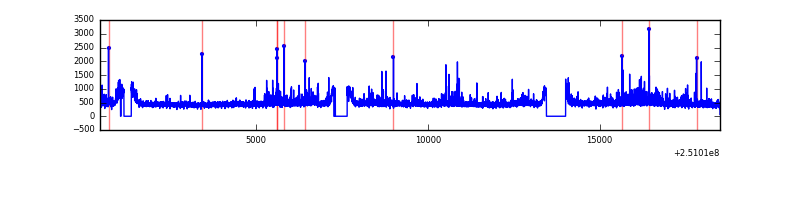 |
| B | 18052 | 16887 | 780 | 780 | 4.32% | 4.62% | 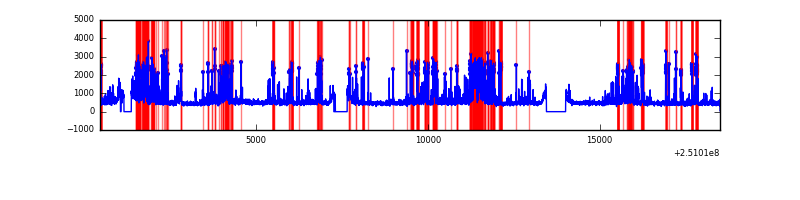 |
| C | 18052 | 16888 | 3 | 3 | 0.02% | 0.02% | 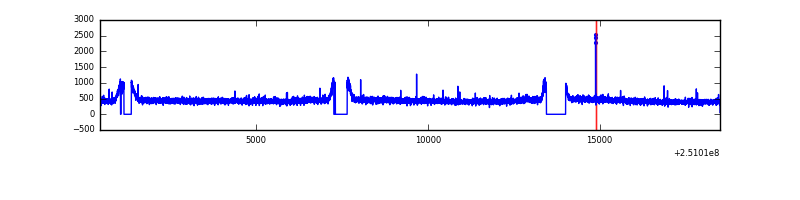 |
| D | 18051 | 16886 | 1892 | 1892 | 10.48% | 11.20% | 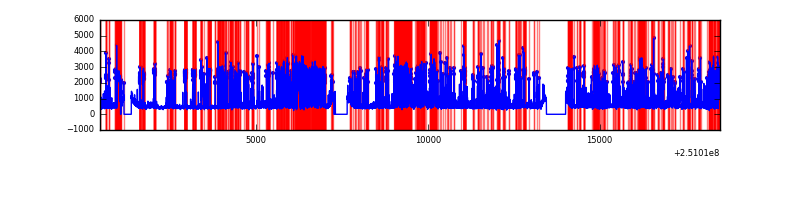 |
Top three noisy pixels from each quadrant. If the there are fewer than three noisy pixels in the level2.evt file, extra rows are filled as -1
| Pixel properties | Quadrant properties | ||||||
|---|---|---|---|---|---|---|---|
| Quadrant | DetID | PixID | Counts | Sigma | Mean | Median | Sigma |
| A | 1 | 162 | 218144 | 542.47 | 1961 | 1912 | 398.6 |
| A | 1 | 178 | 108183 | 266.61 | 1961 | 1912 | 398.6 |
| A | 1 | 161 | 95690 | 235.26 | 1961 | 1912 | 398.6 |
| B | 4 | 239 | 2345866 | 6336.79 | 1919 | 1866 | 369.9 |
| B | 0 | 85 | 1229145 | 3317.84 | 1919 | 1866 | 369.9 |
| B | 15 | 204 | 202477 | 542.33 | 1919 | 1866 | 369.9 |
| C | 14 | 234 | 15878 | 31.31 | 1918 | 1923 | 445.8 |
| C | 13 | 61 | 14044 | 27.19 | 1918 | 1923 | 445.8 |
| C | 5 | 96 | 6211 | 9.62 | 1918 | 1923 | 445.8 |
| D | 1 | 52 | 6261017 | 14441.44 | 1806 | 1757 | 433.4 |
| D | 8 | 195 | 536935 | 1234.77 | 1806 | 1757 | 433.4 |
| D | 10 | 199 | 180302 | 411.94 | 1806 | 1757 | 433.4 |
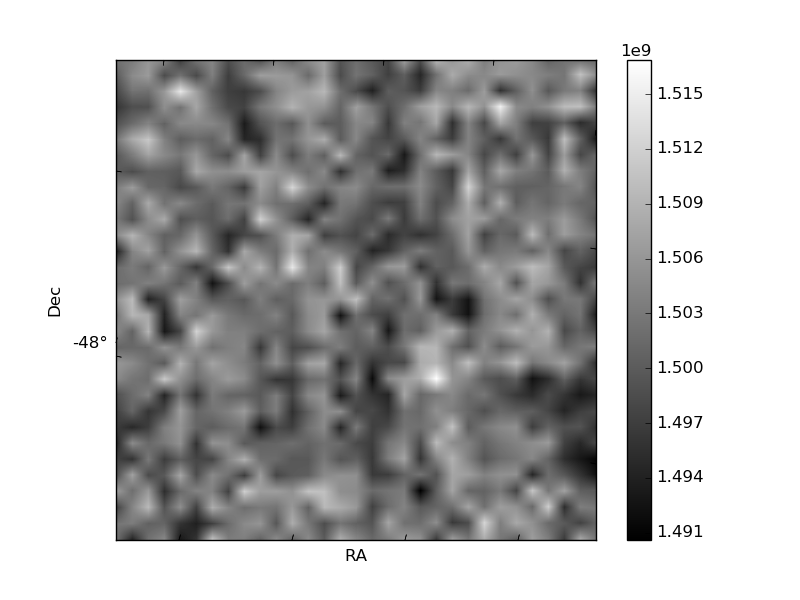
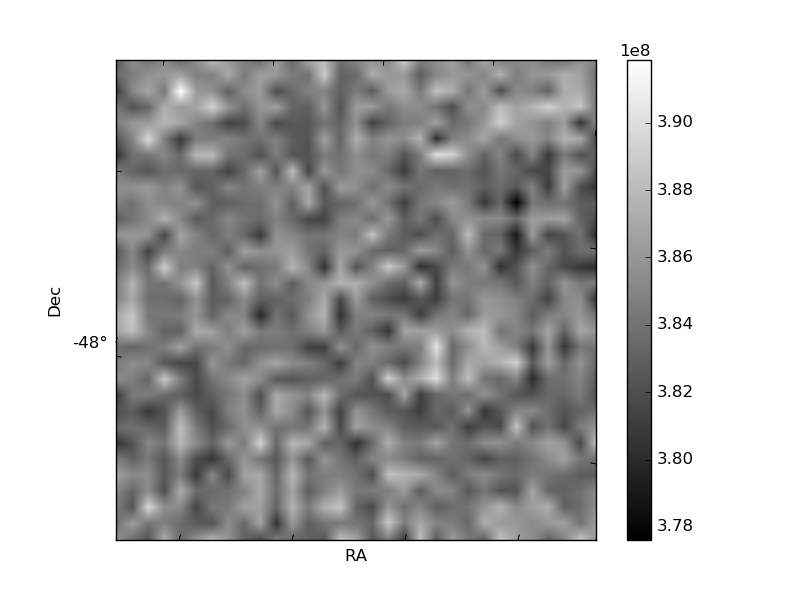
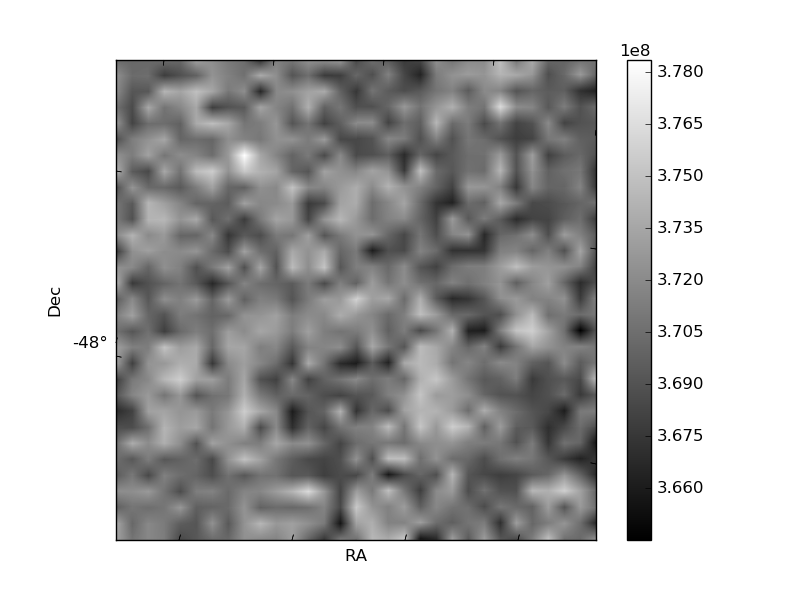
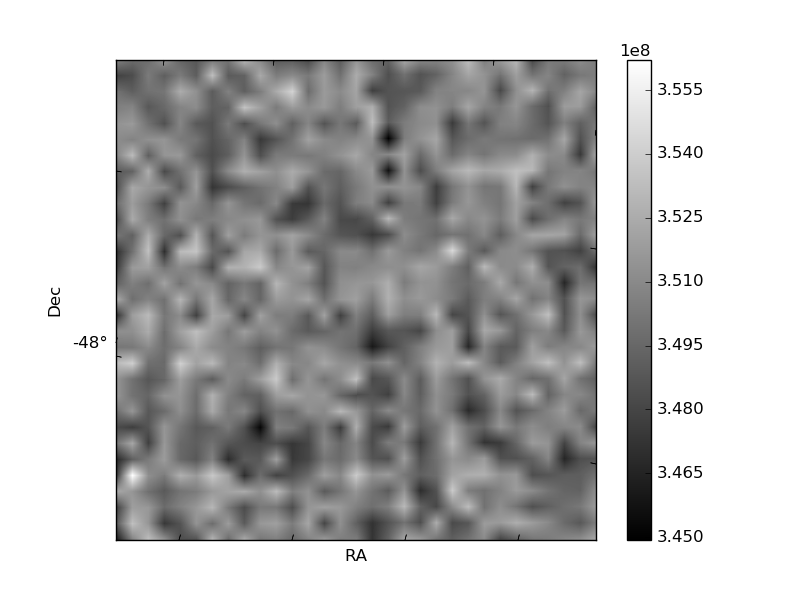
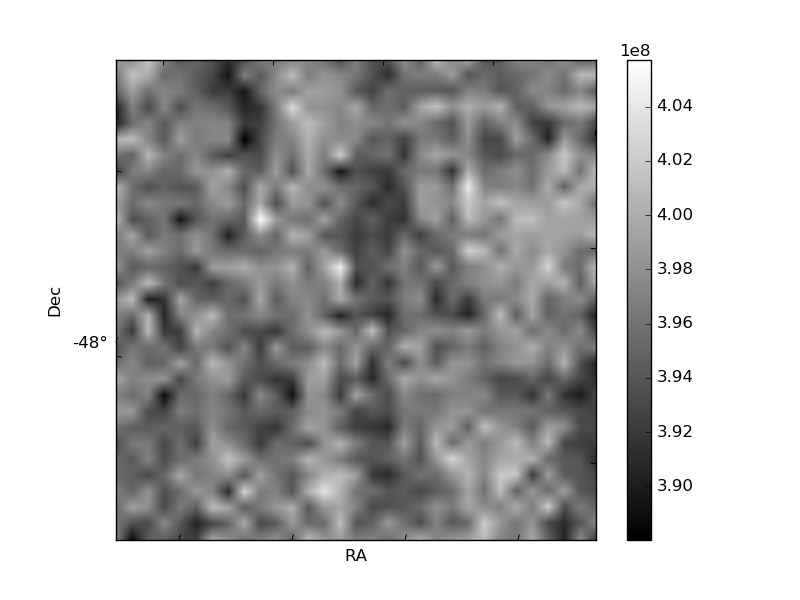
Histogram calculated using DETX and DETY for each event in the final _common_clean file
| Quadrant A | 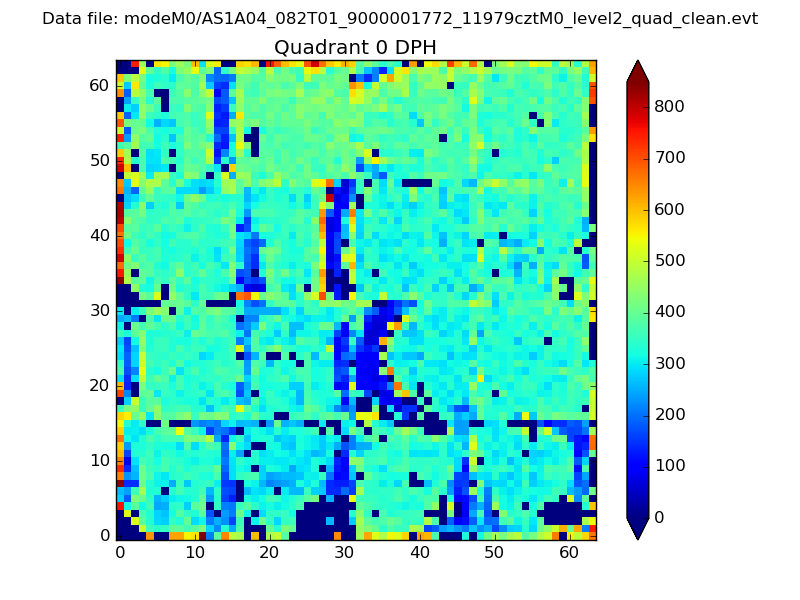 |
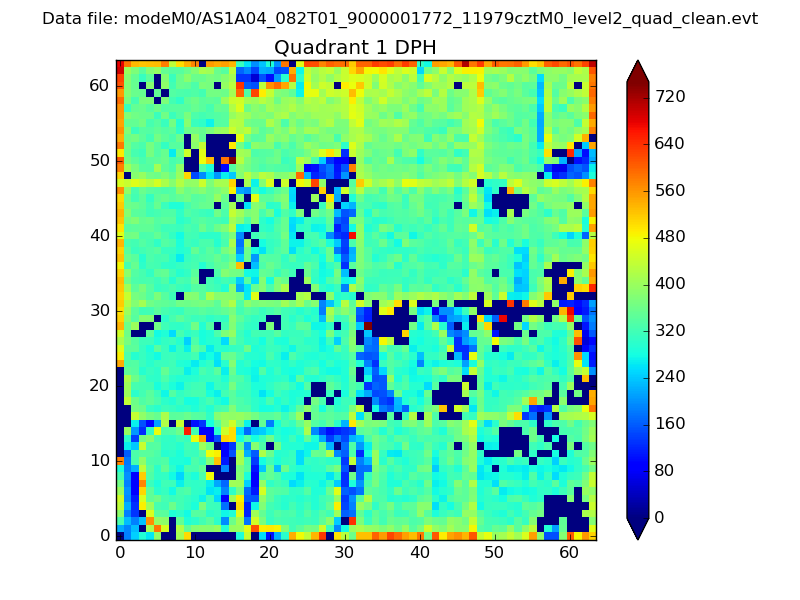 |
Quadrant B |
|---|---|---|---|
| Quadrant D | 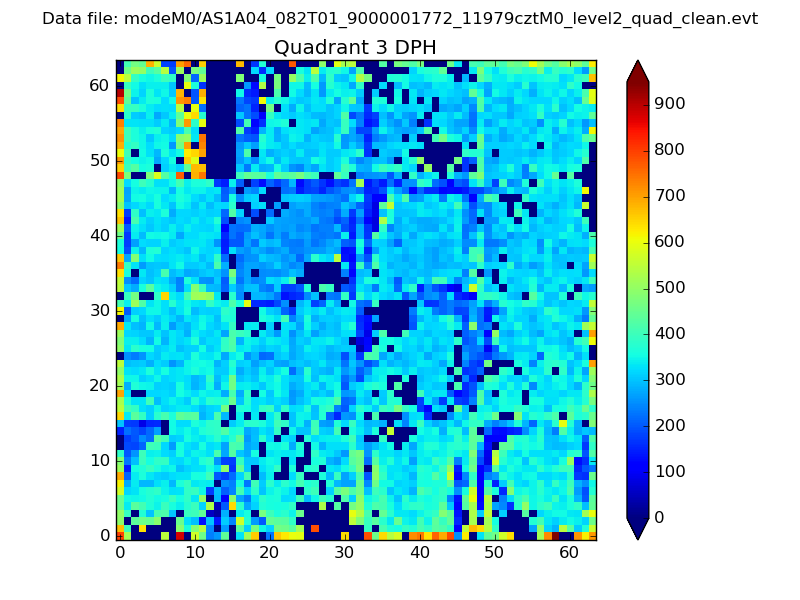 |
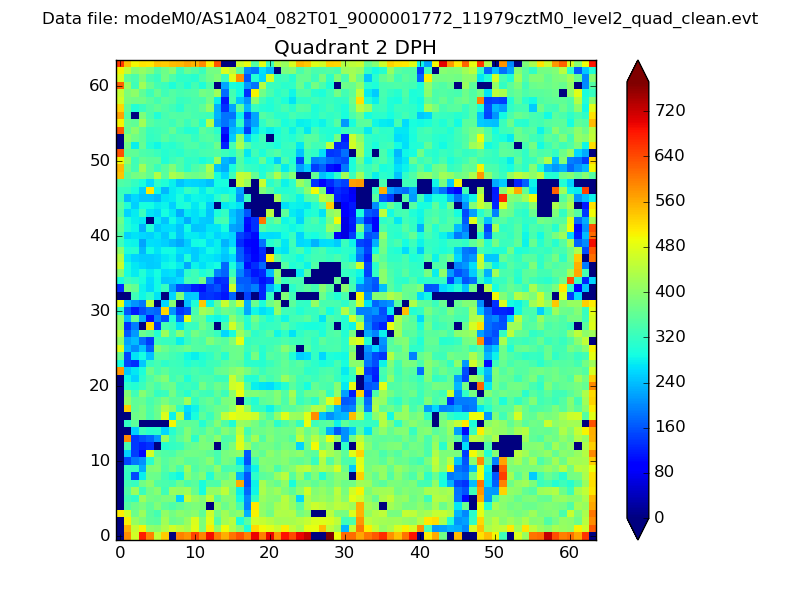 |
Quadrant C |
| Plot type | Count rate plots | Images |
|---|---|---|
| Comparison with Poisson distribution Blue bars denote a histogram of data divided into 1 sec bins. Red curve is a Poisson curve with rate = median count rate of data. |
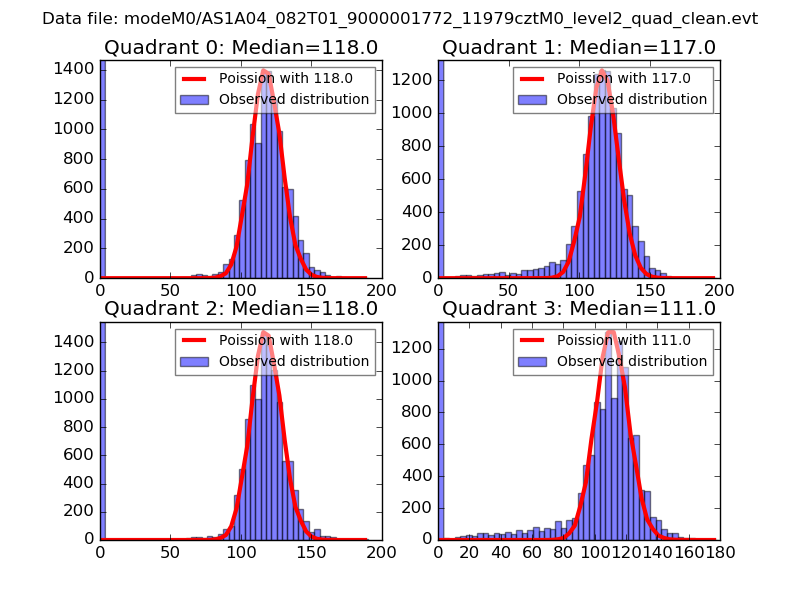 |
 |
| Quadrant-wise count rates Data is divided into 100 sec bins |
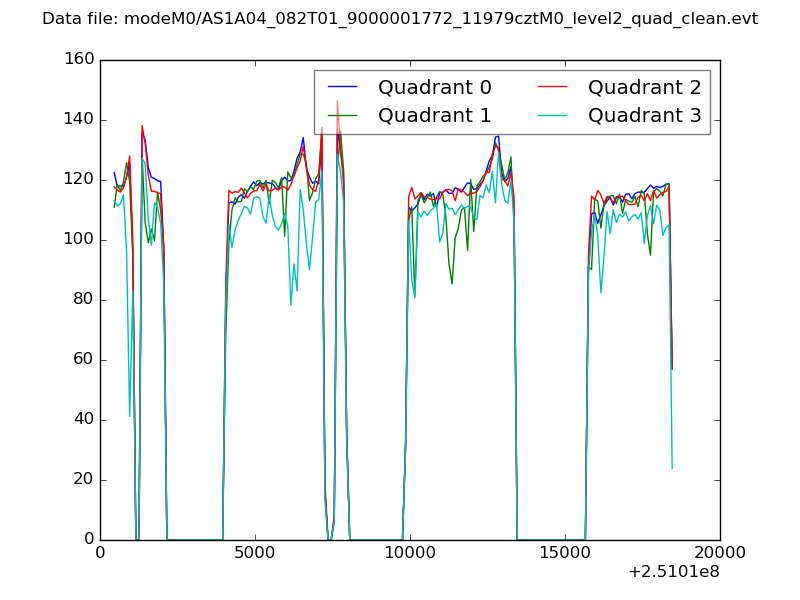 |
|
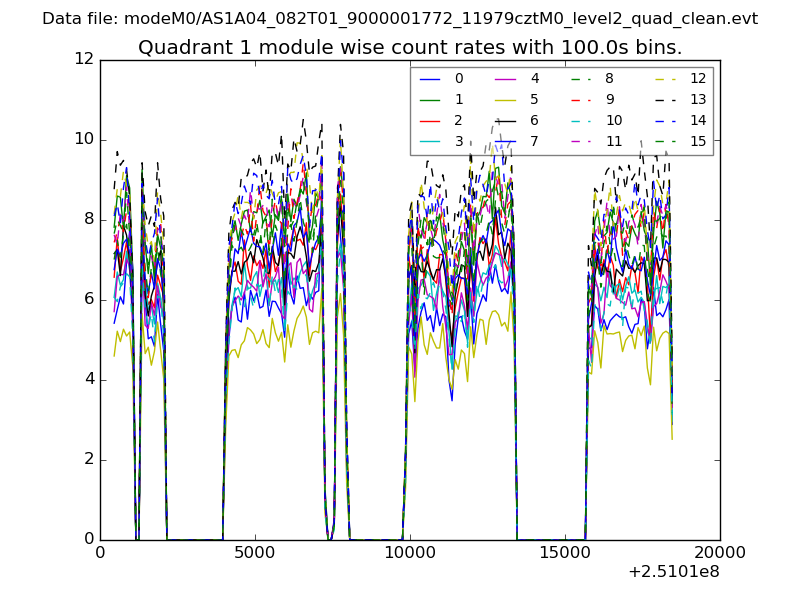
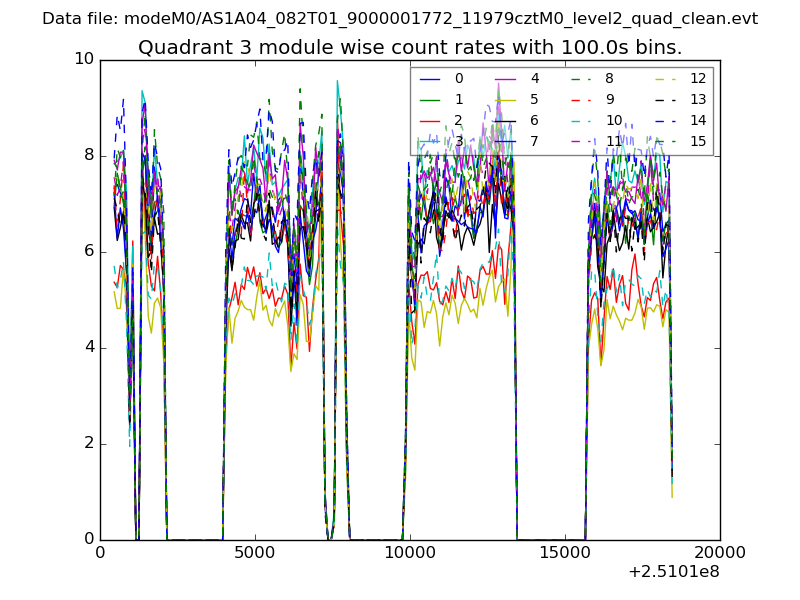
| Module-wise count rates for Quadrant A Data is divided into 100 sec bins |
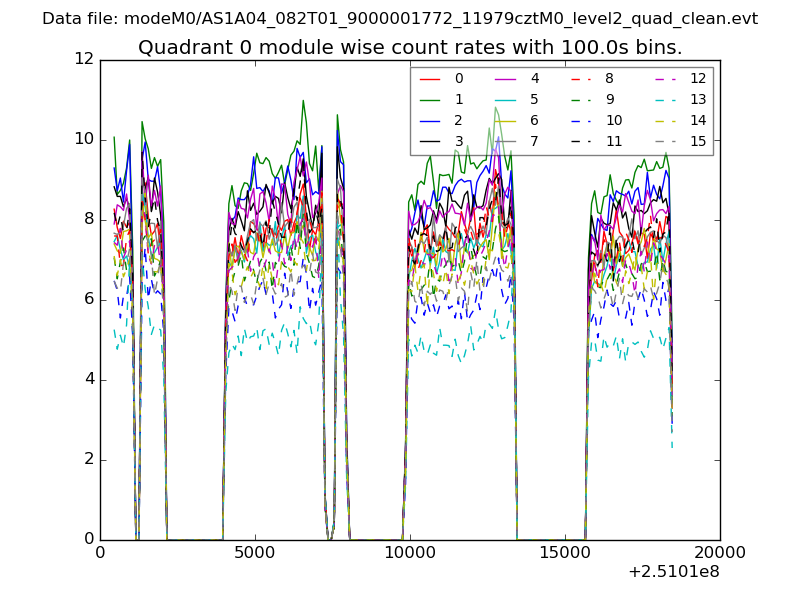 |
 |
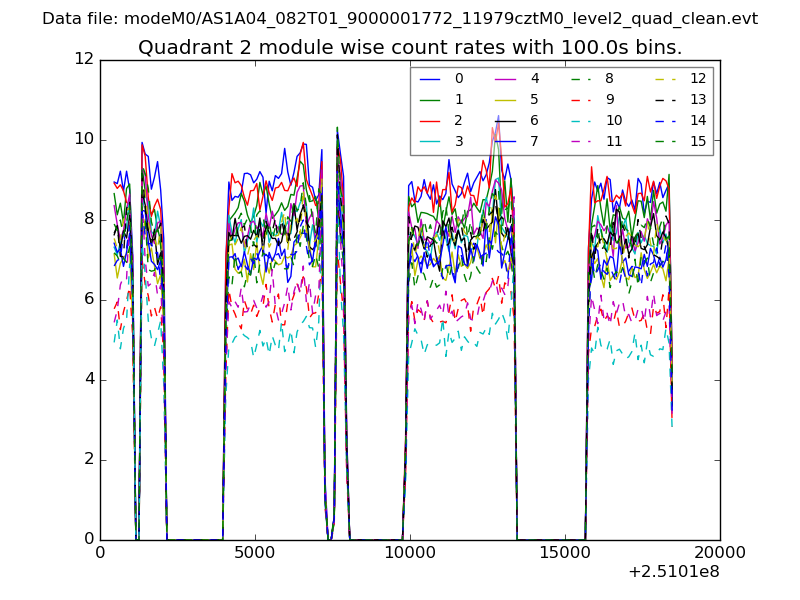
| Module-wise count rates for Quadrant B Data is divided into 100 sec bins |
 |
 |
| Module-wise count rates for Quadrant C Data is divided into 100 sec bins |
 |
 |
| Module-wise count rates for Quadrant D Data is divided into 100 sec bins |
 |
 |
| Parameter | Plot |
|---|---|
| CZT HV Monitor | 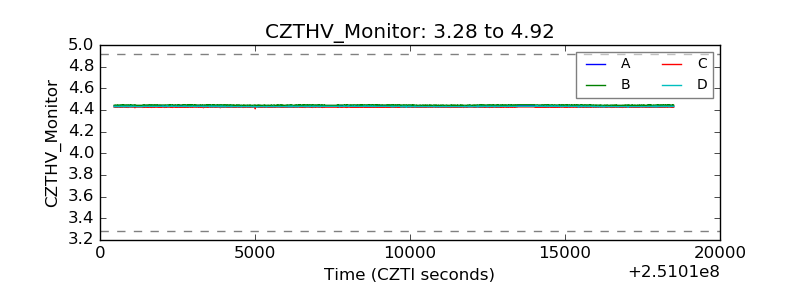 |
| D_VDD |  |
| Temperature 1 | 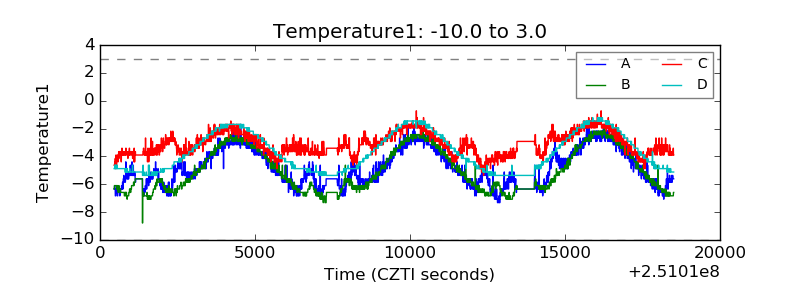 |
| Veto HV Monitor | 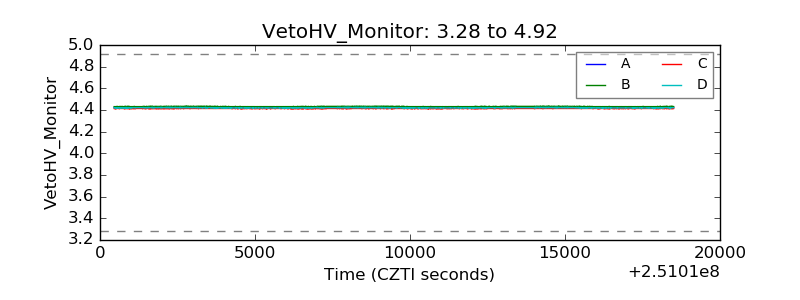 |
| Veto LLD | 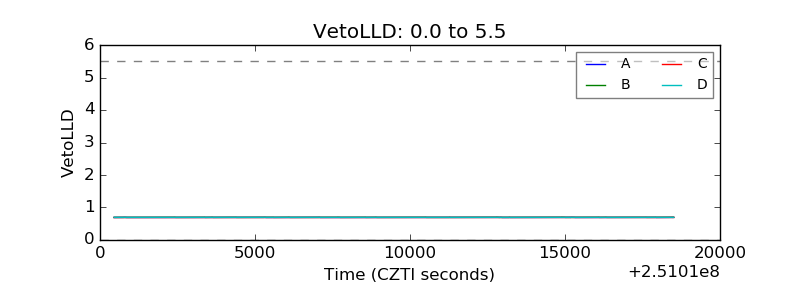 |
| Alpha Counter | 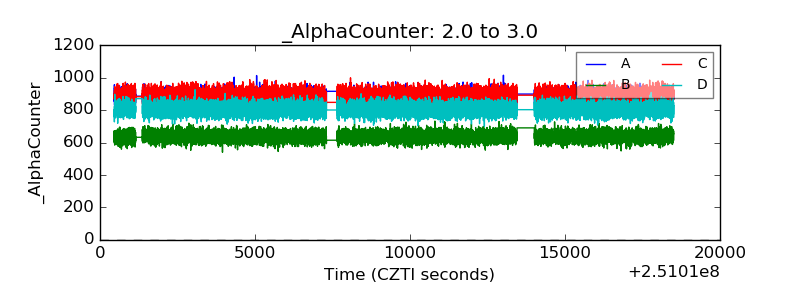 |
| _CPM_Rate | 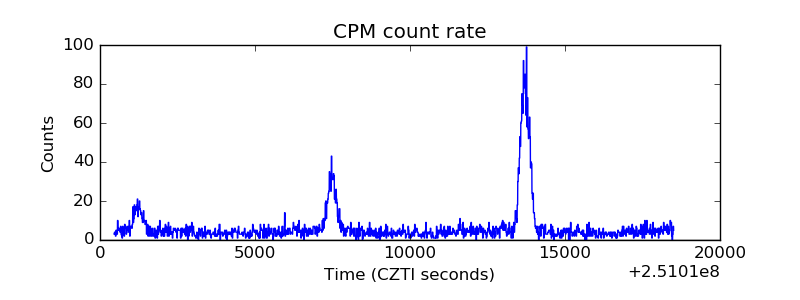 |
| CZT Counter | 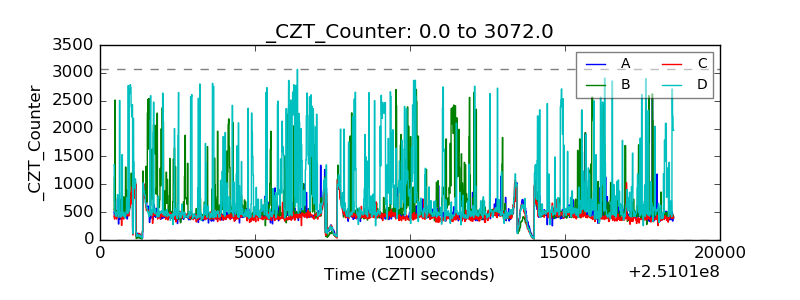 |
| +2.5 Volts monitor |  |
| +5 Volts monitor |  |
| _ROLL_ROT | 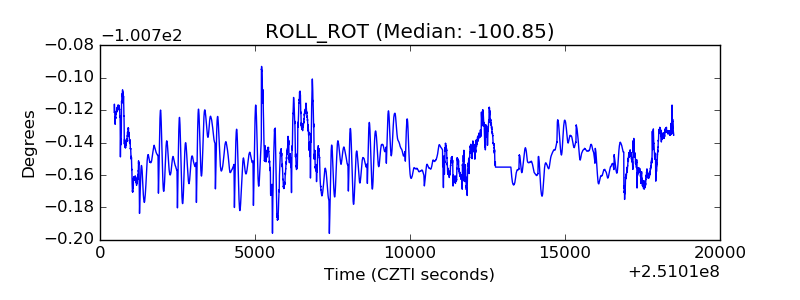 |
| _Roll_DEC | 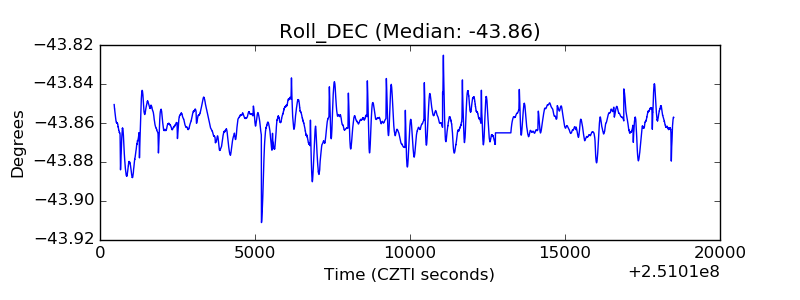 |
| _Roll_RA | 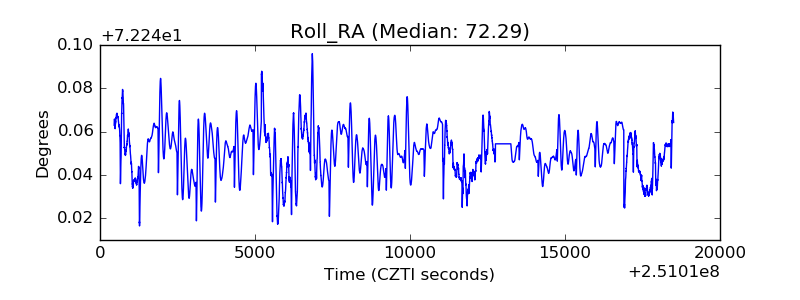 |
| Veto Counter | 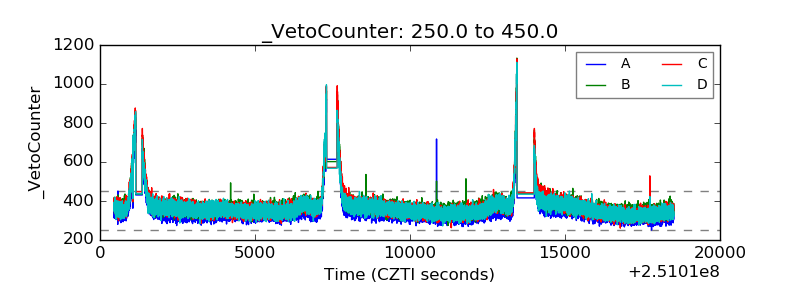 |