| Param | Original file | Final file |
|---|---|---|
| Filename | modeM0/AS1A04_082T01_9000001772_11982cztM0_level2.evt | modeM0/AS1A04_082T01_9000001772_11982cztM0_level2_quad_clean.evt |
| Size (bytes) | 489,816,000 | 109,022,400 |
| Size | 467.1 MB | 104.0 MB |
| Events in quadrant A | 3,529,792 | 720,104 |
| Events in quadrant B | 4,163,293 | 720,828 |
| Events in quadrant C | 3,159,461 | 701,695 |
| Events in quadrant D | 3,517,683 | 683,321 |
| Mode SS | |||
|---|---|---|---|
| Quadrant | BADHDUFLAG | Total packets | Discarded packets |
| A | 0 | 144 | 0 |
| B | 0 | 144 | 0 |
| C | 0 | 144 | 0 |
| D | 0 | 144 | 0 |
| Mode M0 | |||
|---|---|---|---|
| Quadrant | BADHDUFLAG | Total packets | Discarded packets |
| A | 0 | 15085 | 3 |
| B | 0 | 16913 | 2 |
| C | 0 | 14139 | 2 |
| D | 0 | 15140 | 2 |
| Mode M9 | |||
|---|---|---|---|
| Quadrant | BADHDUFLAG | Total packets | Discarded packets |
| A | 0 | 21 | 0 |
| B | 0 | 21 | 0 |
| C | 0 | 21 | 0 |
| D | 0 | 21 | 0 |
| Quadrant | Total seconds | Saturated seconds | Saturation percentage |
|---|---|---|---|
| A | 6818 | 127 | 1.862716% |
| B | 6818 | 256 | 3.754767% |
| C | 6818 | 66 | 0.968026% |
| D | 6818 | 97 | 1.422705% |
Noise dominated data is calculated using 1-second bins in cleaned event files. If a bin has >2000 counts, and if more than 50% of those come from <1% of pixels, then it is considered to be noise-dominated and hence unusable.
| Quadrant | # 1 sec bins | Bins with >0 counts | Bins with >2000 counts | High rate bins dominated by noise | Noise dominated (total time) | Noise dominated (detector-on time) | Marked lightcurve |
|---|---|---|---|---|---|---|---|
| A | 9049 | 6819 | 5 | 5 | 0.06% | 0.07% | 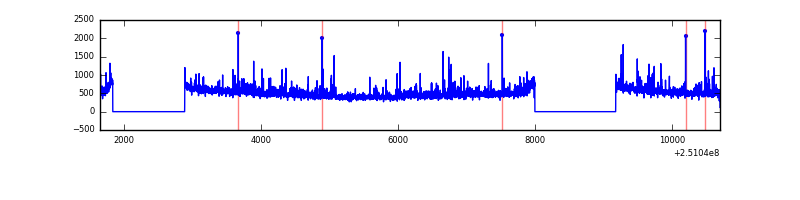 |
| B | 9049 | 6819 | 92 | 92 | 1.02% | 1.35% | 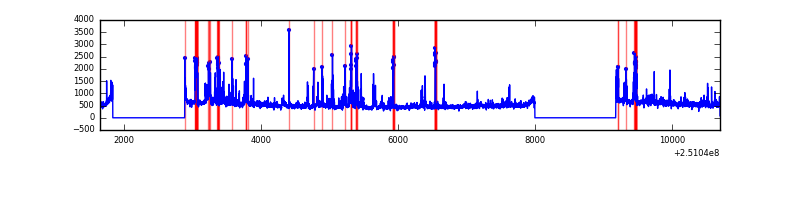 |
| C | 9049 | 6819 | 0 | 0 | 0.00% | 0.00% | 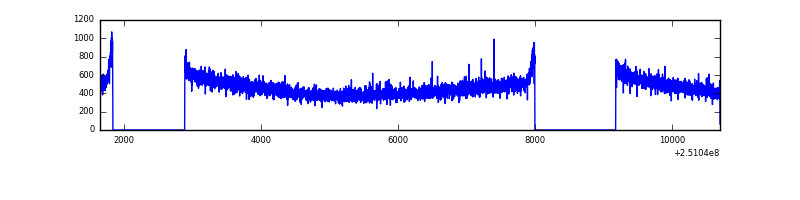 |
| D | 9049 | 6820 | 23 | 23 | 0.25% | 0.34% | 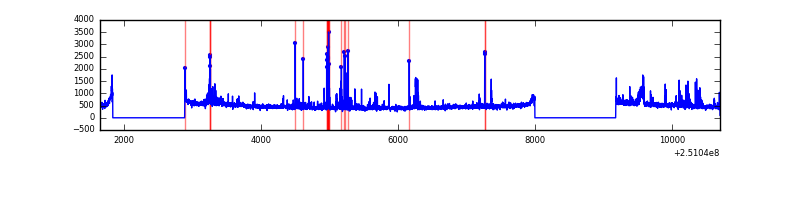 |
Top three noisy pixels from each quadrant. If the there are fewer than three noisy pixels in the level2.evt file, extra rows are filled as -1
| Pixel properties | Quadrant properties | ||||||
|---|---|---|---|---|---|---|---|
| Quadrant | DetID | PixID | Counts | Sigma | Mean | Median | Sigma |
| A | 1 | 162 | 98751 | 571.9 | 848 | 830 | 171.2 |
| A | 1 | 178 | 49646 | 285.11 | 848 | 830 | 171.2 |
| A | 1 | 161 | 44754 | 256.54 | 848 | 830 | 171.2 |
| B | 4 | 239 | 609763 | 3822.4 | 840 | 820 | 159.3 |
| B | 15 | 204 | 144875 | 904.25 | 840 | 820 | 159.3 |
| B | 3 | 64 | 49612 | 306.27 | 840 | 820 | 159.3 |
| C | 13 | 61 | 5953 | 27.41 | 809 | 812 | 187.5 |
| C | 14 | 234 | 2364 | 8.28 | 809 | 812 | 187.5 |
| C | 3 | 202 | 2009 | 6.38 | 809 | 812 | 187.5 |
| D | 10 | 50 | 122702 | 581.53 | 800 | 782 | 209.7 |
| D | 8 | 195 | 85863 | 405.82 | 800 | 782 | 209.7 |
| D | 13 | 104 | 62089 | 292.42 | 800 | 782 | 209.7 |
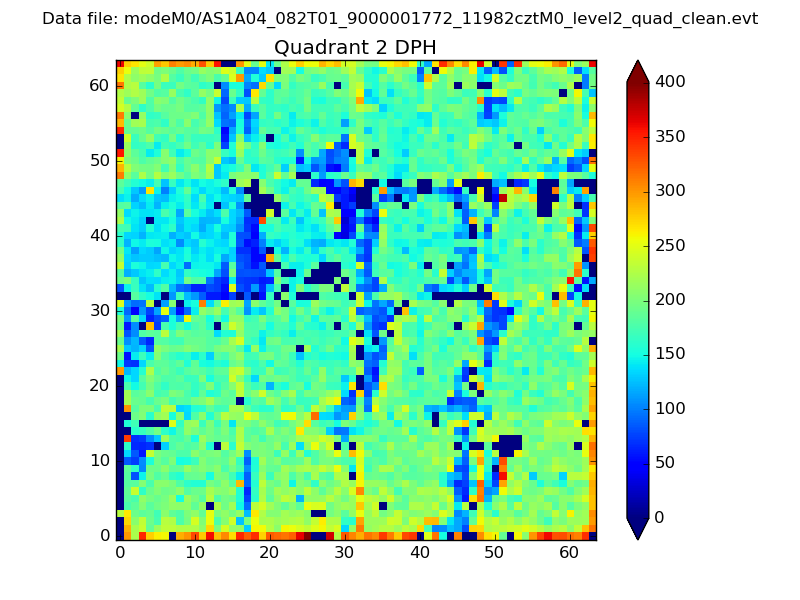
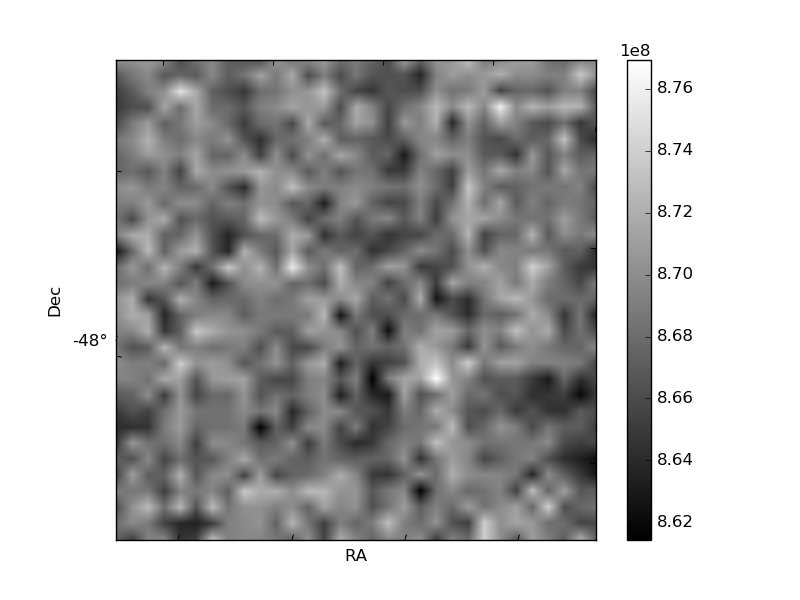
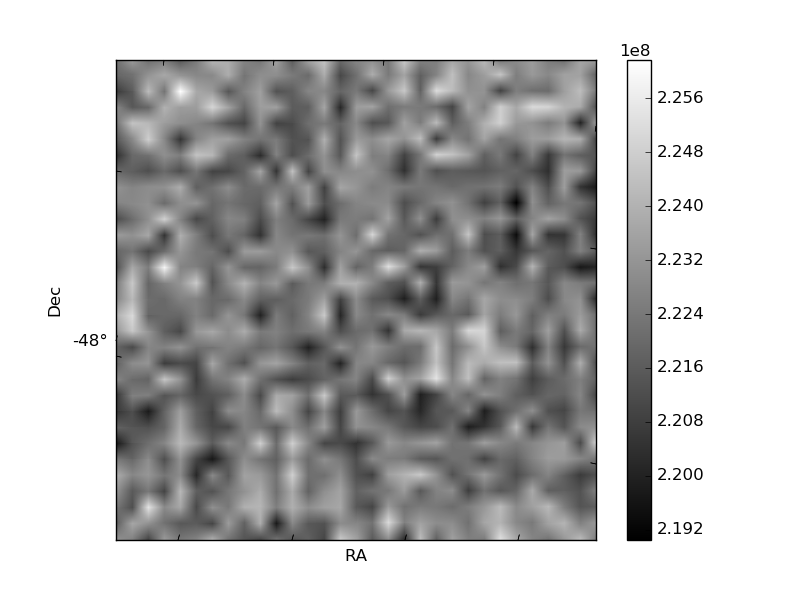
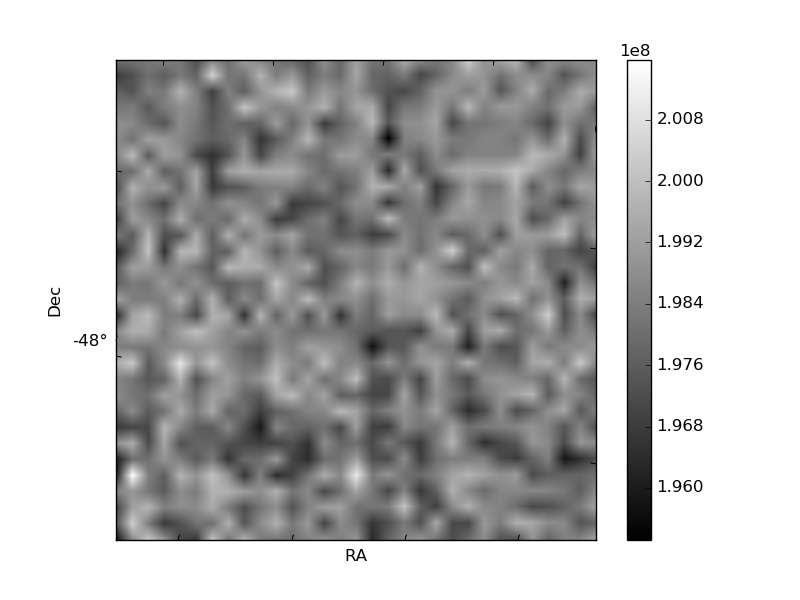
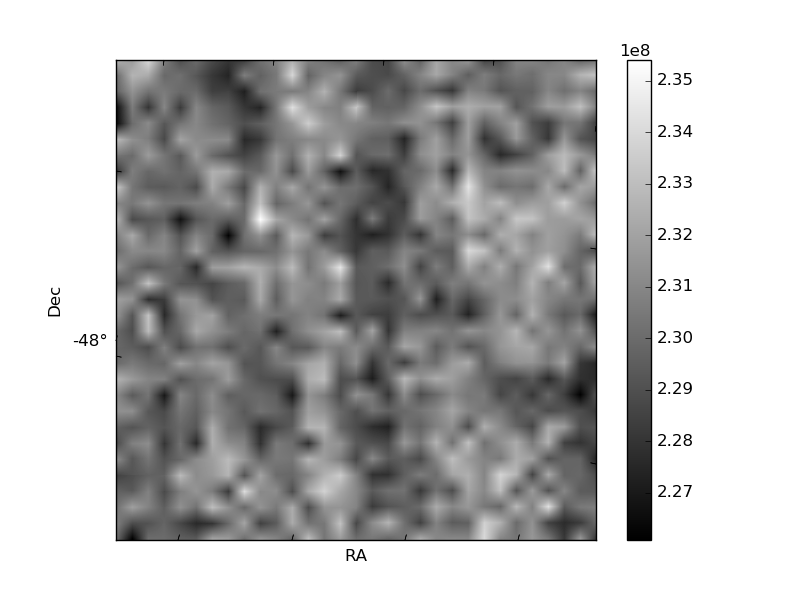
Histogram calculated using DETX and DETY for each event in the final _common_clean file
| Quadrant A | 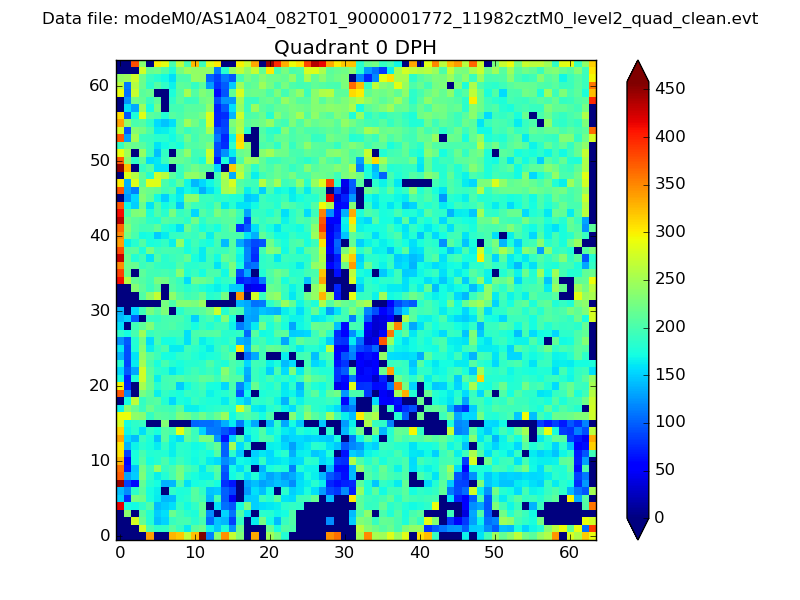 |
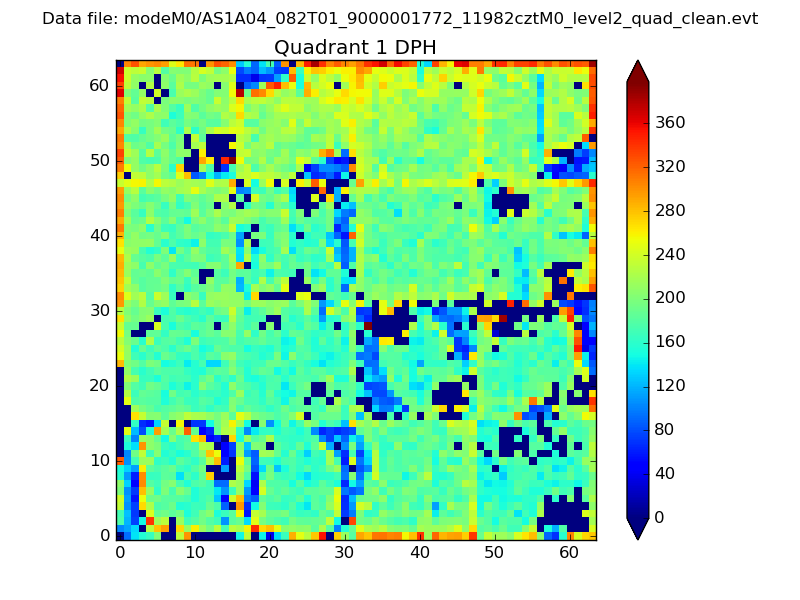 |
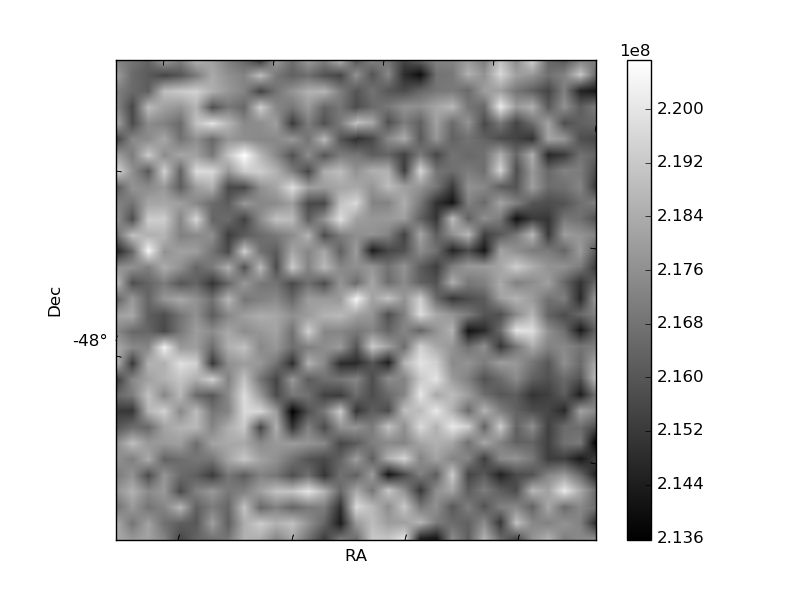
Quadrant B |
|---|---|---|---|
| Quadrant D | 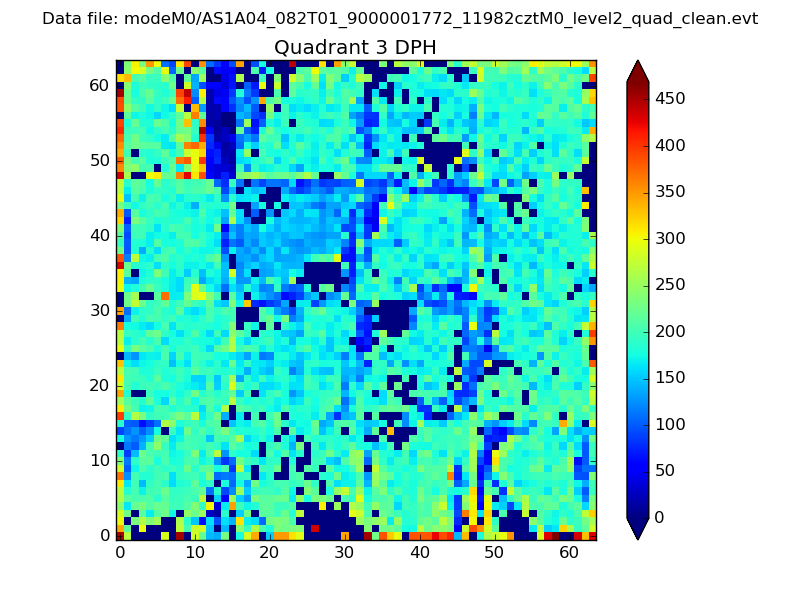 |
 |
Quadrant C |
| Plot type | Count rate plots | Images |
|---|---|---|
| Comparison with Poisson distribution Blue bars denote a histogram of data divided into 1 sec bins. Red curve is a Poisson curve with rate = median count rate of data. |
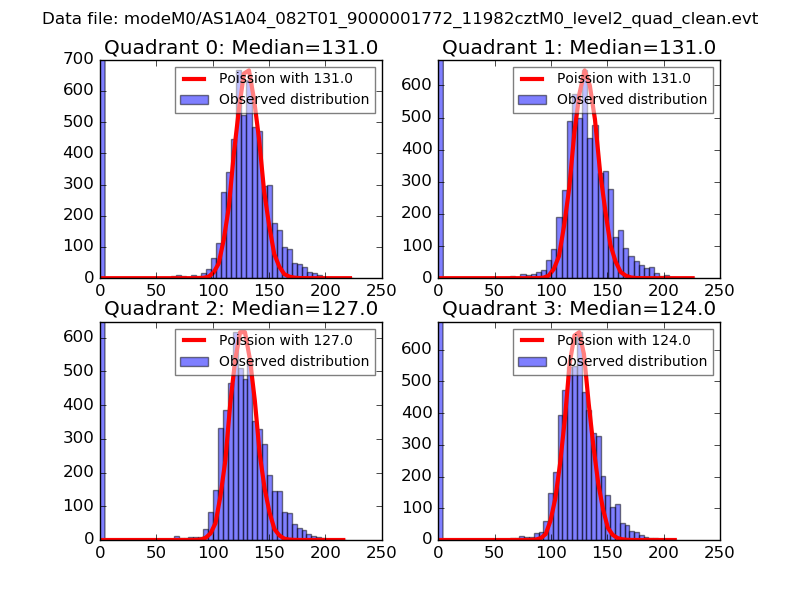 |
 |
| Quadrant-wise count rates Data is divided into 100 sec bins |
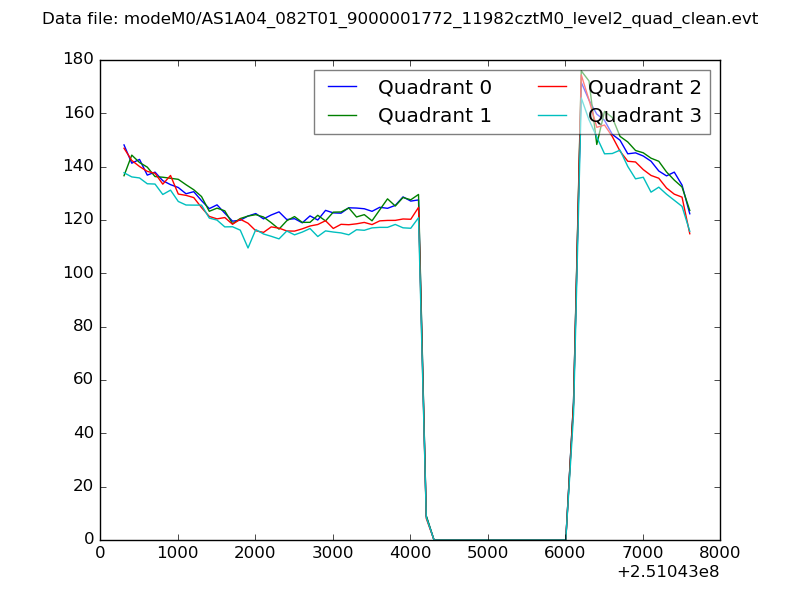 |
|
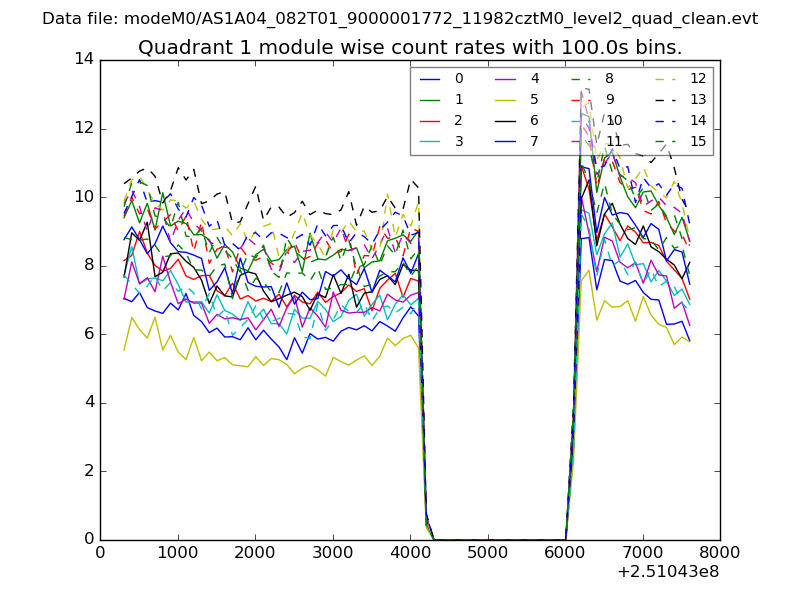
| Module-wise count rates for Quadrant A Data is divided into 100 sec bins |
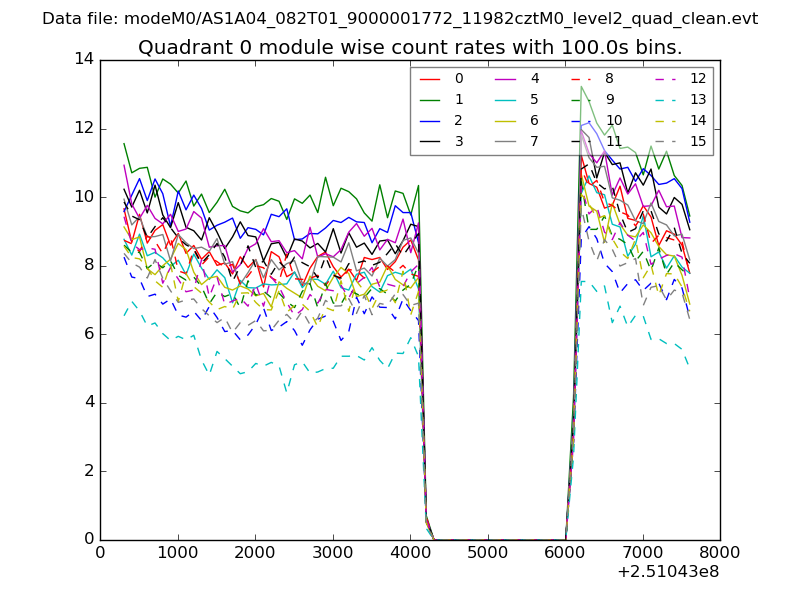 |
 |
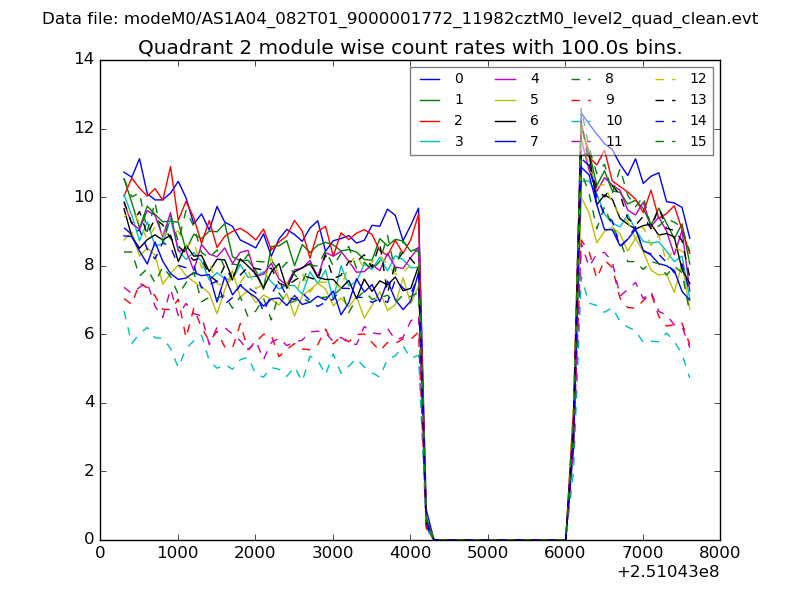
| Module-wise count rates for Quadrant B Data is divided into 100 sec bins |
 |
 |
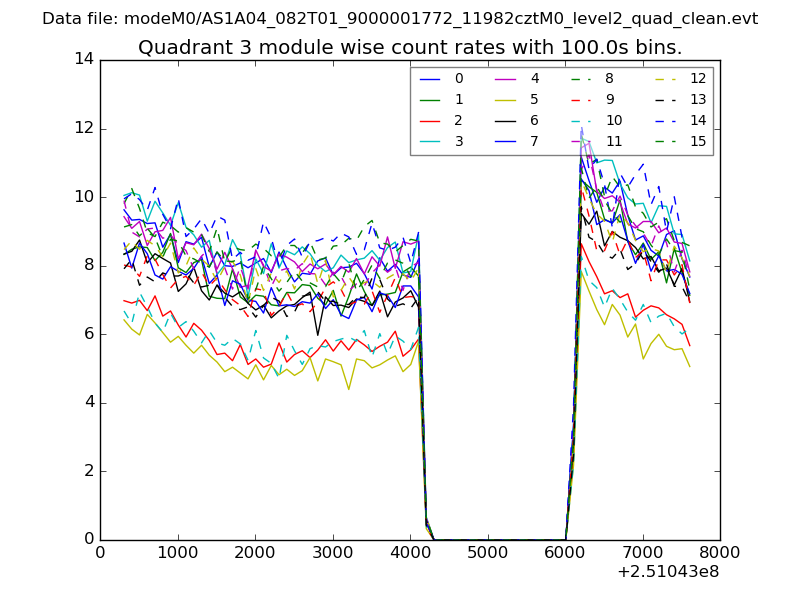
| Module-wise count rates for Quadrant C Data is divided into 100 sec bins |
 |
 |
| Module-wise count rates for Quadrant D Data is divided into 100 sec bins |
 |
 |
| Parameter | Plot |
|---|---|
| CZT HV Monitor | 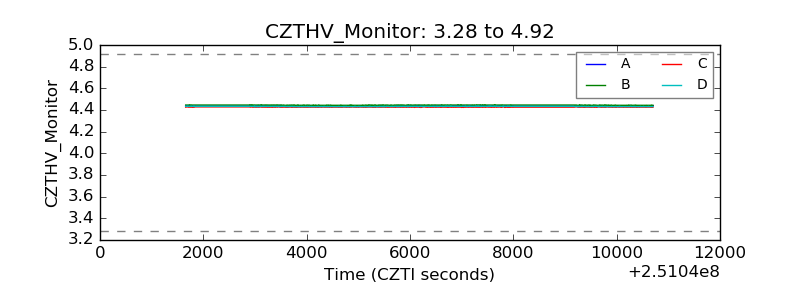 |
| D_VDD |  |
| Temperature 1 | 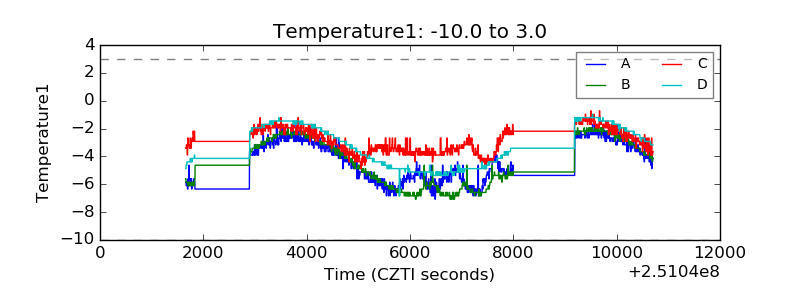 |
| Veto HV Monitor | 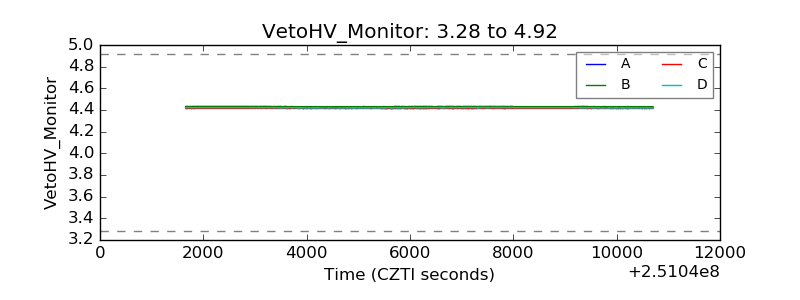 |
| Veto LLD | 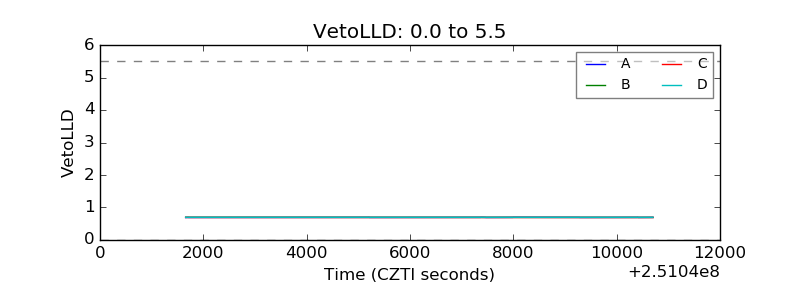 |
| Alpha Counter | 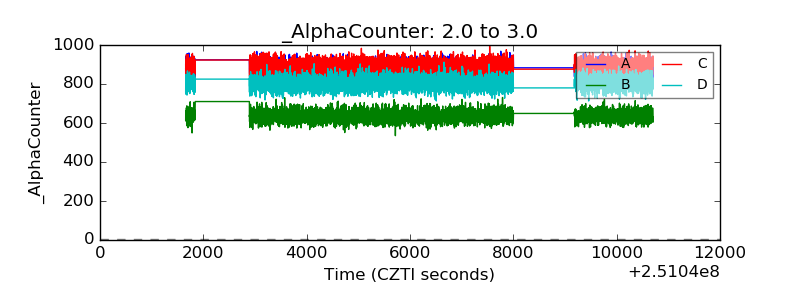 |
| _CPM_Rate | 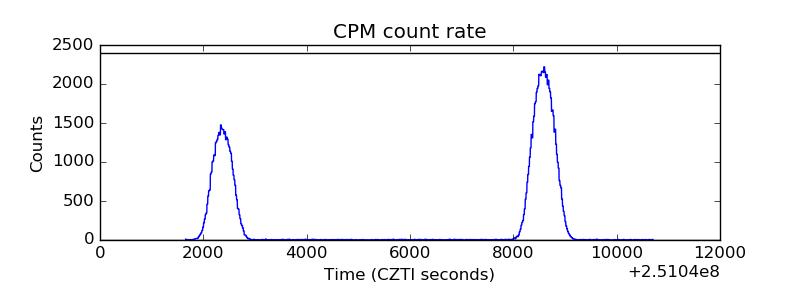 |
| CZT Counter | 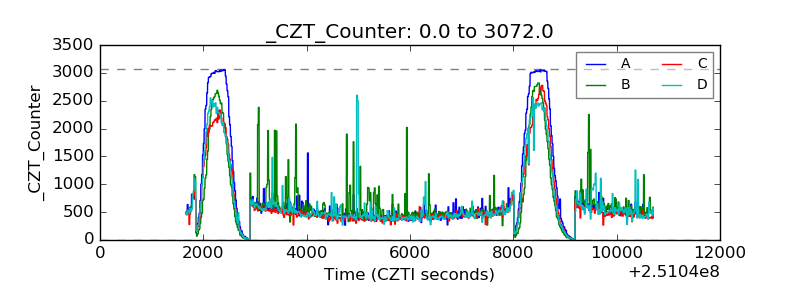 |
| +2.5 Volts monitor |  |
| +5 Volts monitor |  |
| _ROLL_ROT | 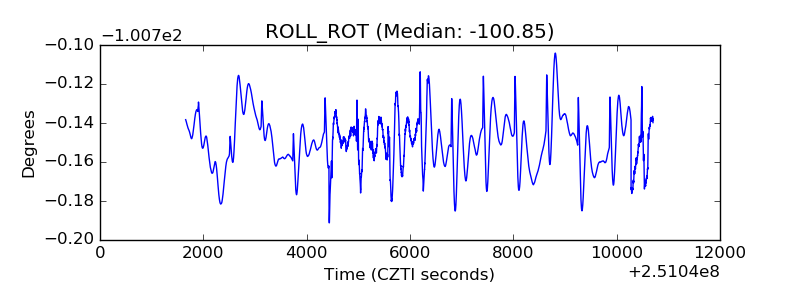 |
| _Roll_DEC | 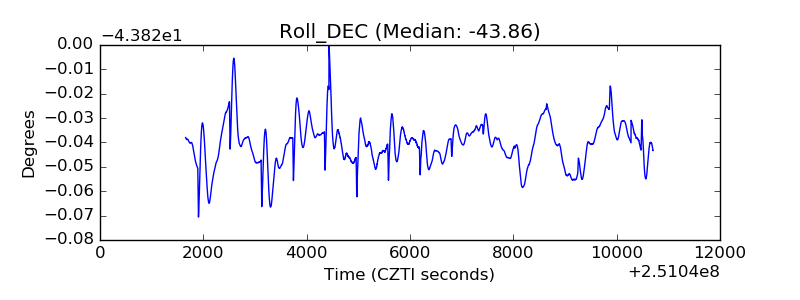 |
| _Roll_RA | 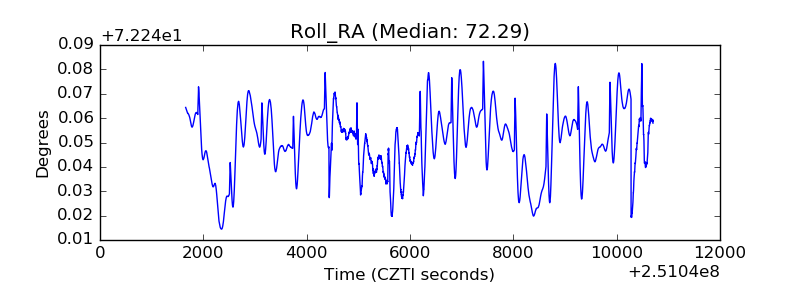 |
| Veto Counter | 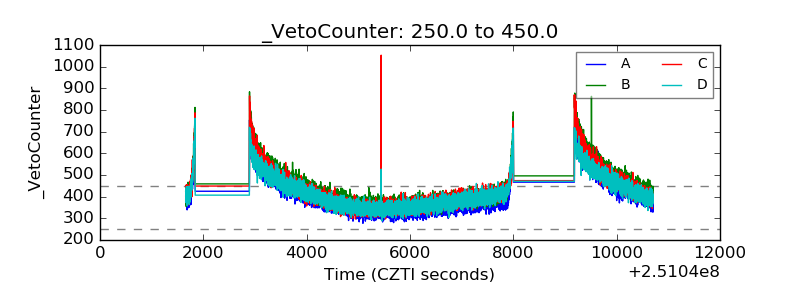 |