| Param | Original file | Final file |
|---|---|---|
| Filename | modeM0/AS1A04_082T01_9000001772_11983cztM0_level2.evt | modeM0/AS1A04_082T01_9000001772_11983cztM0_level2_quad_clean.evt |
| Size (bytes) | 459,956,160 | 110,554,560 |
| Size | 438.6 MB | 105.4 MB |
| Events in quadrant A | 3,389,214 | 740,592 |
| Events in quadrant B | 3,857,799 | 746,574 |
| Events in quadrant C | 2,977,568 | 718,459 |
| Events in quadrant D | 3,264,184 | 689,917 |
| Mode SS | |||
|---|---|---|---|
| Quadrant | BADHDUFLAG | Total packets | Discarded packets |
| A | 0 | 130 | 0 |
| B | 0 | 130 | 0 |
| C | 0 | 130 | 0 |
| D | 0 | 130 | 0 |
| Mode M0 | |||
|---|---|---|---|
| Quadrant | BADHDUFLAG | Total packets | Discarded packets |
| A | 0 | 14391 | 2 |
| B | 0 | 15727 | 1 |
| C | 0 | 13319 | 1 |
| D | 0 | 14043 | 1 |
| Mode M9 | |||
|---|---|---|---|
| Quadrant | BADHDUFLAG | Total packets | Discarded packets |
| A | 0 | 13 | 0 |
| B | 0 | 13 | 0 |
| C | 0 | 13 | 0 |
| D | 0 | 13 | 0 |
| Quadrant | Total seconds | Saturated seconds | Saturation percentage |
|---|---|---|---|
| A | 6499 | 86 | 1.323281% |
| B | 6499 | 174 | 2.677335% |
| C | 6499 | 31 | 0.476996% |
| D | 6499 | 44 | 0.677027% |
Noise dominated data is calculated using 1-second bins in cleaned event files. If a bin has >2000 counts, and if more than 50% of those come from <1% of pixels, then it is considered to be noise-dominated and hence unusable.
| Quadrant | # 1 sec bins | Bins with >0 counts | Bins with >2000 counts | High rate bins dominated by noise | Noise dominated (total time) | Noise dominated (detector-on time) | Marked lightcurve |
|---|---|---|---|---|---|---|---|
| A | 7740 | 6500 | 5 | 5 | 0.06% | 0.08% | 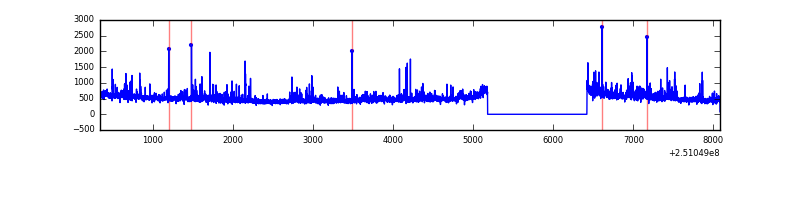 |
| B | 7740 | 6500 | 84 | 84 | 1.09% | 1.29% | 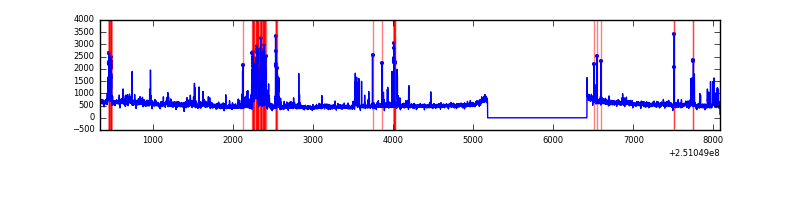 |
| C | 7740 | 6500 | 0 | 0 | 0.00% | 0.00% | 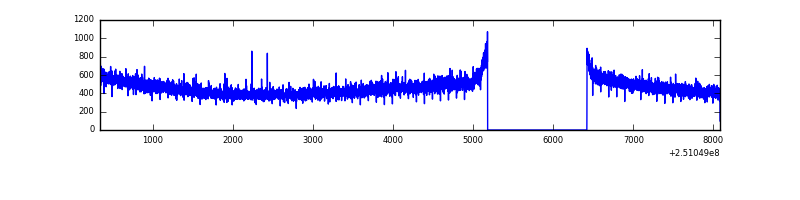 |
| D | 7740 | 6500 | 12 | 12 | 0.16% | 0.18% | 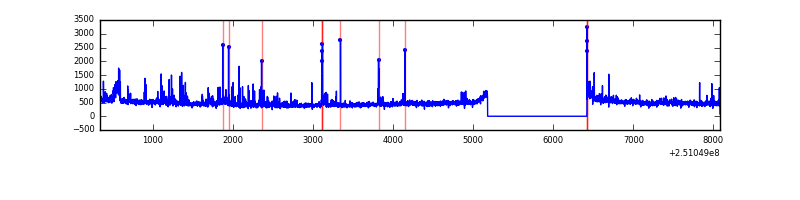 |
Top three noisy pixels from each quadrant. If the there are fewer than three noisy pixels in the level2.evt file, extra rows are filled as -1
| Pixel properties | Quadrant properties | ||||||
|---|---|---|---|---|---|---|---|
| Quadrant | DetID | PixID | Counts | Sigma | Mean | Median | Sigma |
| A | 1 | 162 | 117616 | 727.05 | 799 | 784 | 160.7 |
| A | 1 | 178 | 58291 | 357.87 | 799 | 784 | 160.7 |
| A | 1 | 161 | 51738 | 317.09 | 799 | 784 | 160.7 |
| B | 4 | 239 | 415027 | 2739.63 | 801 | 783 | 151.2 |
| B | 15 | 204 | 139293 | 916.05 | 801 | 783 | 151.2 |
| B | 3 | 64 | 100826 | 661.64 | 801 | 783 | 151.2 |
| C | 13 | 61 | 5757 | 28.33 | 762 | 766 | 176.2 |
| C | 8 | 208 | 3879 | 17.67 | 762 | 766 | 176.2 |
| C | 14 | 234 | 2834 | 11.74 | 762 | 766 | 176.2 |
| D | 8 | 195 | 112631 | 626.2 | 753 | 730 | 178.7 |
| D | 2 | 136 | 52413 | 289.22 | 753 | 730 | 178.7 |
| D | 7 | 80 | 47616 | 262.37 | 753 | 730 | 178.7 |
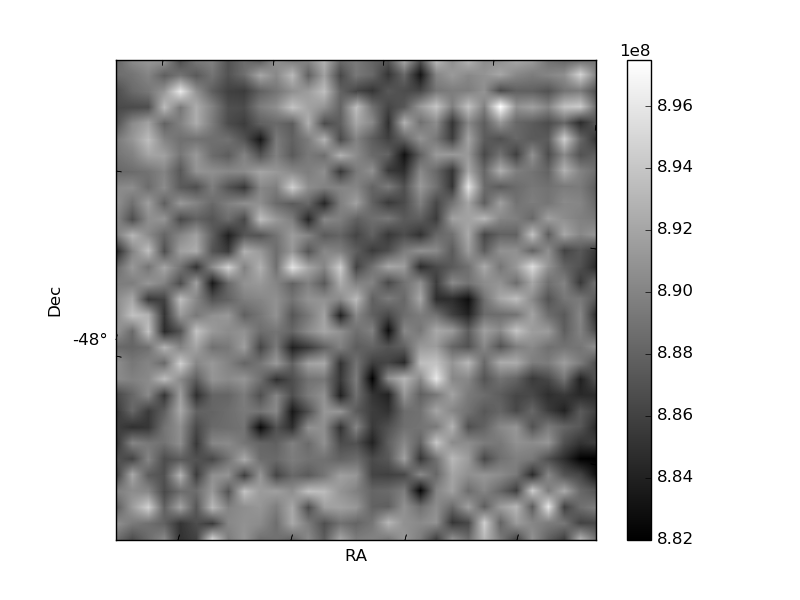
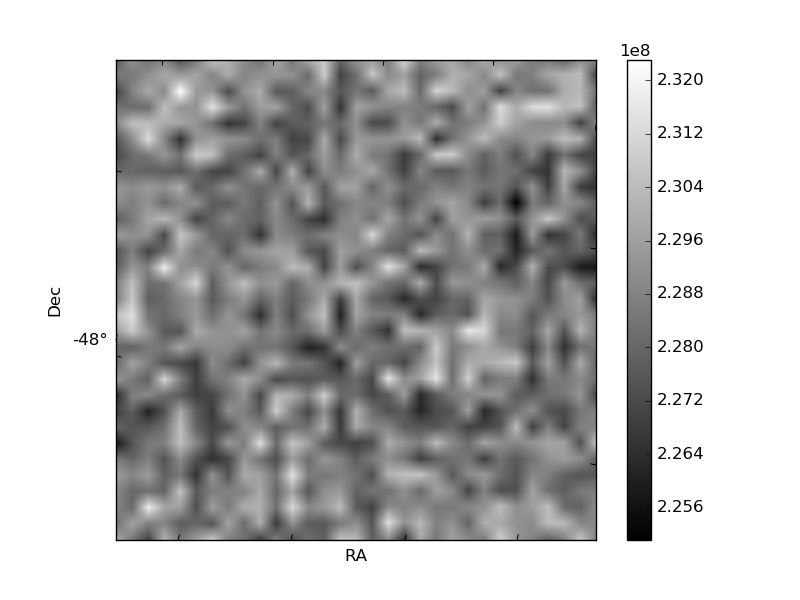
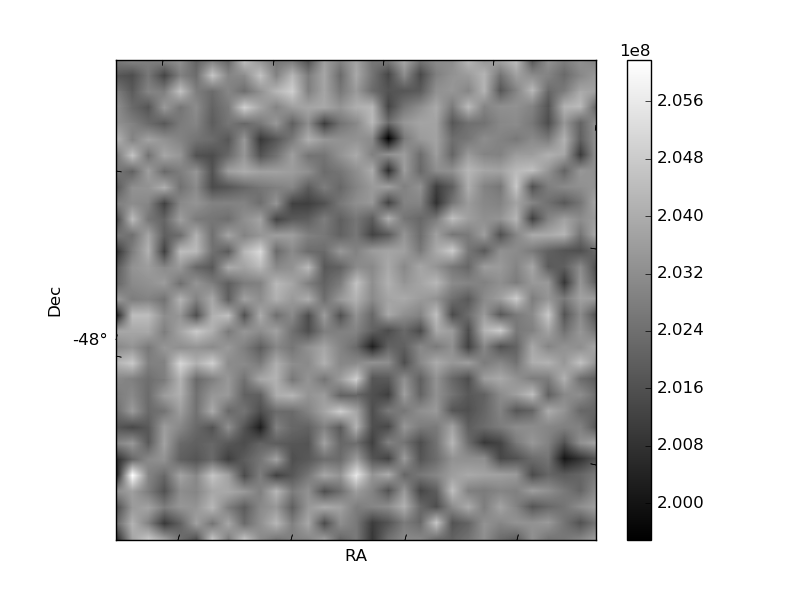
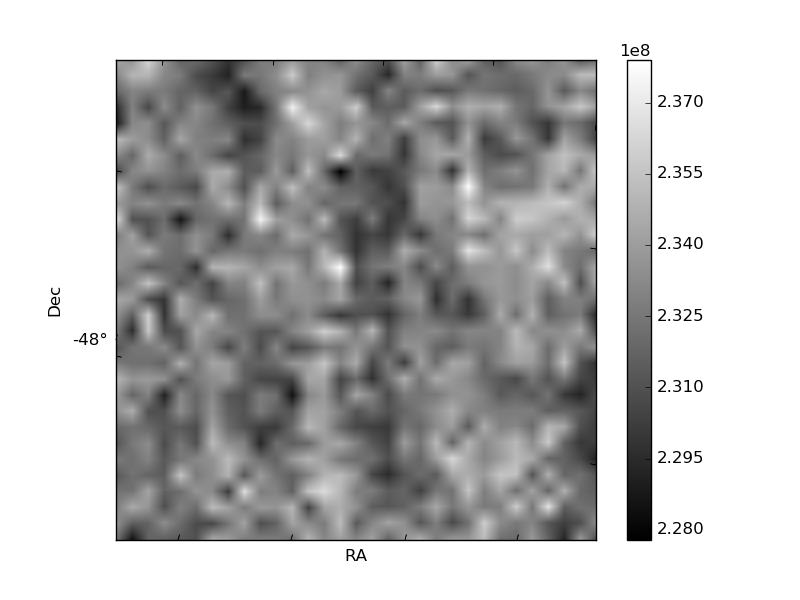
Histogram calculated using DETX and DETY for each event in the final _common_clean file
| Quadrant A | 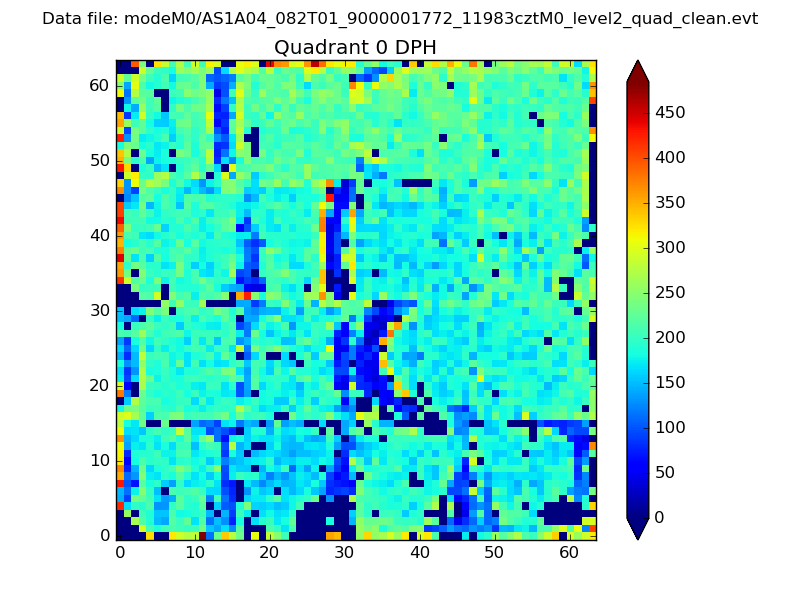 |
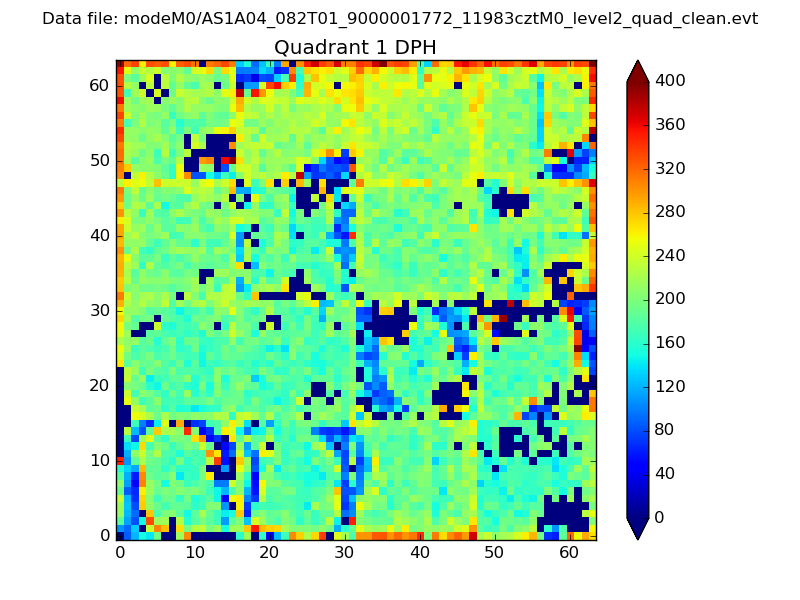 |
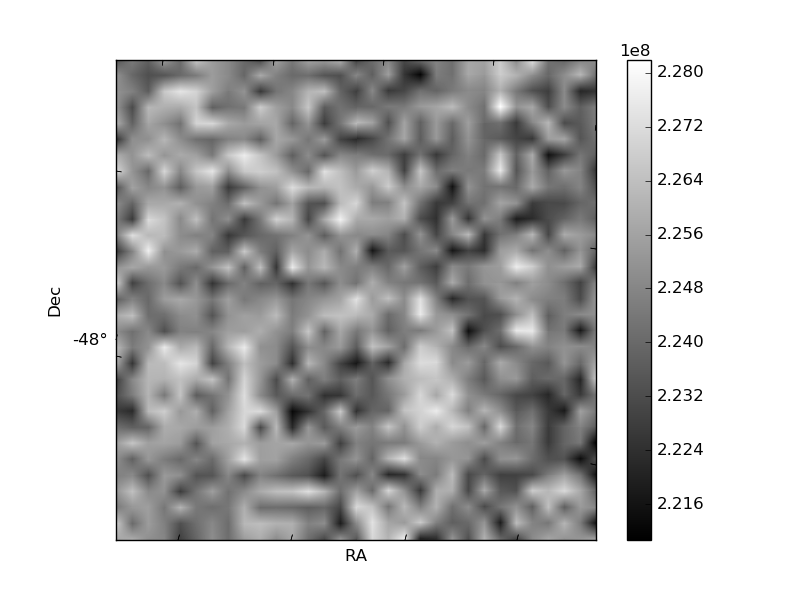
Quadrant B |
|---|---|---|---|
| Quadrant D | 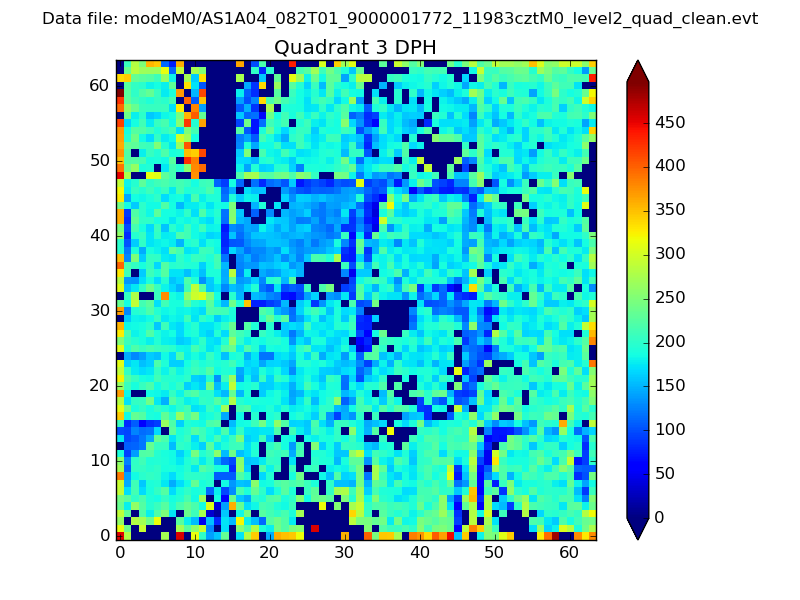 |
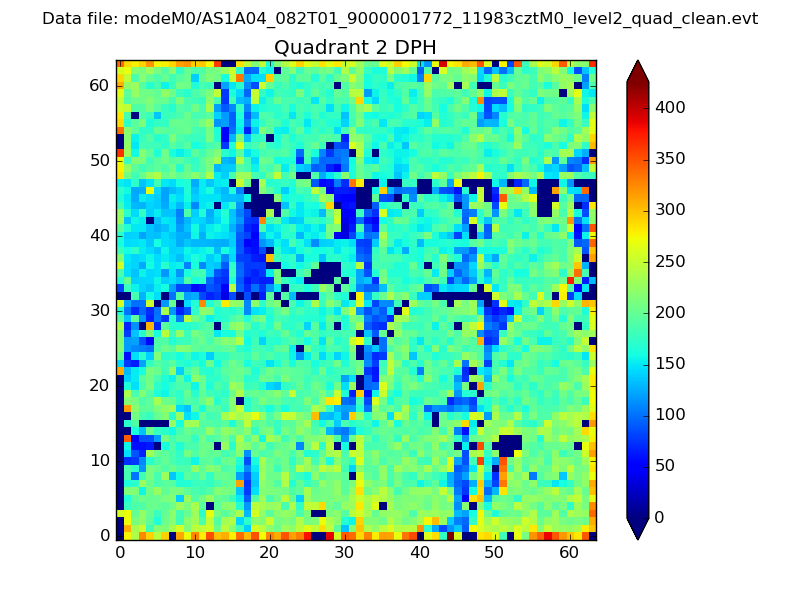 |
Quadrant C |
| Plot type | Count rate plots | Images |
|---|---|---|
| Comparison with Poisson distribution Blue bars denote a histogram of data divided into 1 sec bins. Red curve is a Poisson curve with rate = median count rate of data. |
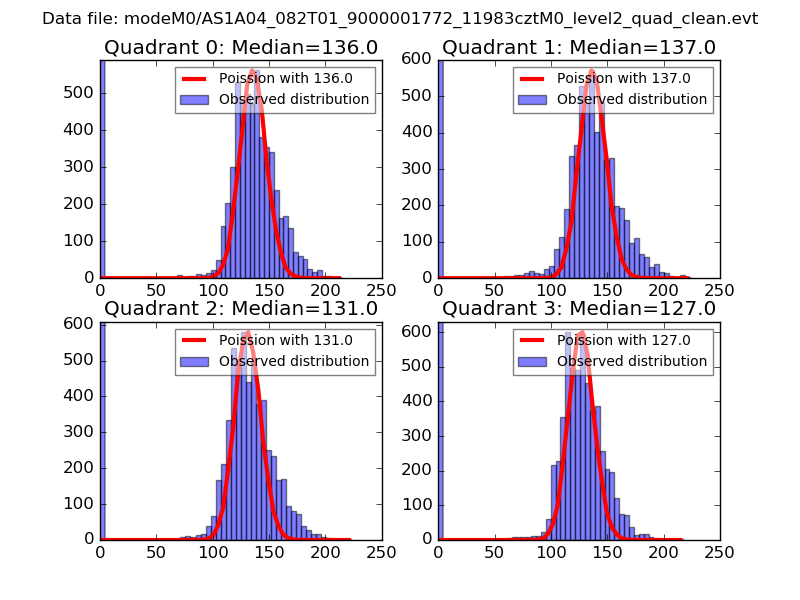 |
 |
| Quadrant-wise count rates Data is divided into 100 sec bins |
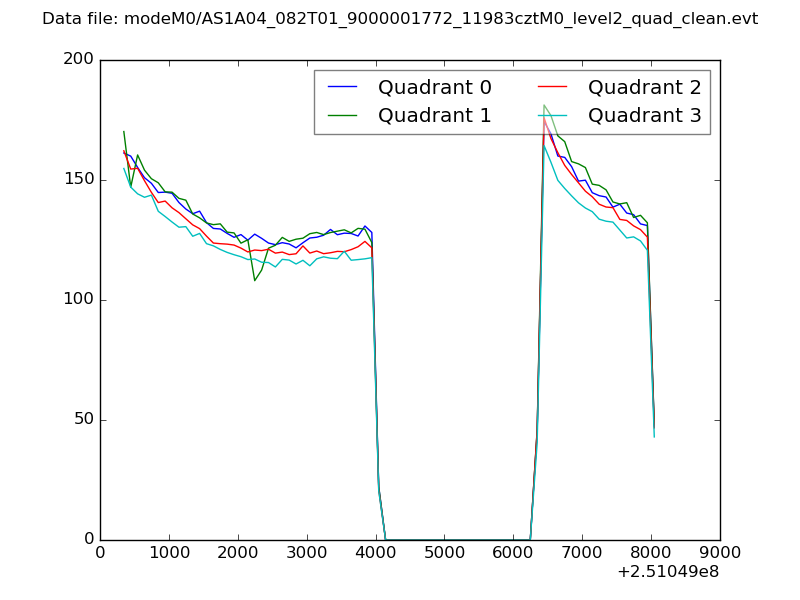 |
|
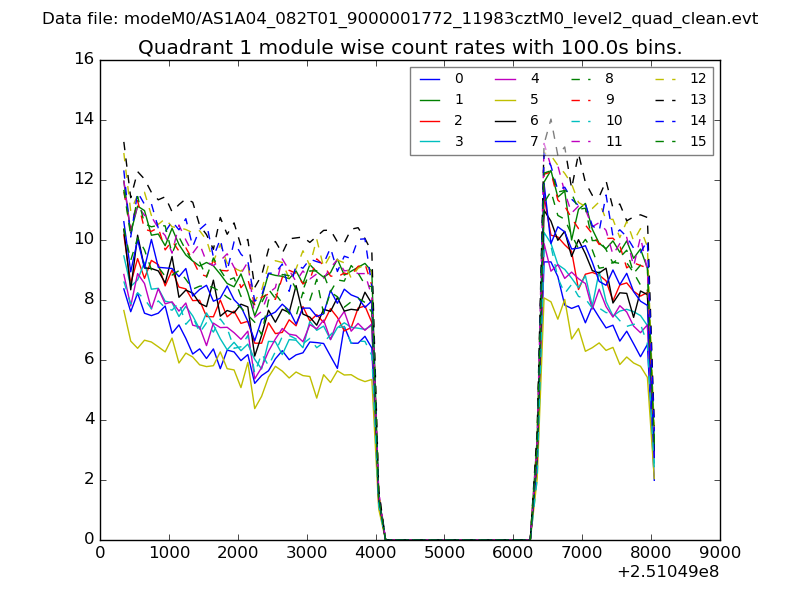
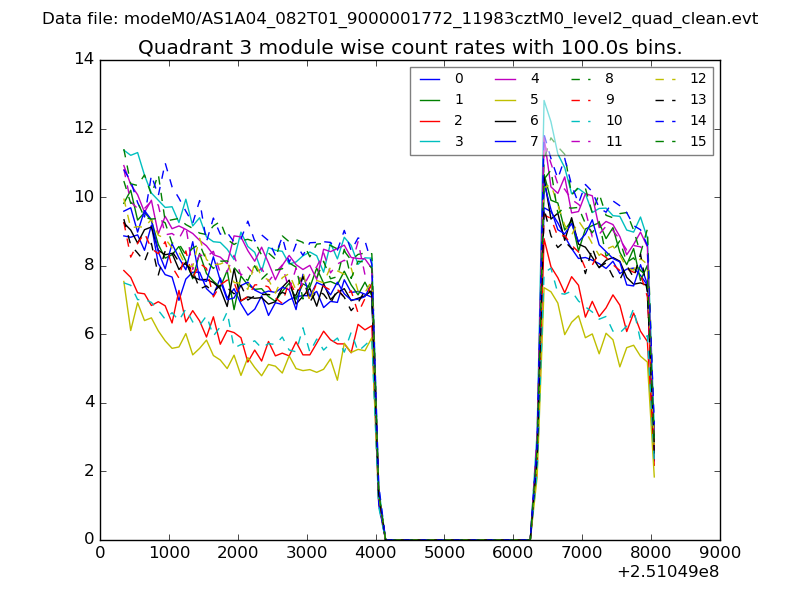
| Module-wise count rates for Quadrant A Data is divided into 100 sec bins |
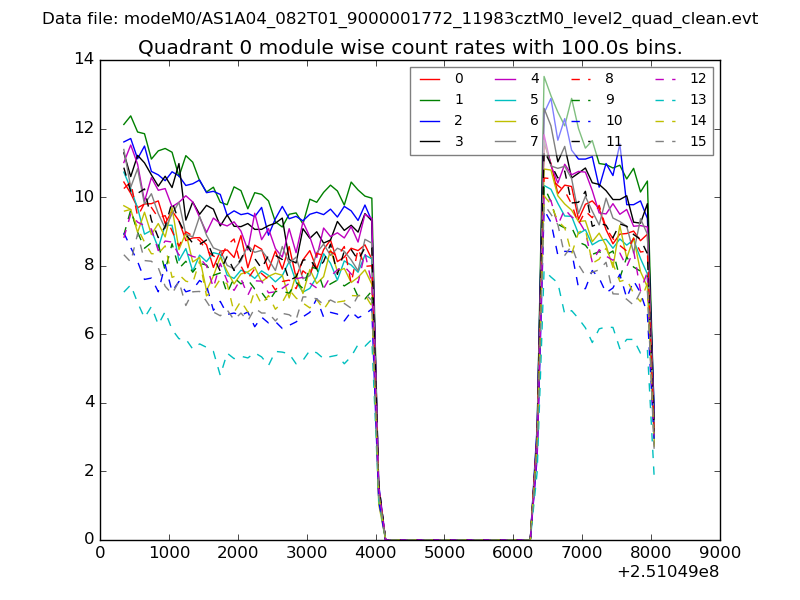 |
 |
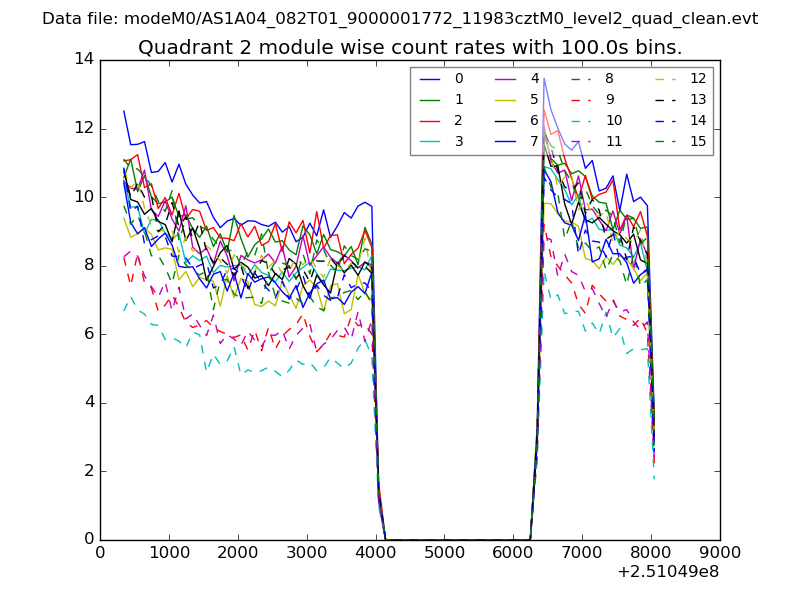
| Module-wise count rates for Quadrant B Data is divided into 100 sec bins |
 |
 |
| Module-wise count rates for Quadrant C Data is divided into 100 sec bins |
 |
 |
| Module-wise count rates for Quadrant D Data is divided into 100 sec bins |
 |
 |
| Parameter | Plot |
|---|---|
| CZT HV Monitor | 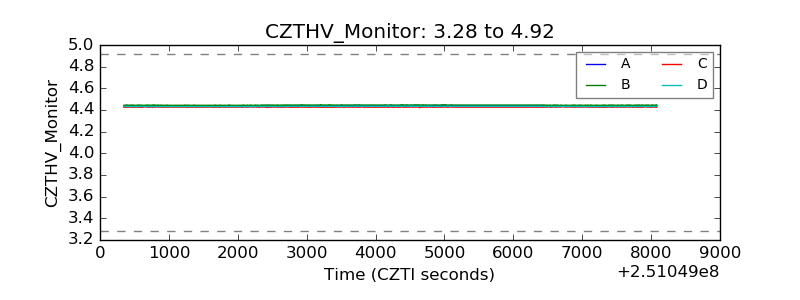 |
| D_VDD | 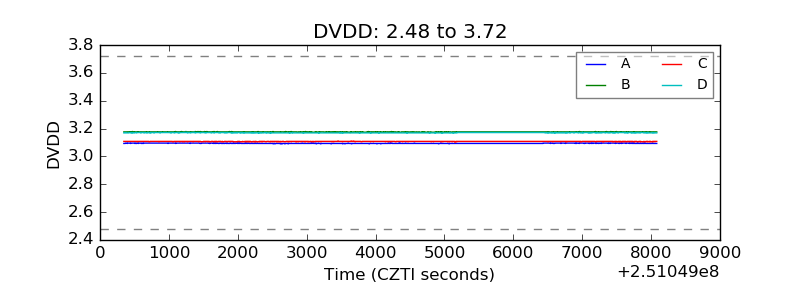 |
| Temperature 1 | 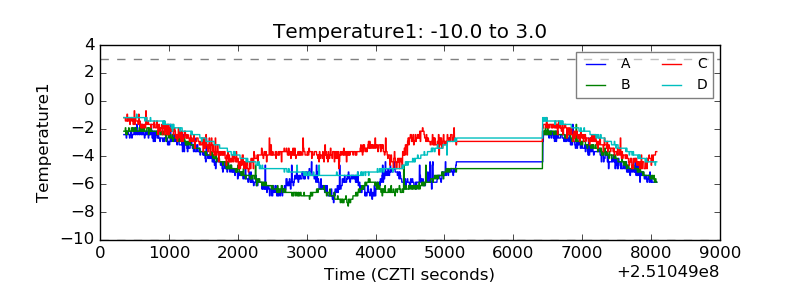 |
| Veto HV Monitor | 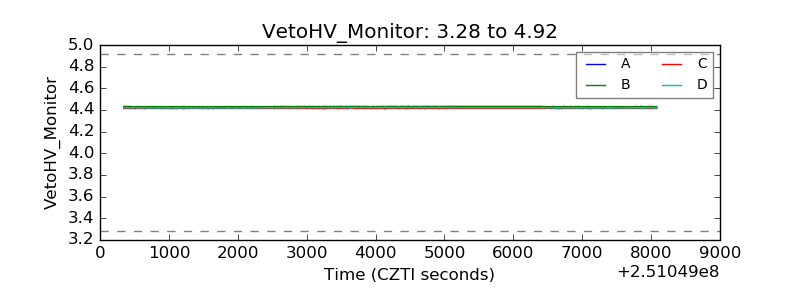 |
| Veto LLD | 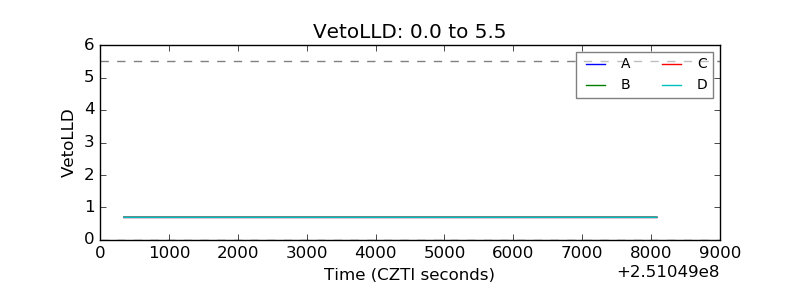 |
| Alpha Counter | 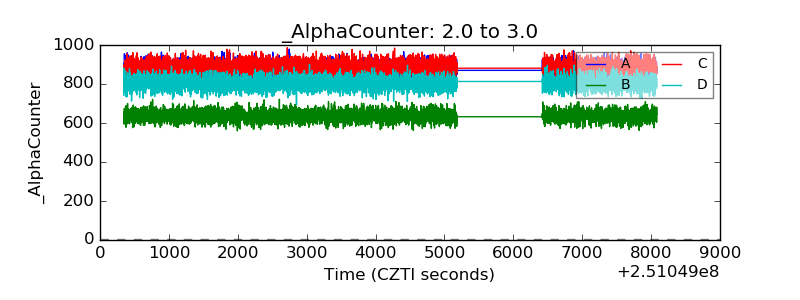 |
| _CPM_Rate | 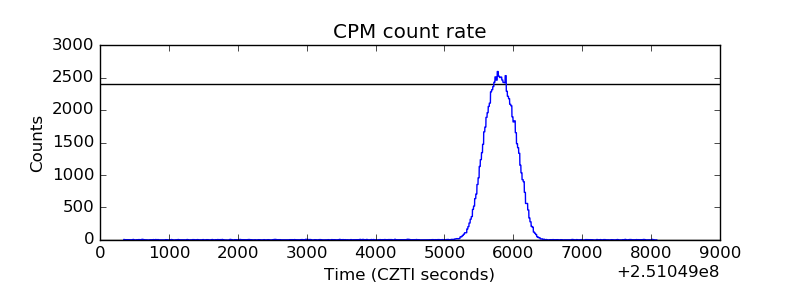 |
| CZT Counter | 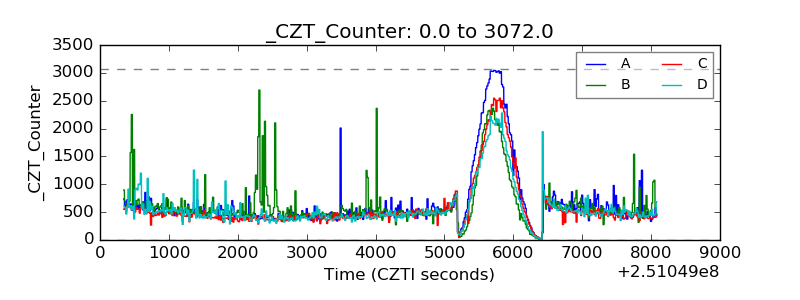 |
| +2.5 Volts monitor |  |
| +5 Volts monitor | 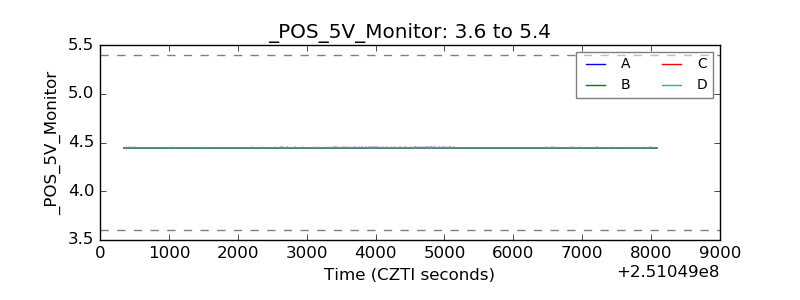 |
| _ROLL_ROT | 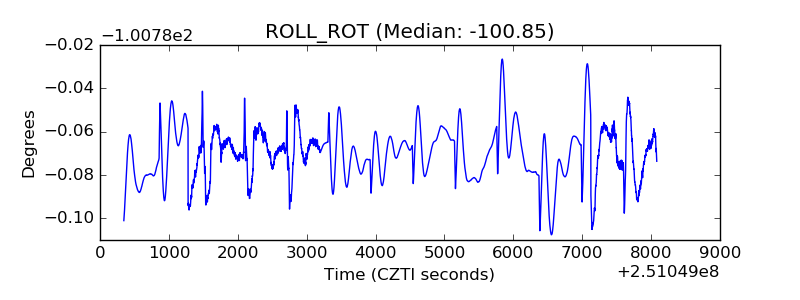 |
| _Roll_DEC | 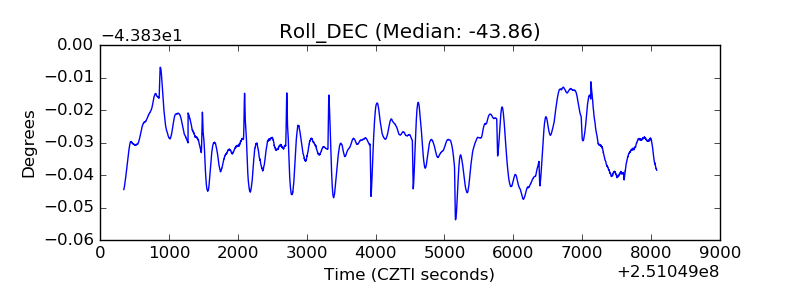 |
| _Roll_RA | 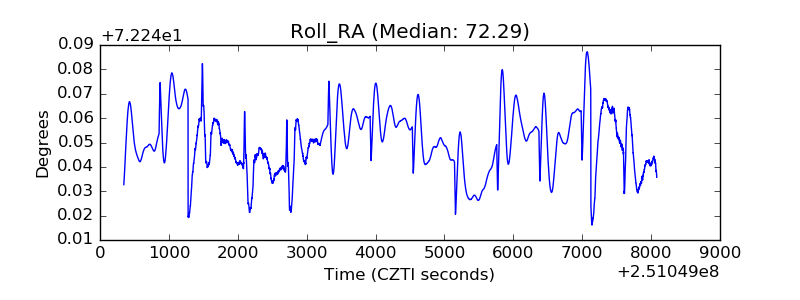 |
| Veto Counter | 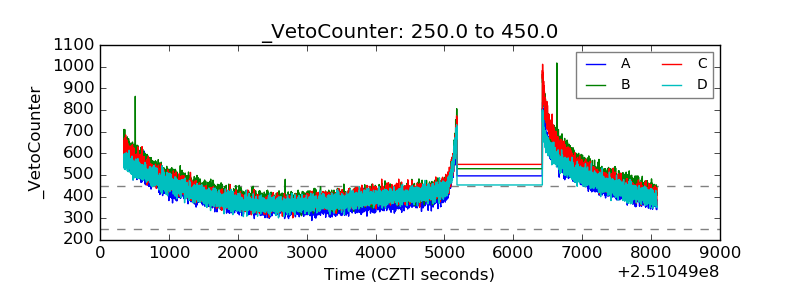 |