| Param | Original file | Final file |
|---|---|---|
| Filename | modeM0/AS1A04_082T01_9000001772_11985cztM0_level2.evt | modeM0/AS1A04_082T01_9000001772_11985cztM0_level2_quad_clean.evt |
| Size (bytes) | 461,949,120 | 93,879,360 |
| Size | 440.5 MB | 89.5 MB |
| Events in quadrant A | 3,418,783 | 610,034 |
| Events in quadrant B | 3,828,247 | 616,507 |
| Events in quadrant C | 2,939,287 | 601,016 |
| Events in quadrant D | 3,367,752 | 567,624 |
| Mode SS | |||
|---|---|---|---|
| Quadrant | BADHDUFLAG | Total packets | Discarded packets |
| A | 0 | 132 | 0 |
| B | 0 | 132 | 0 |
| C | 0 | 132 | 0 |
| D | 0 | 132 | 0 |
| Mode M0 | |||
|---|---|---|---|
| Quadrant | BADHDUFLAG | Total packets | Discarded packets |
| A | 0 | 14486 | 3 |
| B | 0 | 15574 | 2 |
| C | 0 | 13200 | 2 |
| D | 0 | 14179 | 2 |
| Mode M9 | |||
|---|---|---|---|
| Quadrant | BADHDUFLAG | Total packets | Discarded packets |
| A | 0 | 27 | 0 |
| B | 0 | 27 | 0 |
| C | 0 | 27 | 0 |
| D | 0 | 27 | 0 |
| Quadrant | Total seconds | Saturated seconds | Saturation percentage |
|---|---|---|---|
| A | 6420 | 82 | 1.277259% |
| B | 6420 | 252 | 3.925234% |
| C | 6420 | 13 | 0.202492% |
| D | 6420 | 26 | 0.404984% |
Noise dominated data is calculated using 1-second bins in cleaned event files. If a bin has >2000 counts, and if more than 50% of those come from <1% of pixels, then it is considered to be noise-dominated and hence unusable.
| Quadrant | # 1 sec bins | Bins with >0 counts | Bins with >2000 counts | High rate bins dominated by noise | Noise dominated (total time) | Noise dominated (detector-on time) | Marked lightcurve |
|---|---|---|---|---|---|---|---|
| A | 9086 | 6422 | 2 | 2 | 0.02% | 0.03% | 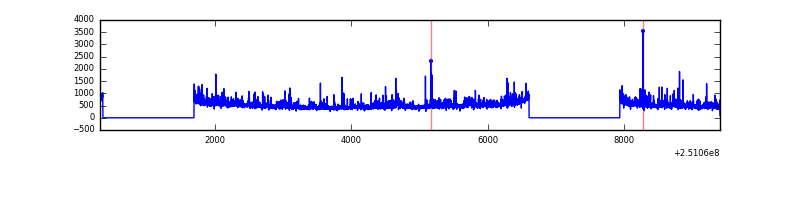 |
| B | 9086 | 6421 | 114 | 114 | 1.25% | 1.78% | 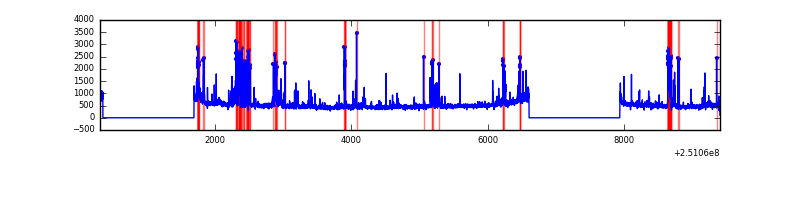 |
| C | 9086 | 6423 | 0 | 0 | 0.00% | 0.00% | 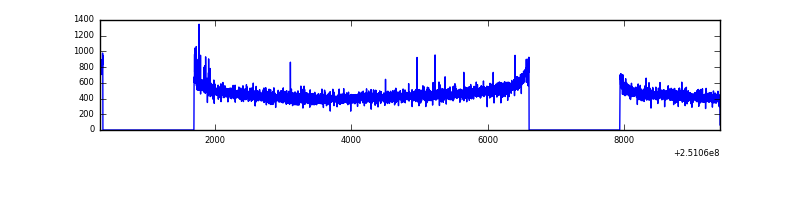 |
| D | 9086 | 6423 | 11 | 11 | 0.12% | 0.17% | 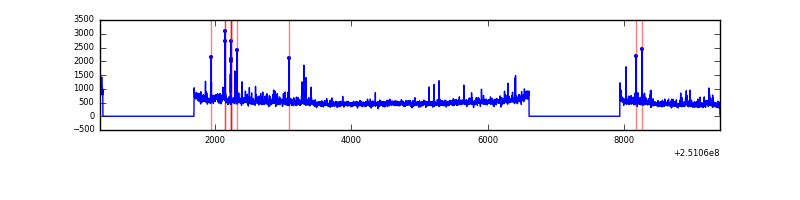 |
Top three noisy pixels from each quadrant. If the there are fewer than three noisy pixels in the level2.evt file, extra rows are filled as -1
| Pixel properties | Quadrant properties | ||||||
|---|---|---|---|---|---|---|---|
| Quadrant | DetID | PixID | Counts | Sigma | Mean | Median | Sigma |
| A | 1 | 162 | 161871 | 1028.93 | 773 | 759 | 156.6 |
| A | 1 | 178 | 88224 | 558.59 | 773 | 759 | 156.6 |
| A | 1 | 161 | 76509 | 483.77 | 773 | 759 | 156.6 |
| B | 4 | 239 | 614461 | 4199.61 | 777 | 760 | 146.1 |
| B | 3 | 64 | 64868 | 438.7 | 777 | 760 | 146.1 |
| B | 15 | 204 | 52223 | 352.17 | 777 | 760 | 146.1 |
| C | 1 | 16 | 11584 | 62.78 | 750 | 753 | 172.5 |
| C | 13 | 61 | 5533 | 27.71 | 750 | 753 | 172.5 |
| C | 8 | 208 | 3872 | 18.08 | 750 | 753 | 172.5 |
| D | 8 | 195 | 313254 | 1776.63 | 734 | 712 | 175.9 |
| D | 1 | 52 | 133821 | 756.65 | 734 | 712 | 175.9 |
| D | 9 | 85 | 38459 | 214.57 | 734 | 712 | 175.9 |
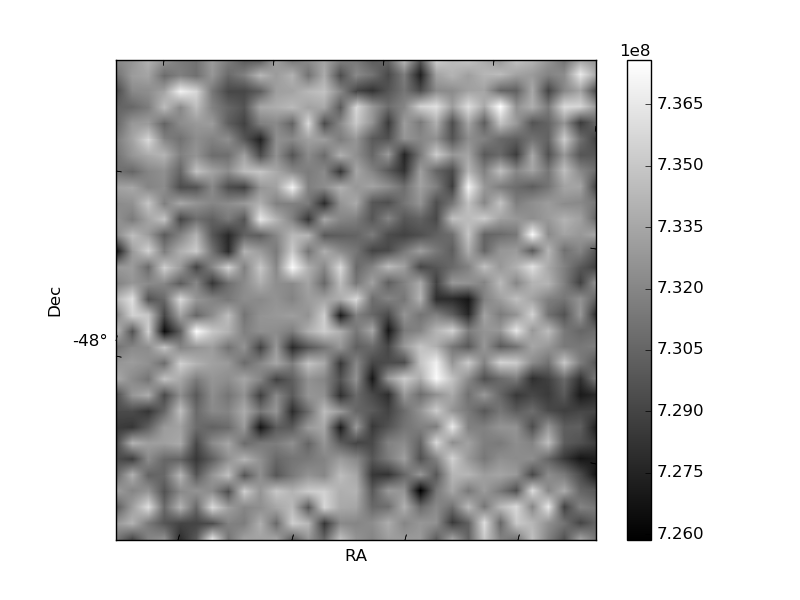
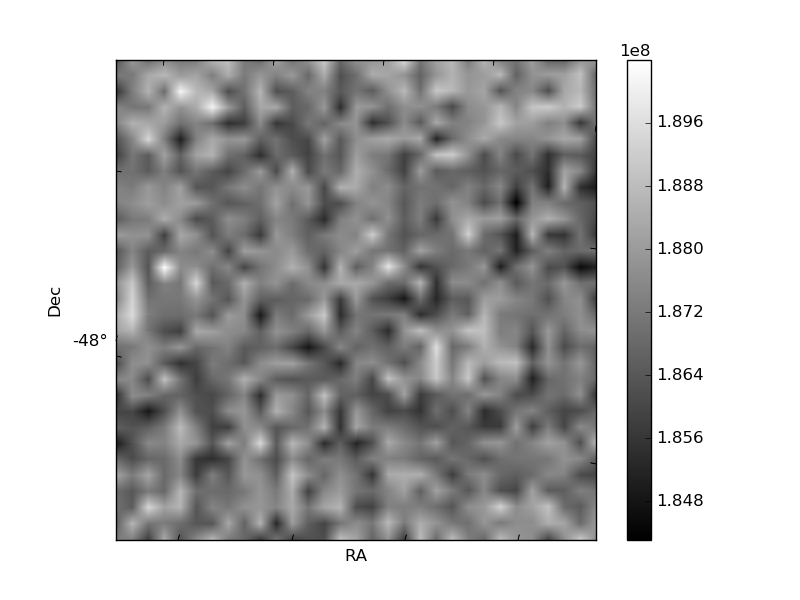
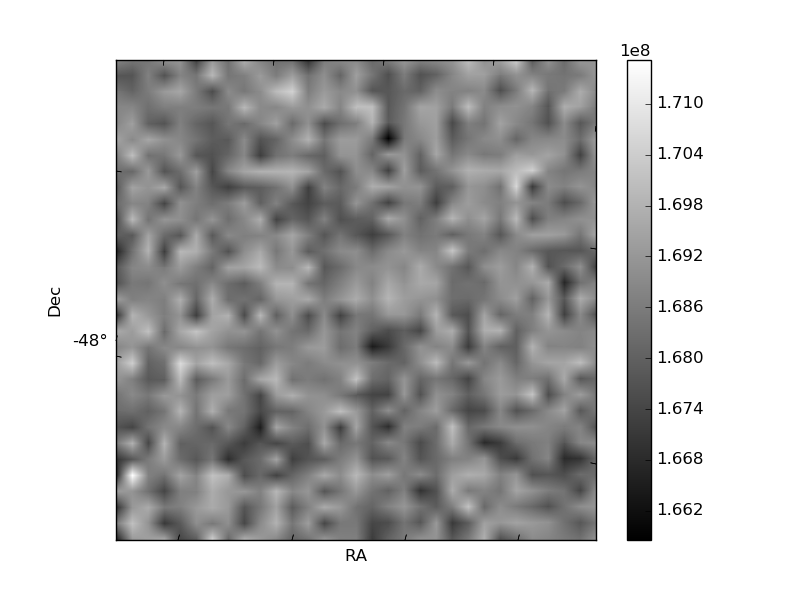
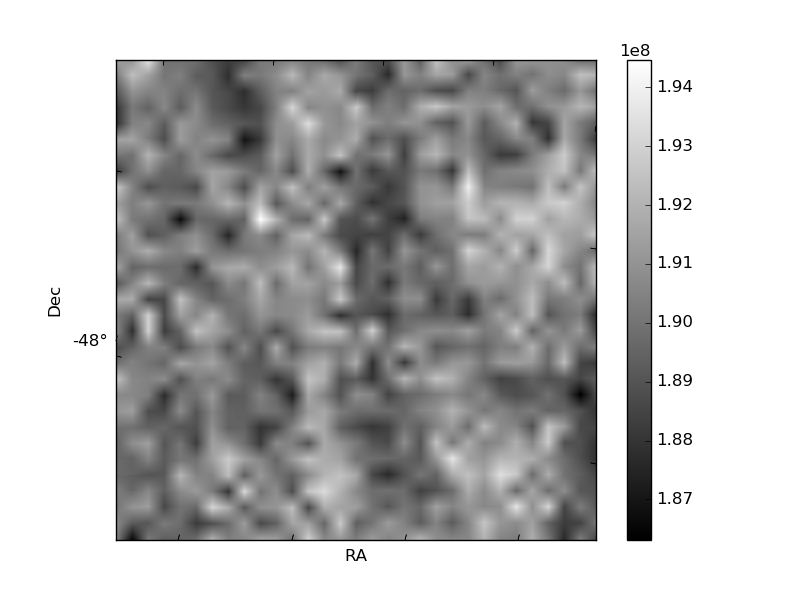
Histogram calculated using DETX and DETY for each event in the final _common_clean file
| Quadrant A | 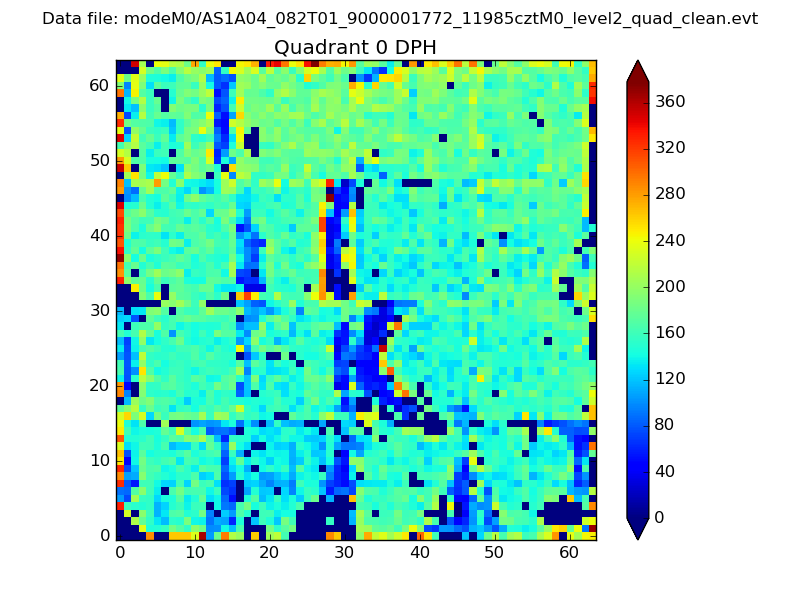 |
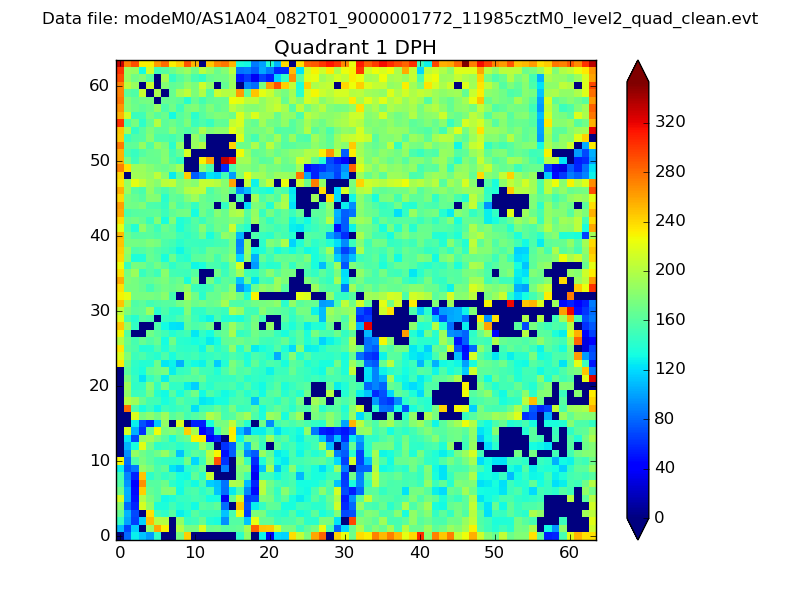 |
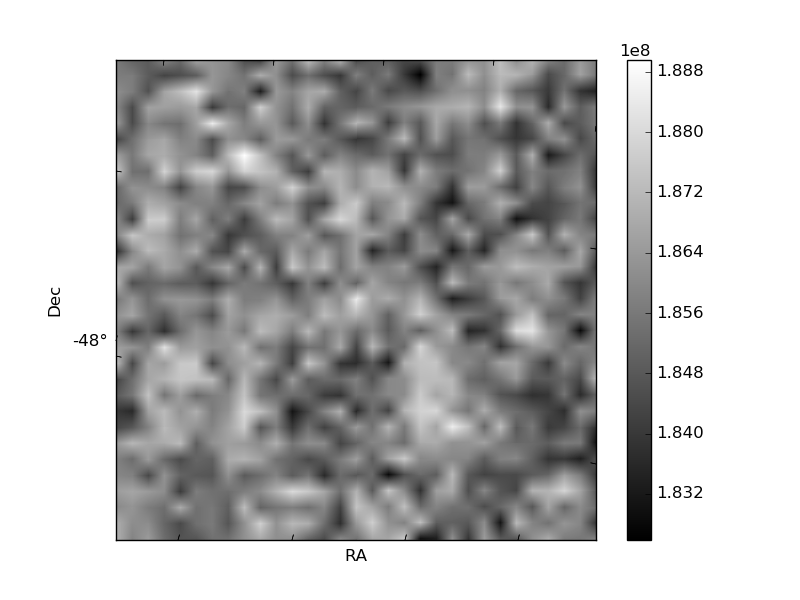
Quadrant B |
|---|---|---|---|
| Quadrant D | 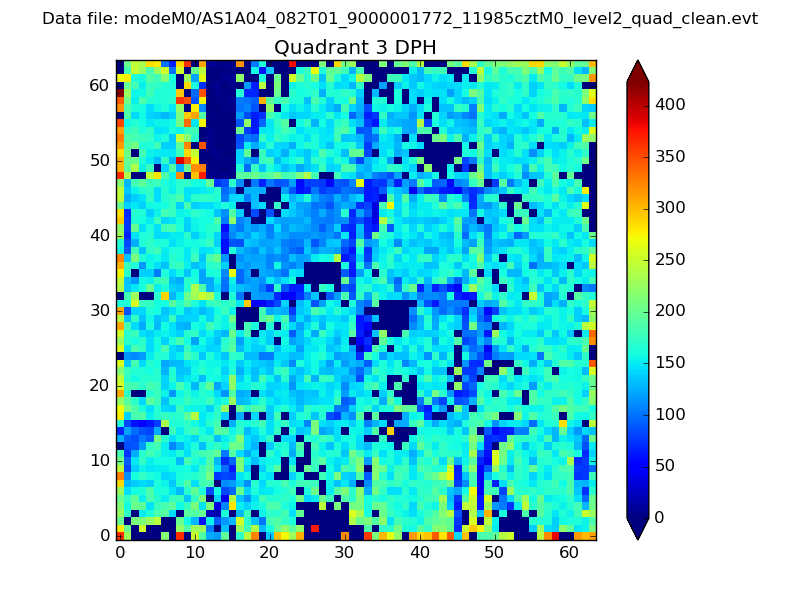 |
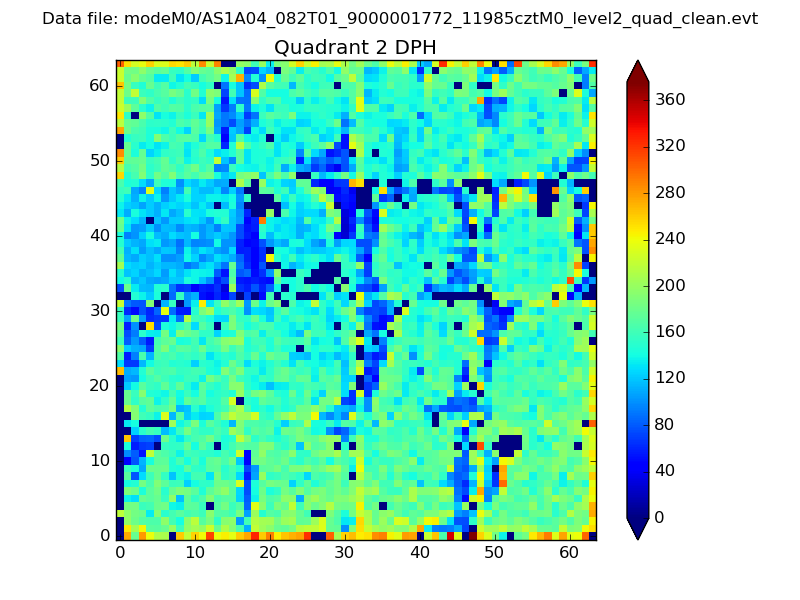 |
Quadrant C |
| Plot type | Count rate plots | Images |
|---|---|---|
| Comparison with Poisson distribution Blue bars denote a histogram of data divided into 1 sec bins. Red curve is a Poisson curve with rate = median count rate of data. |
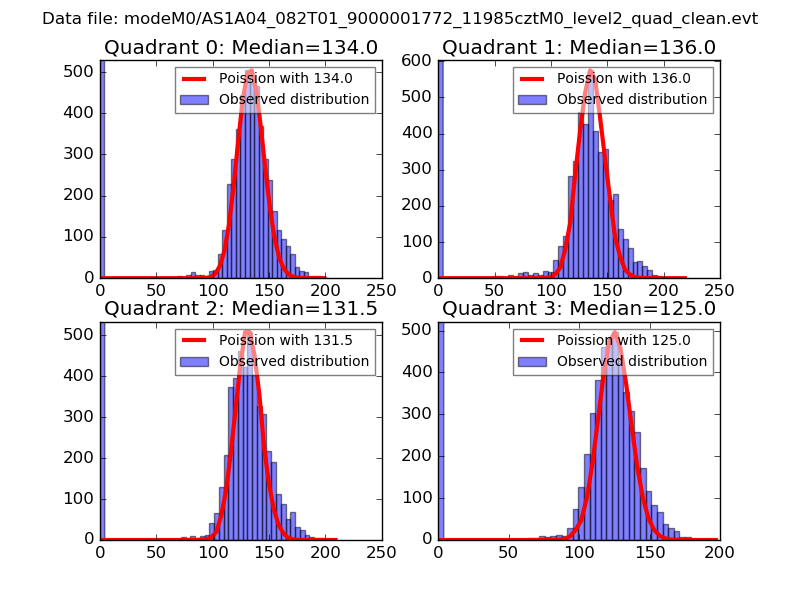 |
 |
| Quadrant-wise count rates Data is divided into 100 sec bins |
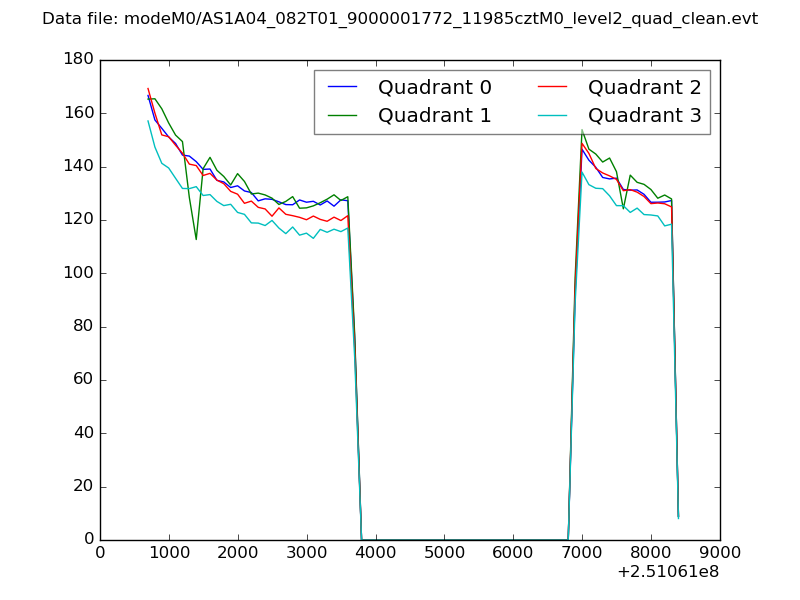 |
|
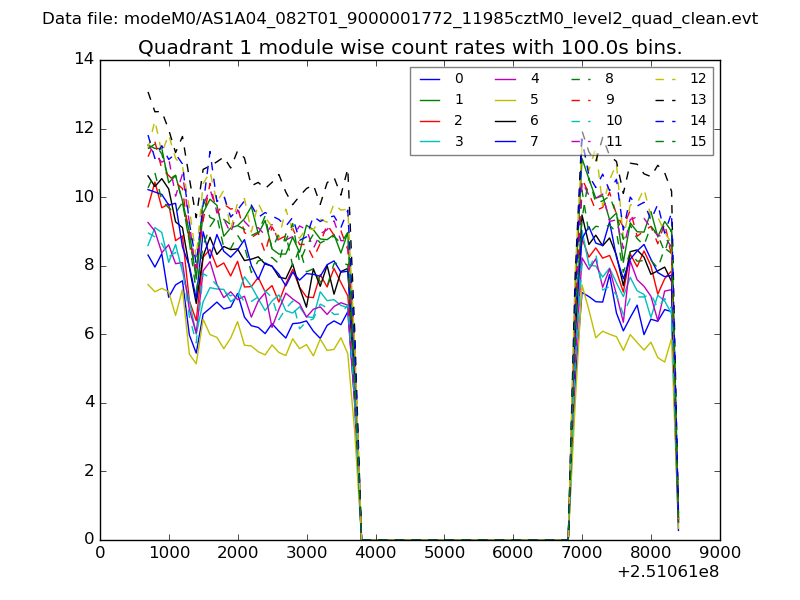
| Module-wise count rates for Quadrant A Data is divided into 100 sec bins |
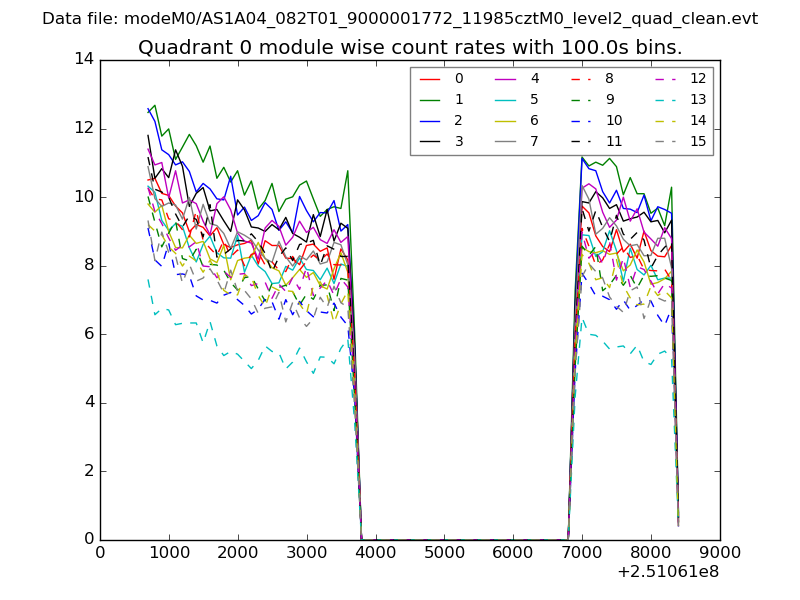 |
 |
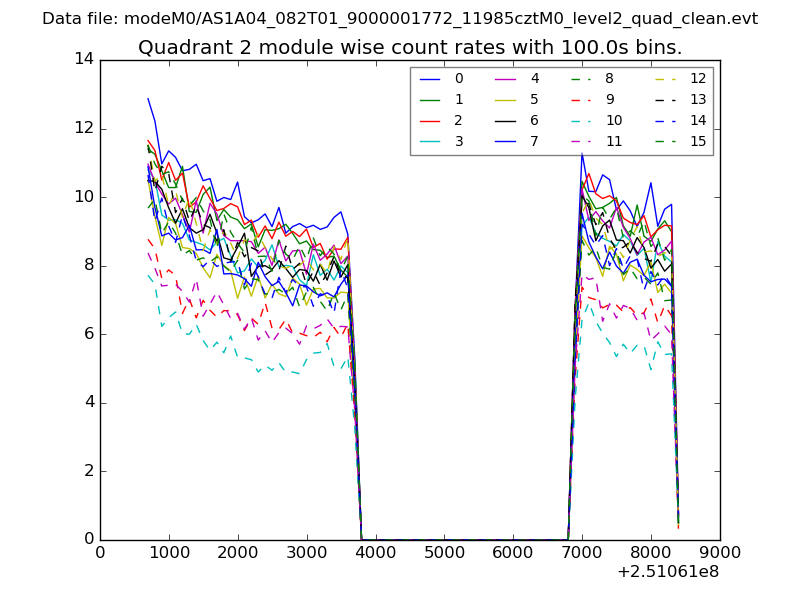
| Module-wise count rates for Quadrant B Data is divided into 100 sec bins |
 |
 |
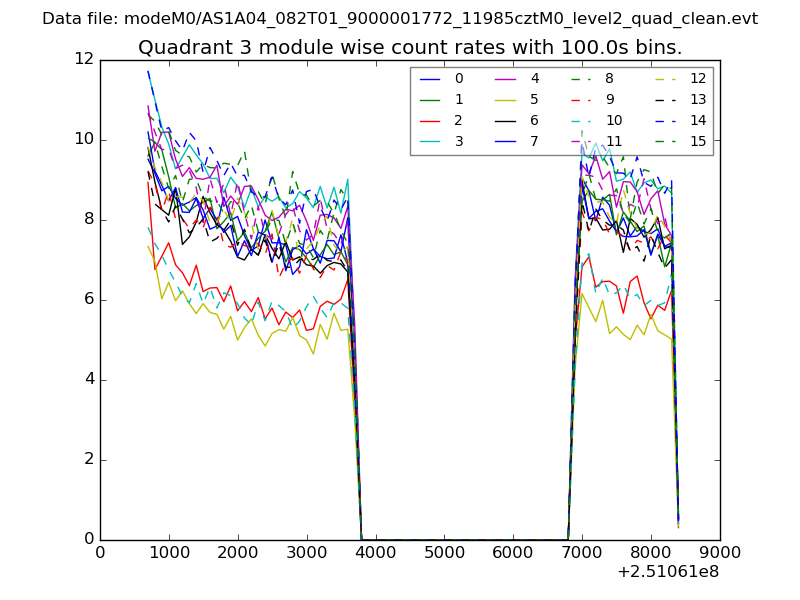
| Module-wise count rates for Quadrant C Data is divided into 100 sec bins |
 |
 |
| Module-wise count rates for Quadrant D Data is divided into 100 sec bins |
 |
 |
| Parameter | Plot |
|---|---|
| CZT HV Monitor | 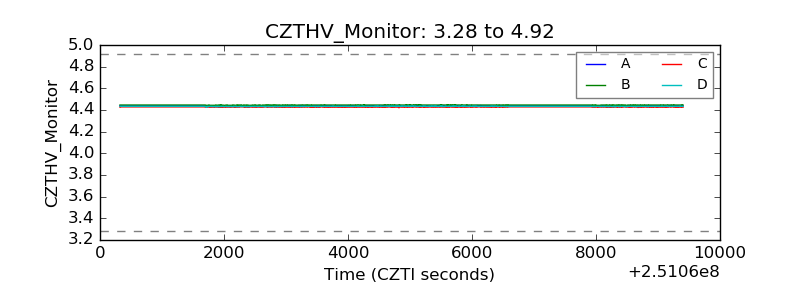 |
| D_VDD |  |
| Temperature 1 | 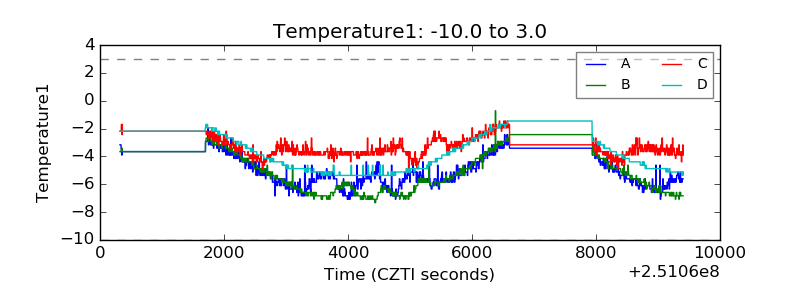 |
| Veto HV Monitor | 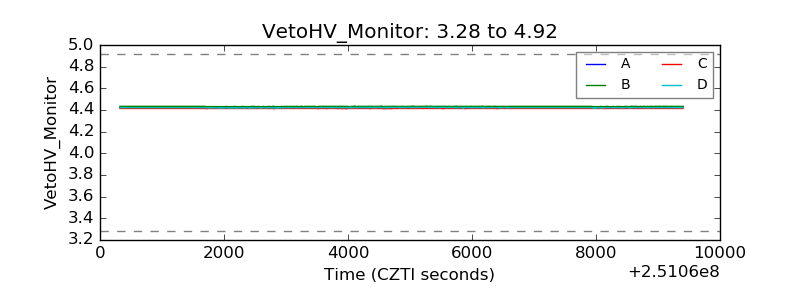 |
| Veto LLD | 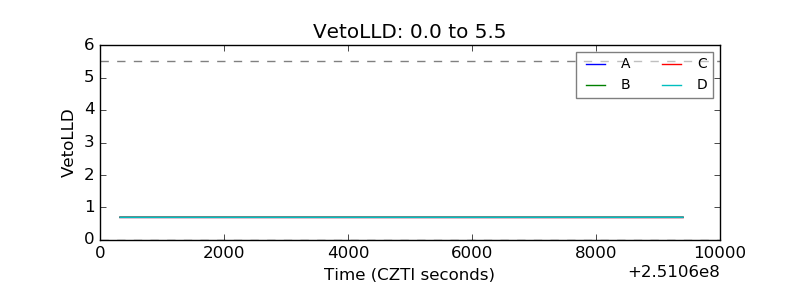 |
| Alpha Counter | 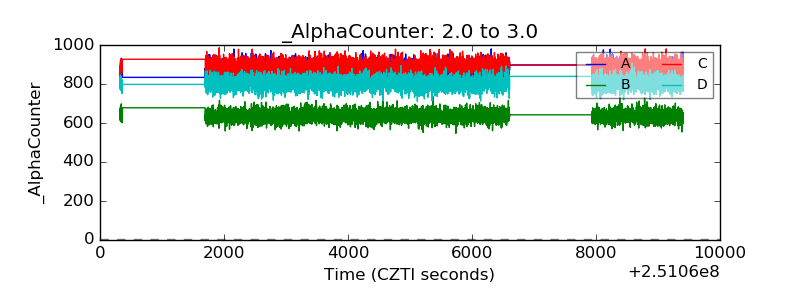 |
| _CPM_Rate | 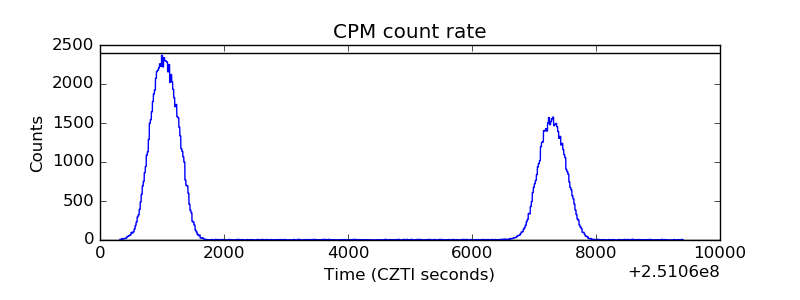 |
| CZT Counter | 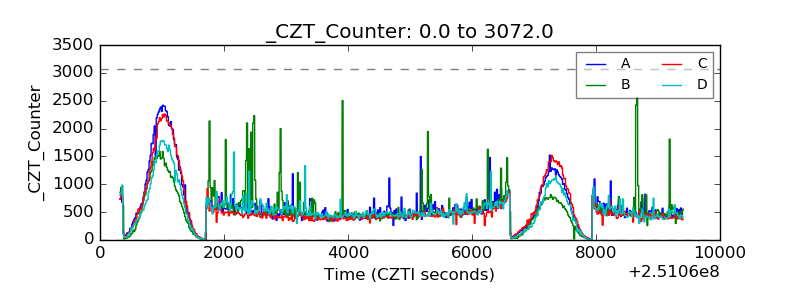 |
| +2.5 Volts monitor |  |
| +5 Volts monitor |  |
| _ROLL_ROT | 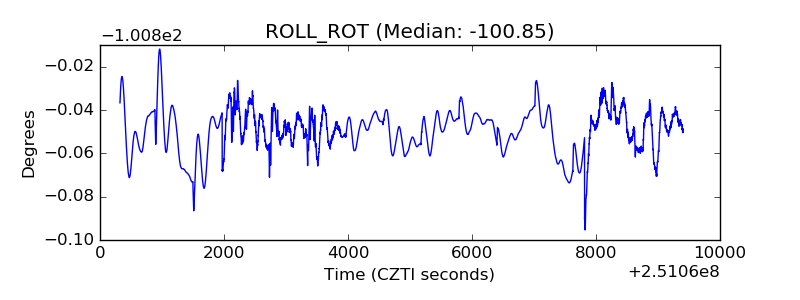 |
| _Roll_DEC | 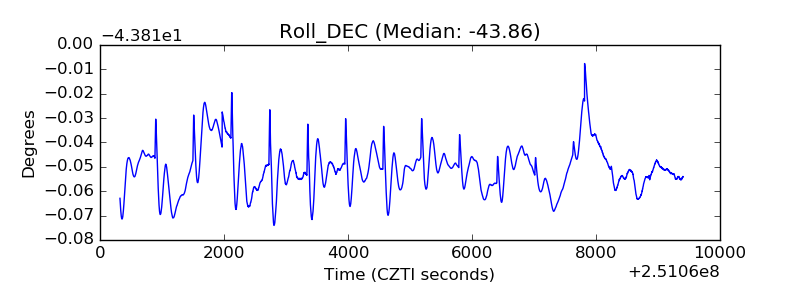 |
| _Roll_RA | 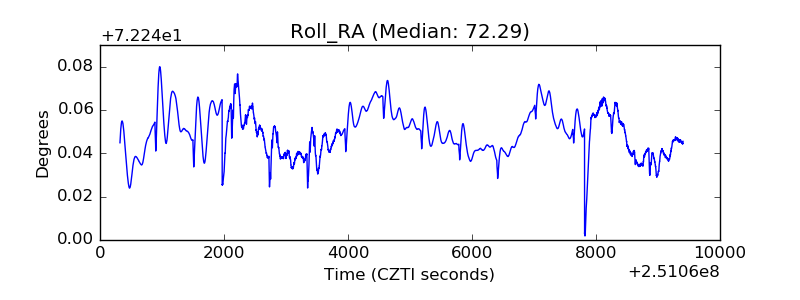 |
| Veto Counter | 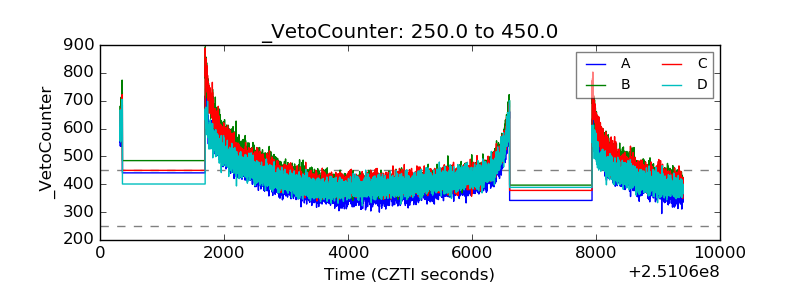 |