| Param | Original file | Final file |
|---|---|---|
| Filename | modeM0/AS1A04_082T01_9000001772_11986cztM0_level2.evt | modeM0/AS1A04_082T01_9000001772_11986cztM0_level2_quad_clean.evt |
| Size (bytes) | 526,253,760 | 93,067,200 |
| Size | 501.9 MB | 88.8 MB |
| Events in quadrant A | 3,402,928 | 600,074 |
| Events in quadrant B | 3,875,292 | 611,451 |
| Events in quadrant C | 2,953,511 | 598,133 |
| Events in quadrant D | 5,256,777 | 547,371 |
| Mode SS | |||
|---|---|---|---|
| Quadrant | BADHDUFLAG | Total packets | Discarded packets |
| A | 0 | 136 | 0 |
| B | 0 | 136 | 0 |
| C | 0 | 136 | 0 |
| D | 0 | 136 | 0 |
| Mode M0 | |||
|---|---|---|---|
| Quadrant | BADHDUFLAG | Total packets | Discarded packets |
| A | 0 | 14581 | 3 |
| B | 0 | 15943 | 2 |
| C | 0 | 13464 | 2 |
| D | 0 | 20393 | 2 |
| Mode M9 | |||
|---|---|---|---|
| Quadrant | BADHDUFLAG | Total packets | Discarded packets |
| A | 0 | 16 | 0 |
| B | 0 | 16 | 0 |
| C | 0 | 16 | 0 |
| D | 0 | 17 | 0 |
| Quadrant | Total seconds | Saturated seconds | Saturation percentage |
|---|---|---|---|
| A | 6608 | 55 | 0.832324% |
| B | 6608 | 217 | 3.283898% |
| C | 6608 | 6 | 0.090799% |
| D | 6608 | 988 | 14.951574% |
Noise dominated data is calculated using 1-second bins in cleaned event files. If a bin has >2000 counts, and if more than 50% of those come from <1% of pixels, then it is considered to be noise-dominated and hence unusable.
| Quadrant | # 1 sec bins | Bins with >0 counts | Bins with >2000 counts | High rate bins dominated by noise | Noise dominated (total time) | Noise dominated (detector-on time) | Marked lightcurve |
|---|---|---|---|---|---|---|---|
| A | 7764 | 6610 | 2 | 2 | 0.03% | 0.03% | 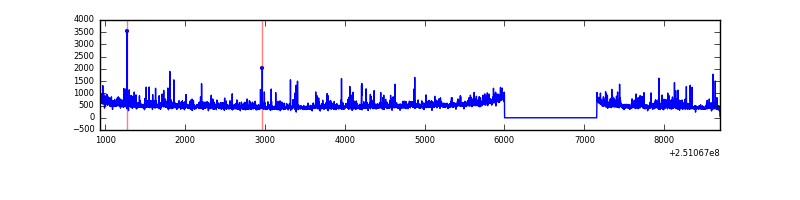 |
| B | 7764 | 6610 | 121 | 121 | 1.56% | 1.83% | 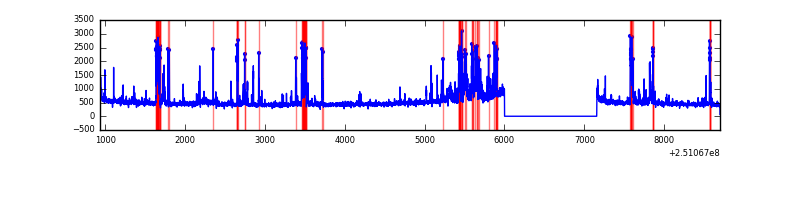 |
| C | 7764 | 6610 | 0 | 0 | 0.00% | 0.00% | 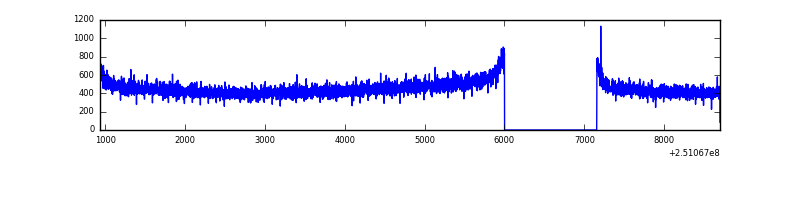 |
| D | 7764 | 6609 | 878 | 878 | 11.31% | 13.28% | 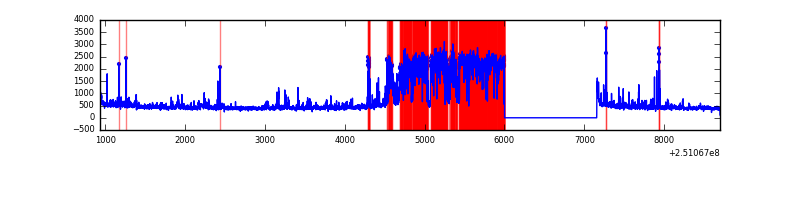 |
Top three noisy pixels from each quadrant. If the there are fewer than three noisy pixels in the level2.evt file, extra rows are filled as -1
| Pixel properties | Quadrant properties | ||||||
|---|---|---|---|---|---|---|---|
| Quadrant | DetID | PixID | Counts | Sigma | Mean | Median | Sigma |
| A | 1 | 162 | 160430 | 1016.3 | 772 | 756 | 157.1 |
| A | 1 | 178 | 85974 | 542.4 | 772 | 756 | 157.1 |
| A | 1 | 161 | 74536 | 469.6 | 772 | 756 | 157.1 |
| B | 4 | 239 | 692768 | 4718.07 | 779 | 761 | 146.7 |
| B | 15 | 204 | 46312 | 310.56 | 779 | 761 | 146.7 |
| B | 11 | 51 | 32325 | 215.2 | 779 | 761 | 146.7 |
| C | 8 | 208 | 7476 | 38.64 | 755 | 761 | 173.8 |
| C | 13 | 61 | 5478 | 27.14 | 755 | 761 | 173.8 |
| C | 12 | 4 | 1834 | 6.17 | 755 | 761 | 173.8 |
| D | 1 | 52 | 2402839 | 14171.96 | 703 | 682 | 169.5 |
| D | 8 | 195 | 76870 | 449.48 | 703 | 682 | 169.5 |
| D | 13 | 104 | 45299 | 263.23 | 703 | 682 | 169.5 |
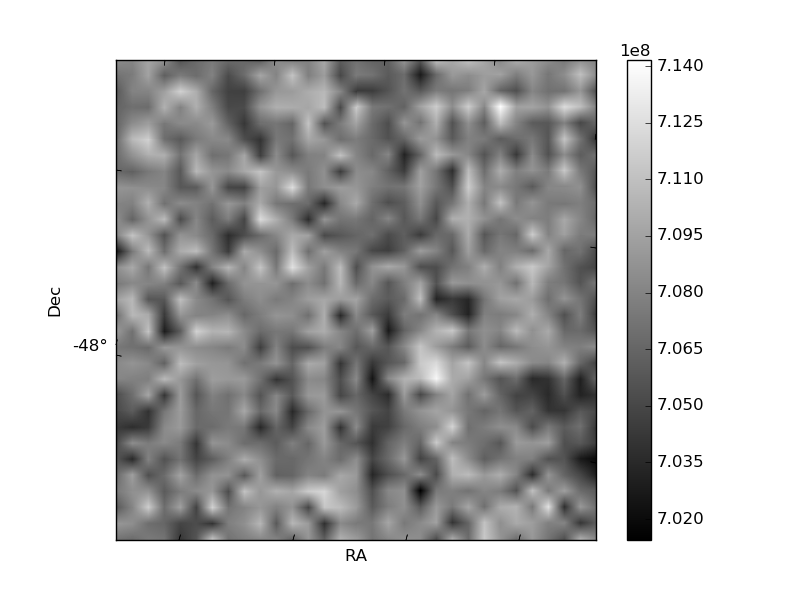
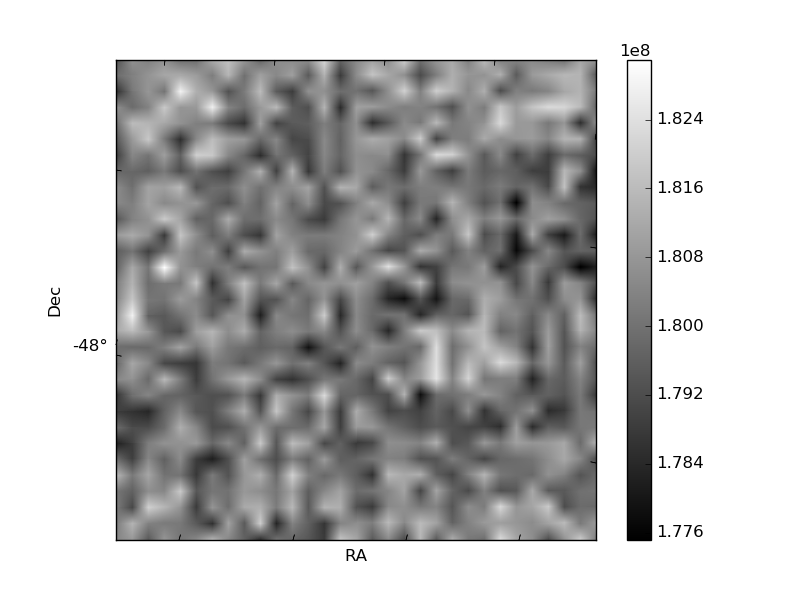
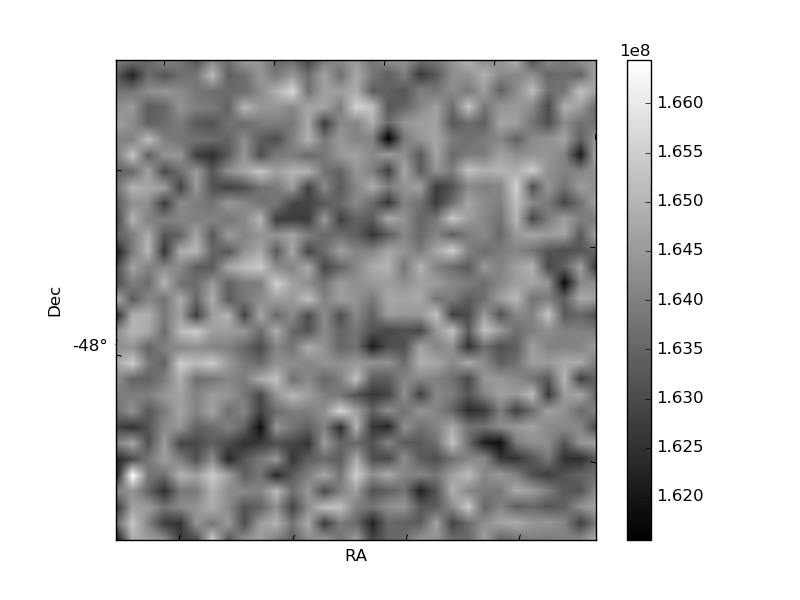
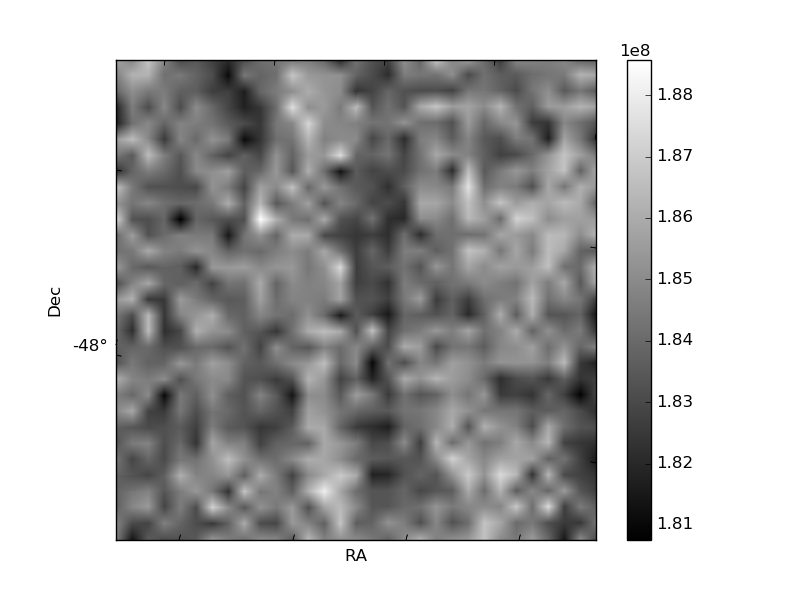
Histogram calculated using DETX and DETY for each event in the final _common_clean file
| Quadrant A | 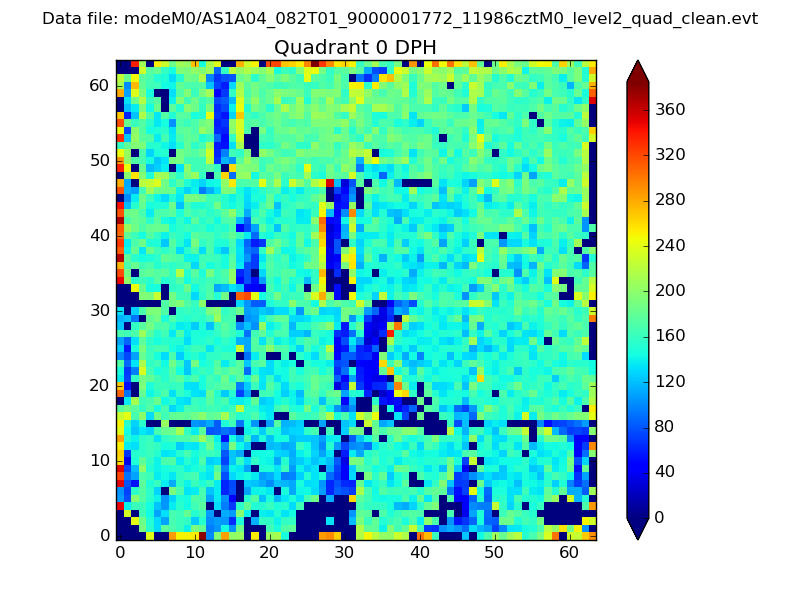 |
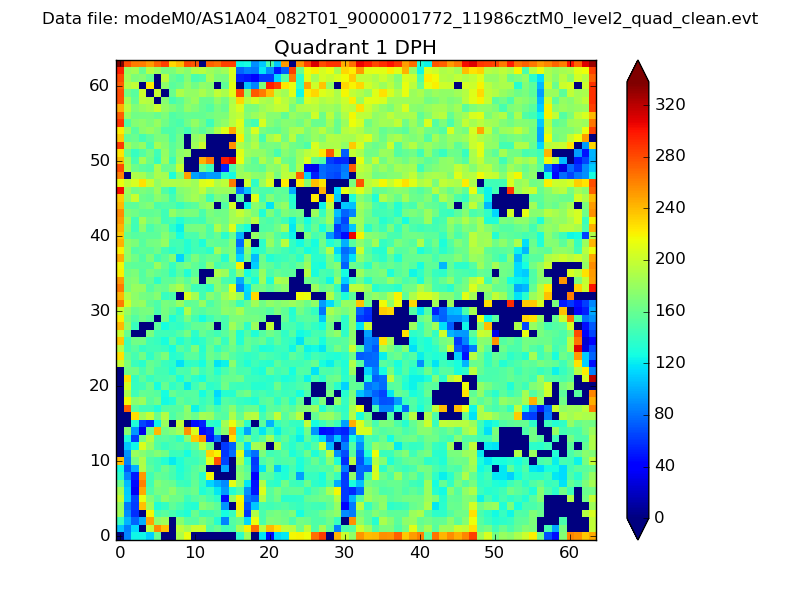 |
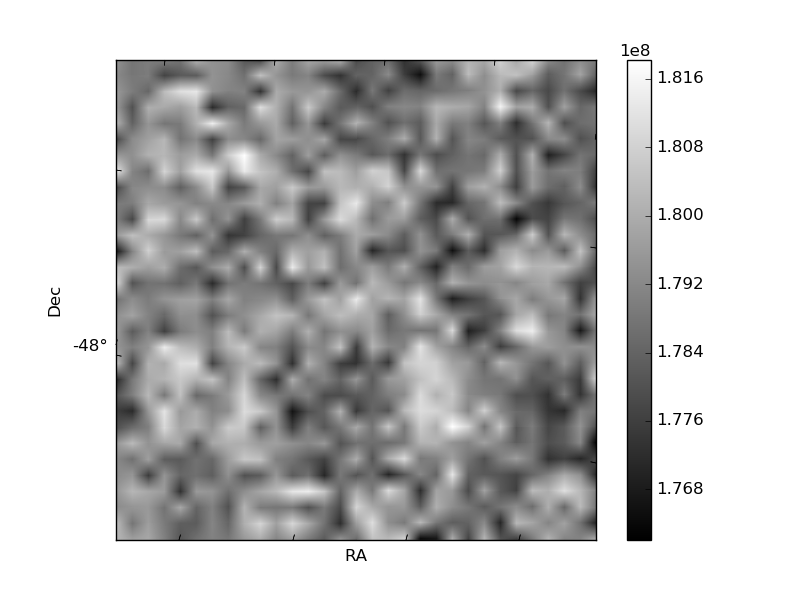
Quadrant B |
|---|---|---|---|
| Quadrant D | 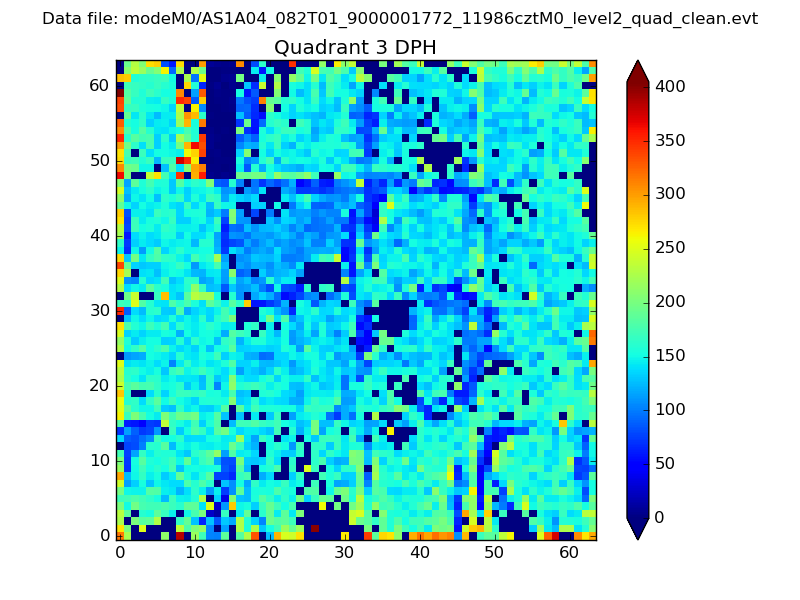 |
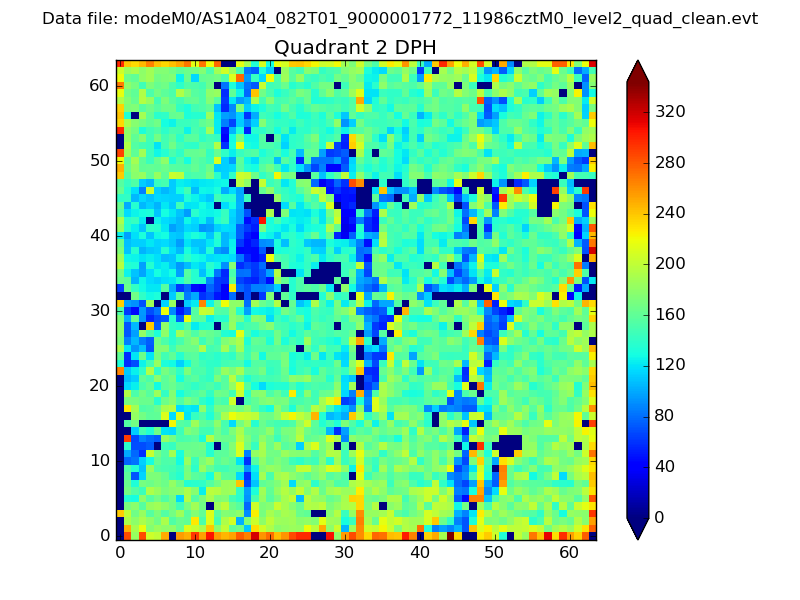 |
Quadrant C |
| Plot type | Count rate plots | Images |
|---|---|---|
| Comparison with Poisson distribution Blue bars denote a histogram of data divided into 1 sec bins. Red curve is a Poisson curve with rate = median count rate of data. |
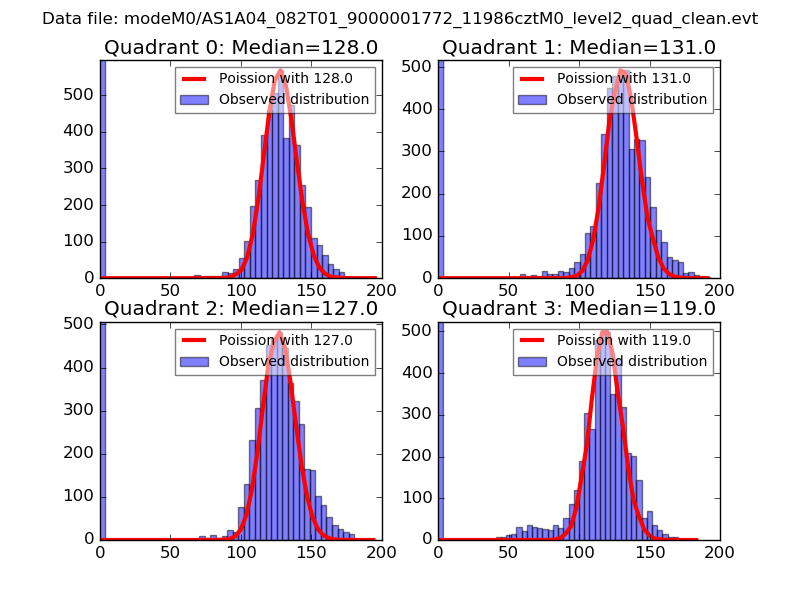 |
 |
| Quadrant-wise count rates Data is divided into 100 sec bins |
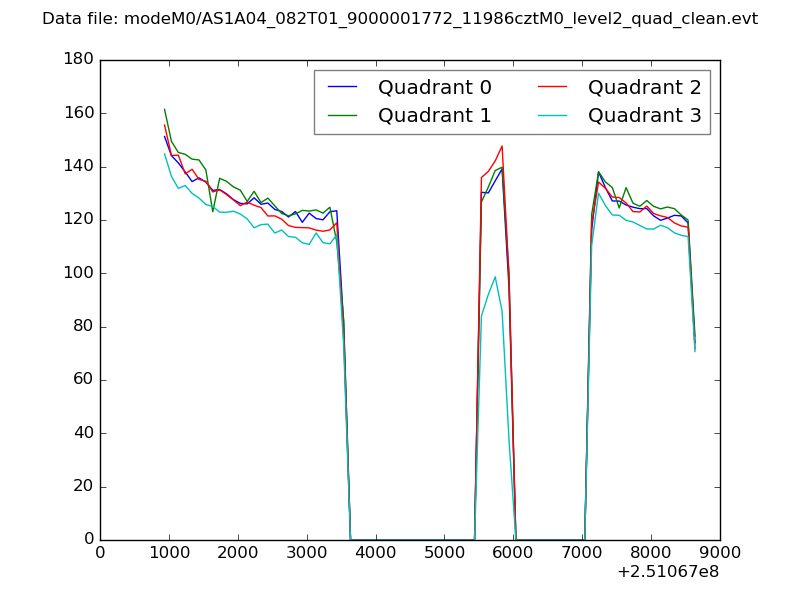 |
|
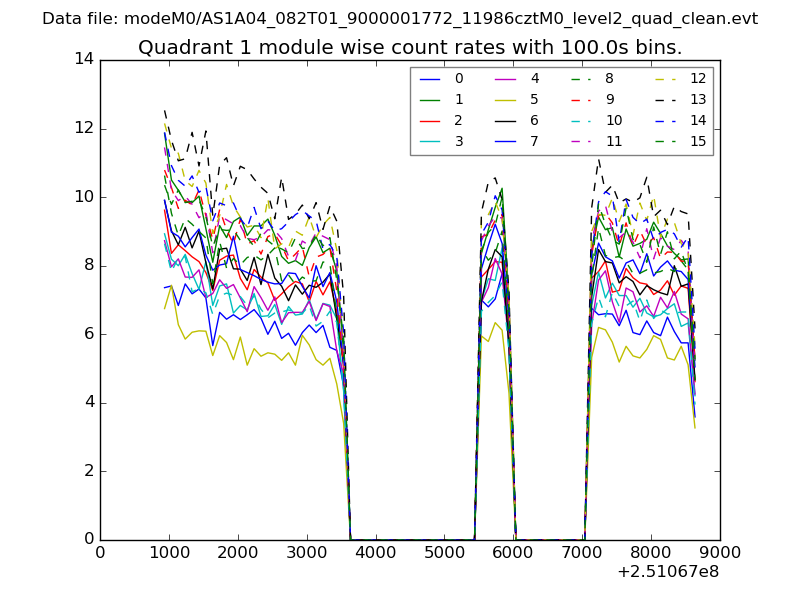
| Module-wise count rates for Quadrant A Data is divided into 100 sec bins |
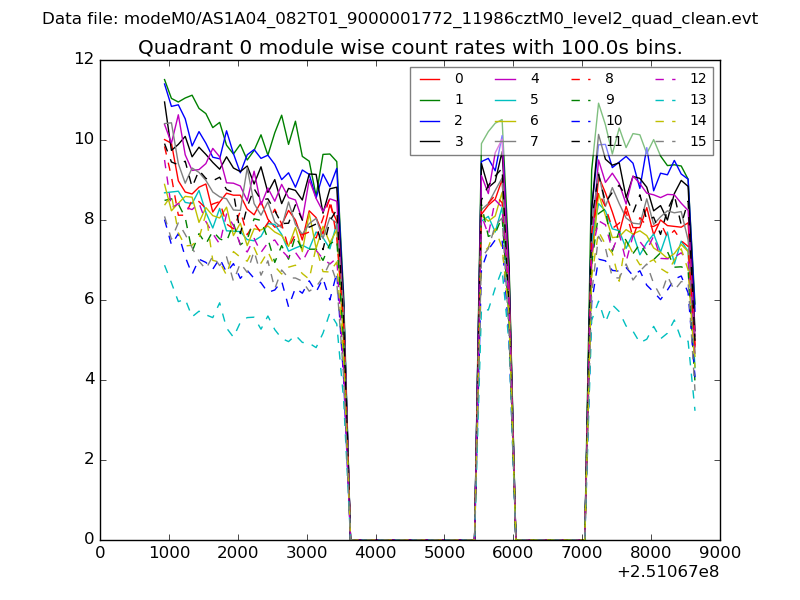 |
 |
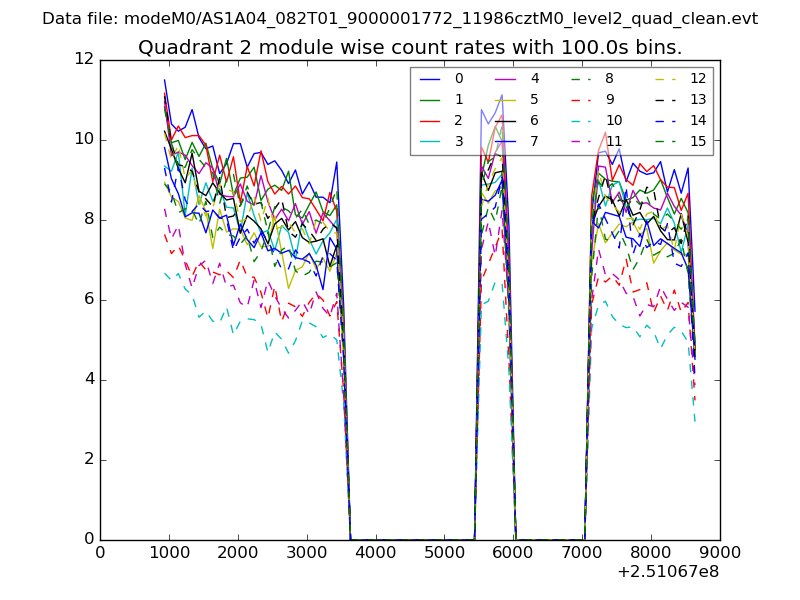
| Module-wise count rates for Quadrant B Data is divided into 100 sec bins |
 |
 |
| Module-wise count rates for Quadrant C Data is divided into 100 sec bins |
 |
 |
| Module-wise count rates for Quadrant D Data is divided into 100 sec bins |
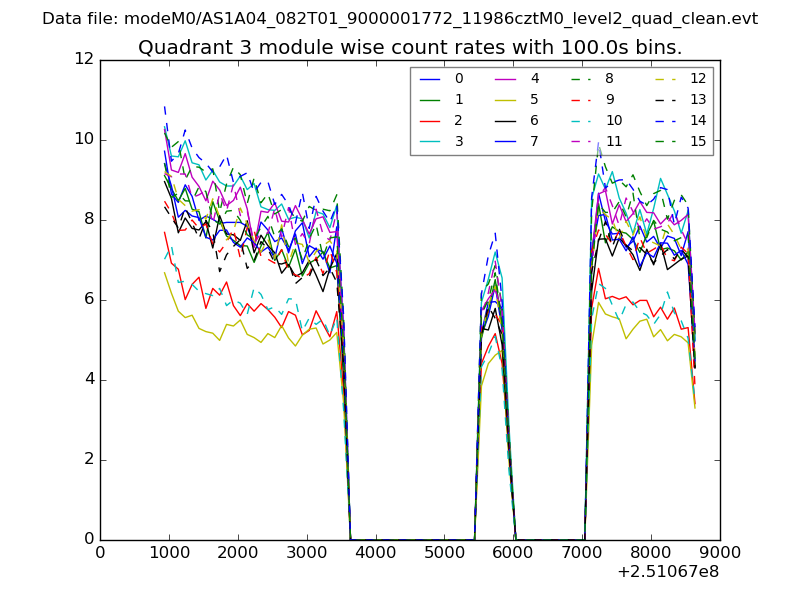 |
 |
| Parameter | Plot |
|---|---|
| CZT HV Monitor | 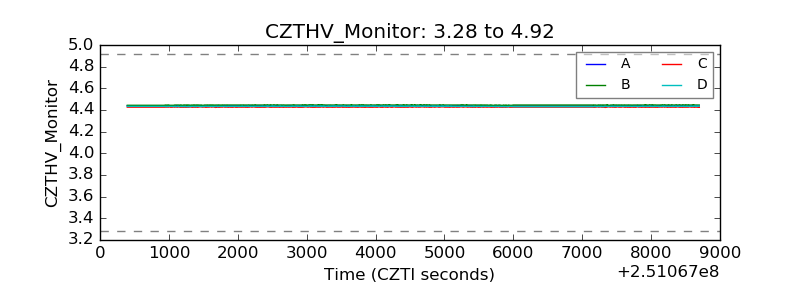 |
| D_VDD | 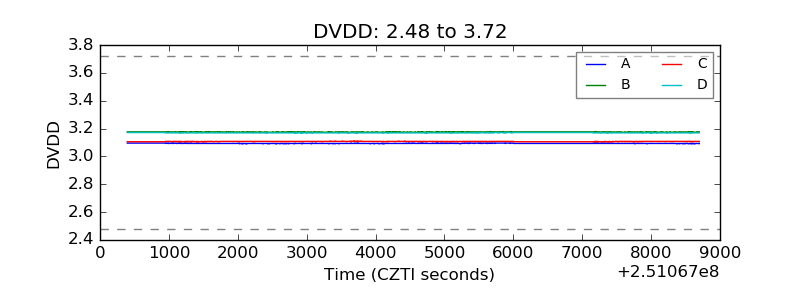 |
| Temperature 1 | 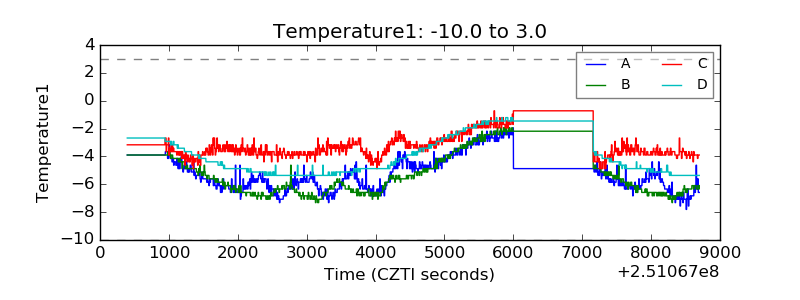 |
| Veto HV Monitor | 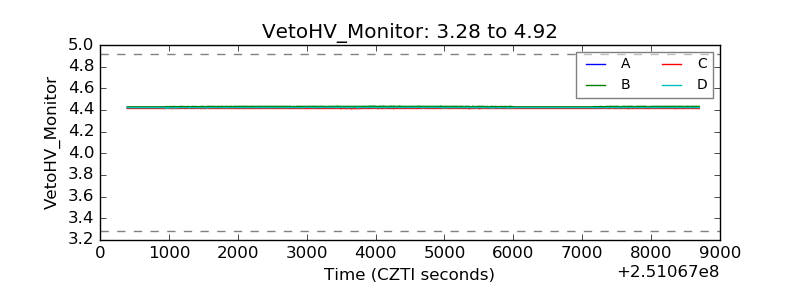 |
| Veto LLD | 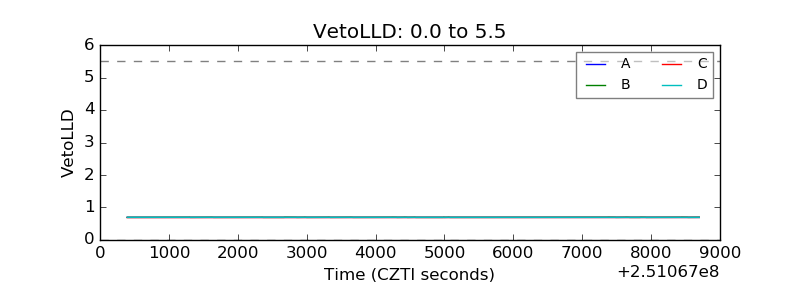 |
| Alpha Counter | 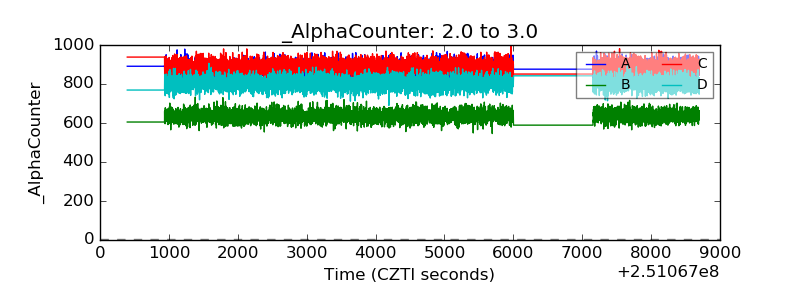 |
| _CPM_Rate | 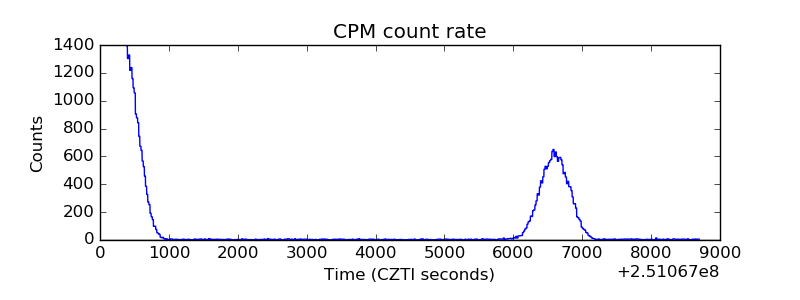 |
| CZT Counter | 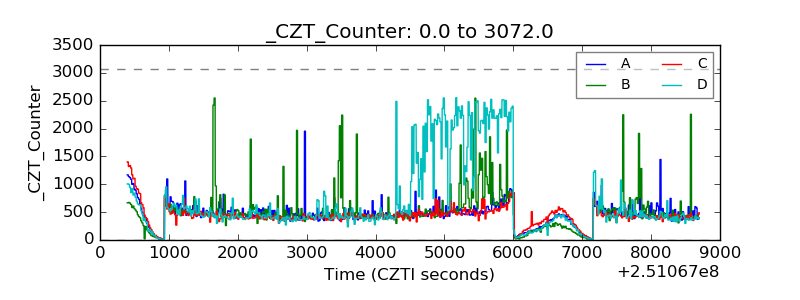 |
| +2.5 Volts monitor |  |
| +5 Volts monitor |  |
| _ROLL_ROT | 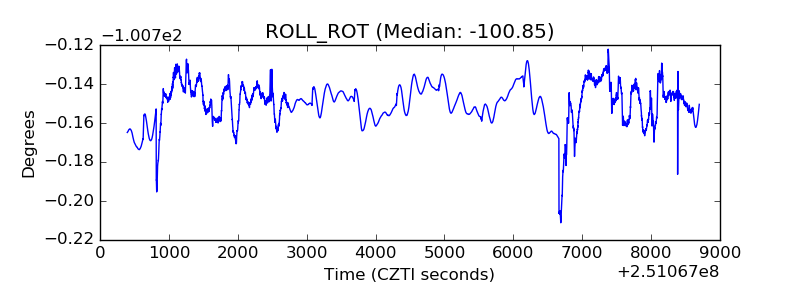 |
| _Roll_DEC | 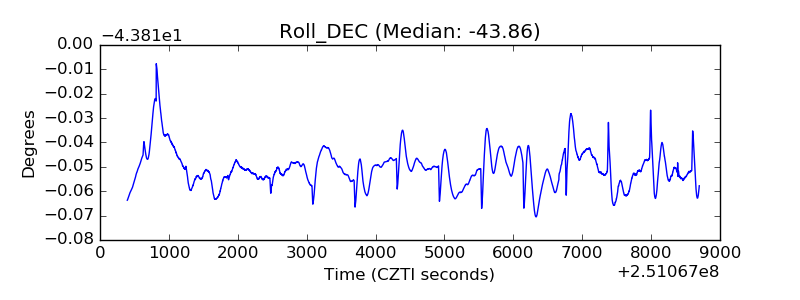 |
| _Roll_RA | 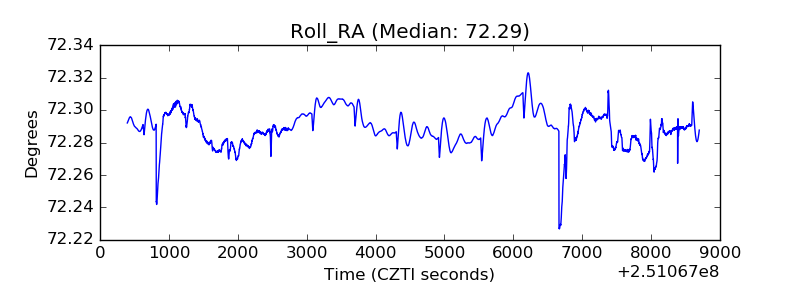 |
| Veto Counter | 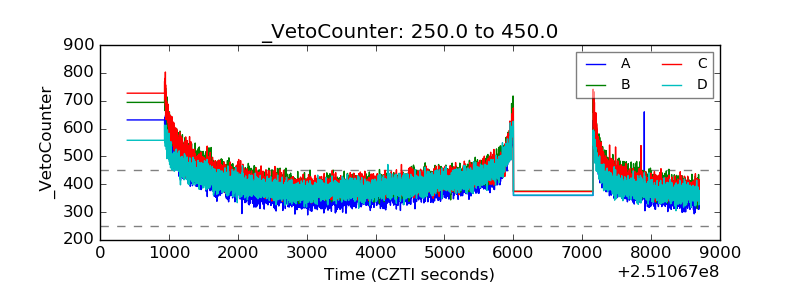 |