| Param | Original file | Final file |
|---|---|---|
| Filename | modeM0/AS1A04_082T01_9000001772_11989cztM0_level2.evt | modeM0/AS1A04_082T01_9000001772_11989cztM0_level2_quad_clean.evt |
| Size (bytes) | 555,145,920 | 97,493,760 |
| Size | 529.4 MB | 93.0 MB |
| Events in quadrant A | 3,820,583 | 618,257 |
| Events in quadrant B | 3,962,399 | 625,388 |
| Events in quadrant C | 3,818,787 | 609,636 |
| Events in quadrant D | 4,701,341 | 576,481 |
| Mode SS | |||
|---|---|---|---|
| Quadrant | BADHDUFLAG | Total packets | Discarded packets |
| A | 0 | 152 | 0 |
| B | 0 | 152 | 0 |
| C | 0 | 152 | 0 |
| D | 0 | 152 | 0 |
| Mode M0 | |||
|---|---|---|---|
| Quadrant | BADHDUFLAG | Total packets | Discarded packets |
| A | 0 | 16379 | 2 |
| B | 0 | 16746 | 1 |
| C | 0 | 16222 | 1 |
| D | 0 | 18988 | 1 |
| Mode M9 | |||
|---|---|---|---|
| Quadrant | BADHDUFLAG | Total packets | Discarded packets |
| A | 0 | 2 | 0 |
| B | 0 | 2 | 0 |
| C | 0 | 2 | 0 |
| D | 0 | 2 | 0 |
| Quadrant | Total seconds | Saturated seconds | Saturation percentage |
|---|---|---|---|
| A | 7511 | 148 | 1.970443% |
| B | 7511 | 201 | 2.676075% |
| C | 7511 | 92 | 1.224870% |
| D | 7511 | 287 | 3.821062% |
Noise dominated data is calculated using 1-second bins in cleaned event files. If a bin has >2000 counts, and if more than 50% of those come from <1% of pixels, then it is considered to be noise-dominated and hence unusable.
| Quadrant | # 1 sec bins | Bins with >0 counts | Bins with >2000 counts | High rate bins dominated by noise | Noise dominated (total time) | Noise dominated (detector-on time) | Marked lightcurve |
|---|---|---|---|---|---|---|---|
| A | 7752 | 7512 | 6 | 6 | 0.08% | 0.08% | 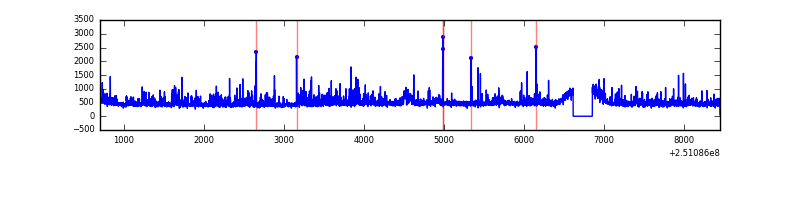 |
| B | 7752 | 7512 | 46 | 46 | 0.59% | 0.61% | 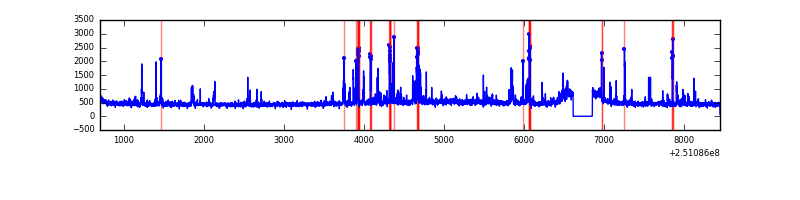 |
| C | 7752 | 7512 | 0 | 0 | 0.00% | 0.00% | 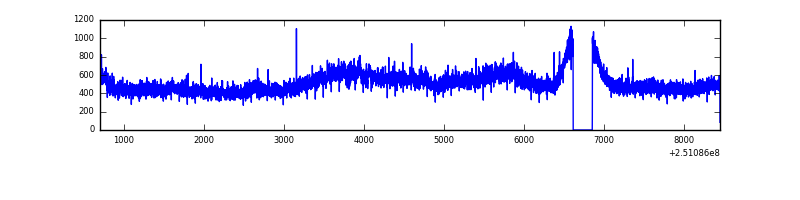 |
| D | 7752 | 7512 | 204 | 204 | 2.63% | 2.72% | 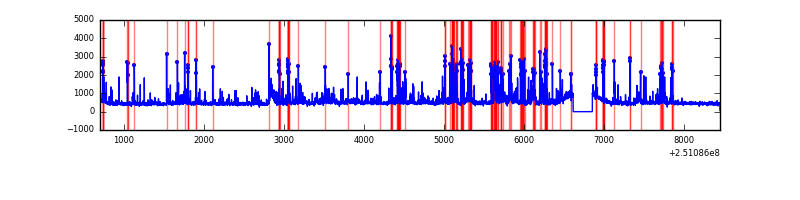 |
Top three noisy pixels from each quadrant. If the there are fewer than three noisy pixels in the level2.evt file, extra rows are filled as -1
| Pixel properties | Quadrant properties | ||||||
|---|---|---|---|---|---|---|---|
| Quadrant | DetID | PixID | Counts | Sigma | Mean | Median | Sigma |
| A | 1 | 162 | 188711 | 1060.83 | 862 | 844 | 177.1 |
| A | 1 | 178 | 102915 | 576.37 | 862 | 844 | 177.1 |
| A | 1 | 161 | 90156 | 504.32 | 862 | 844 | 177.1 |
| B | 4 | 239 | 431271 | 2564.48 | 868 | 845 | 167.8 |
| B | 15 | 204 | 80602 | 475.19 | 868 | 845 | 167.8 |
| B | 11 | 51 | 29054 | 168.07 | 868 | 845 | 167.8 |
| C | 8 | 208 | 516807 | 2626.56 | 847 | 849 | 196.4 |
| C | 13 | 61 | 6251 | 27.5 | 847 | 849 | 196.4 |
| C | 14 | 234 | 2549 | 8.65 | 847 | 849 | 196.4 |
| D | 1 | 52 | 983625 | 4911.93 | 827 | 802 | 200.1 |
| D | 8 | 195 | 217528 | 1083.15 | 827 | 802 | 200.1 |
| D | 7 | 80 | 182510 | 908.14 | 827 | 802 | 200.1 |
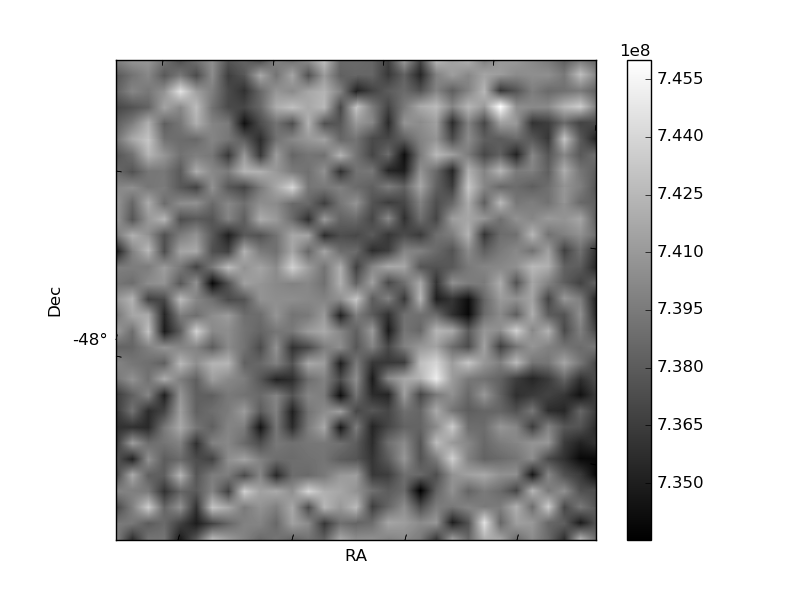
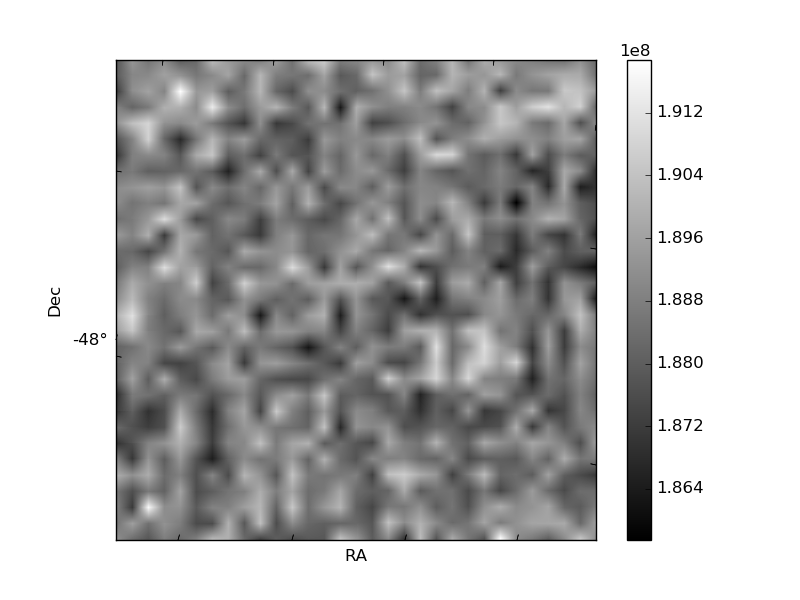
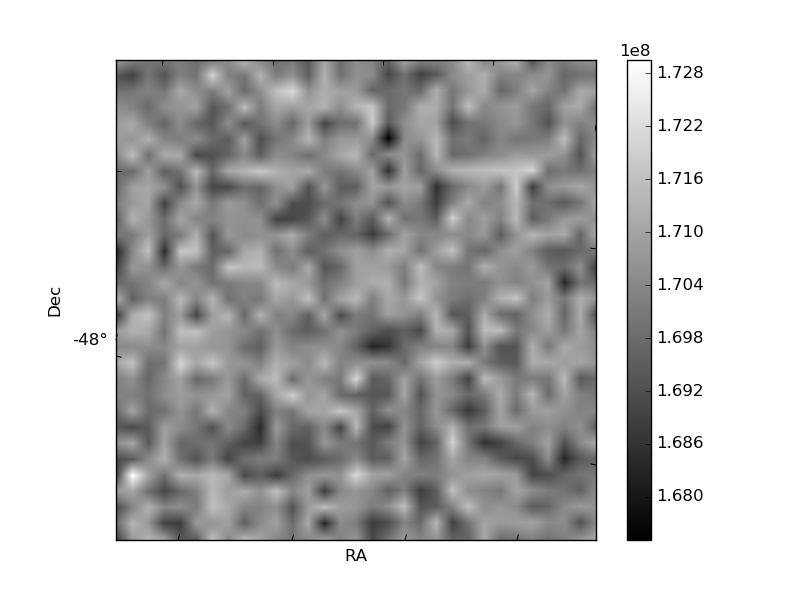
Histogram calculated using DETX and DETY for each event in the final _common_clean file
| Quadrant A | 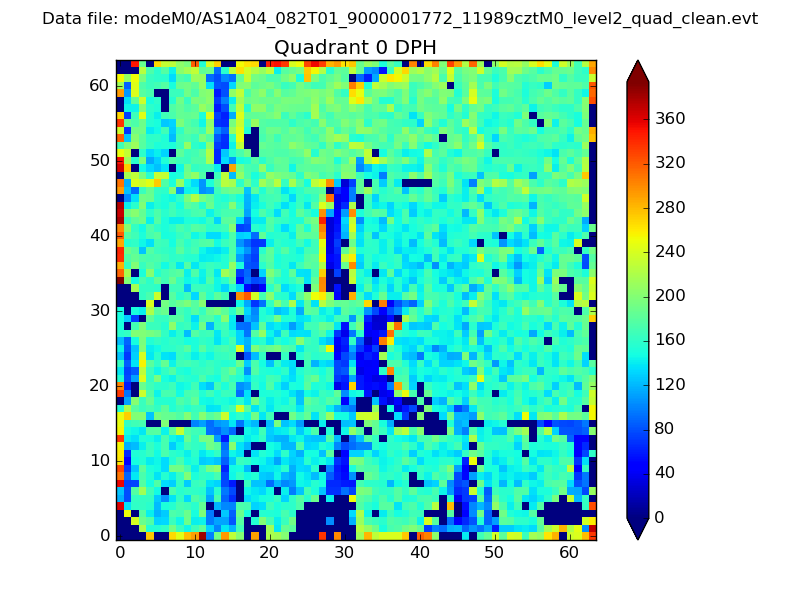 |
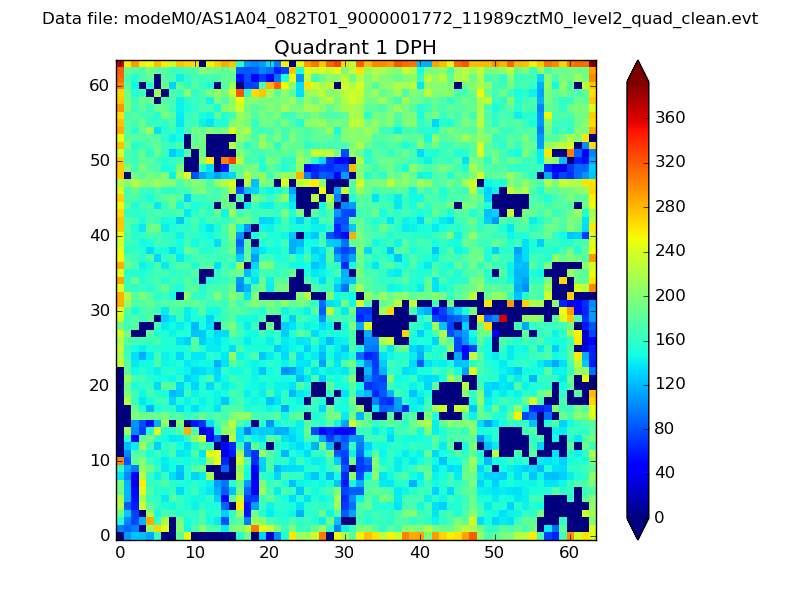 |
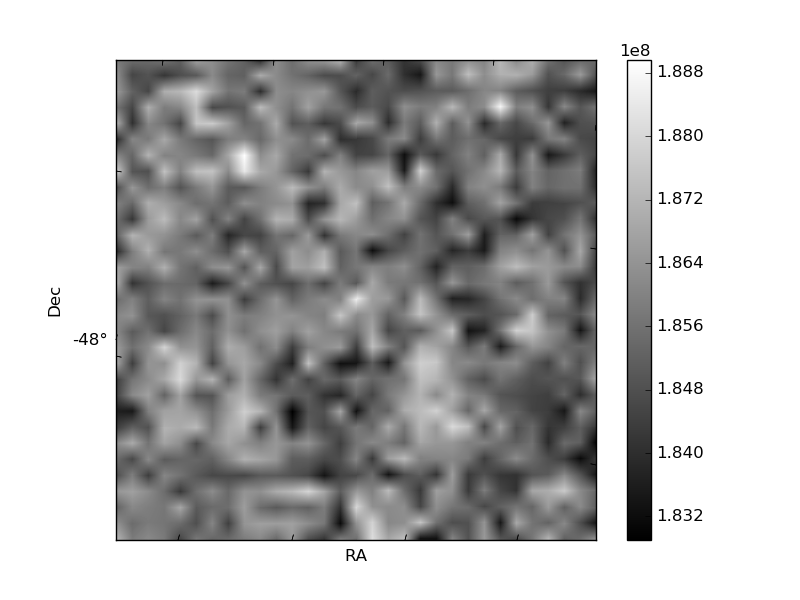
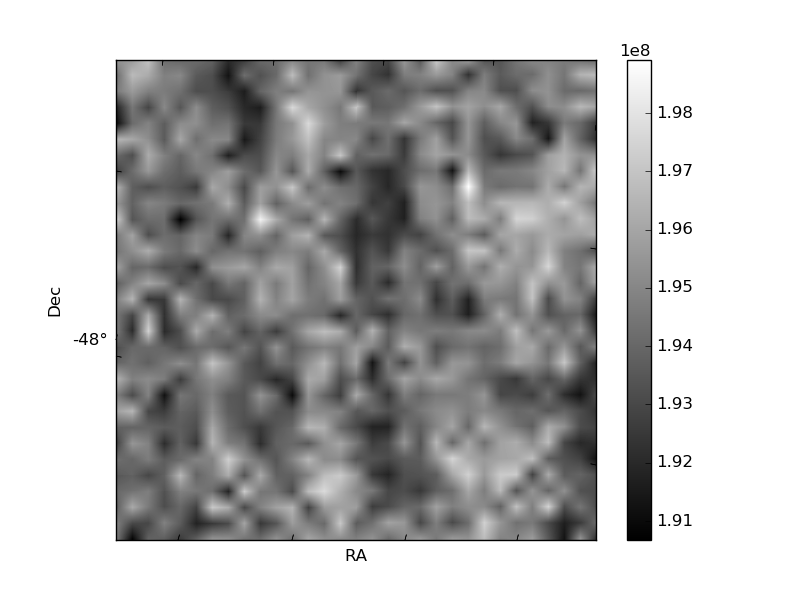
Quadrant B |
|---|---|---|---|
| Quadrant D | 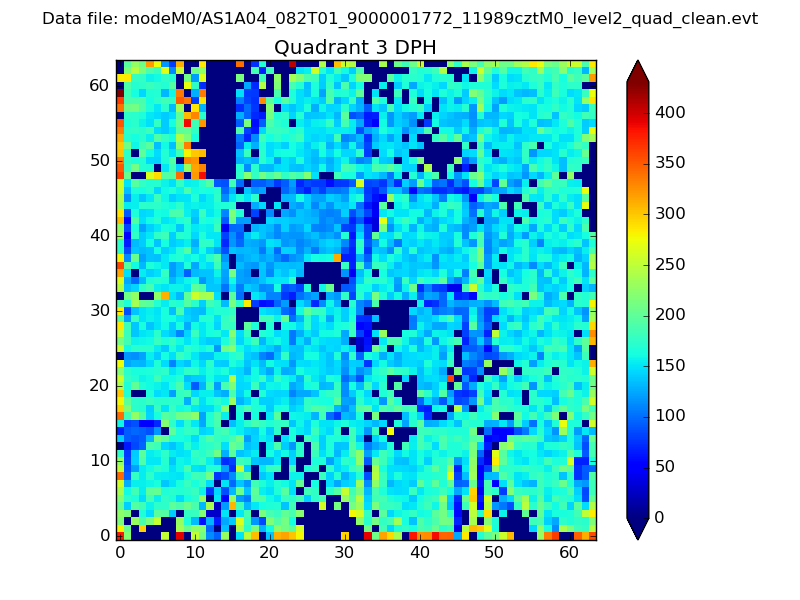 |
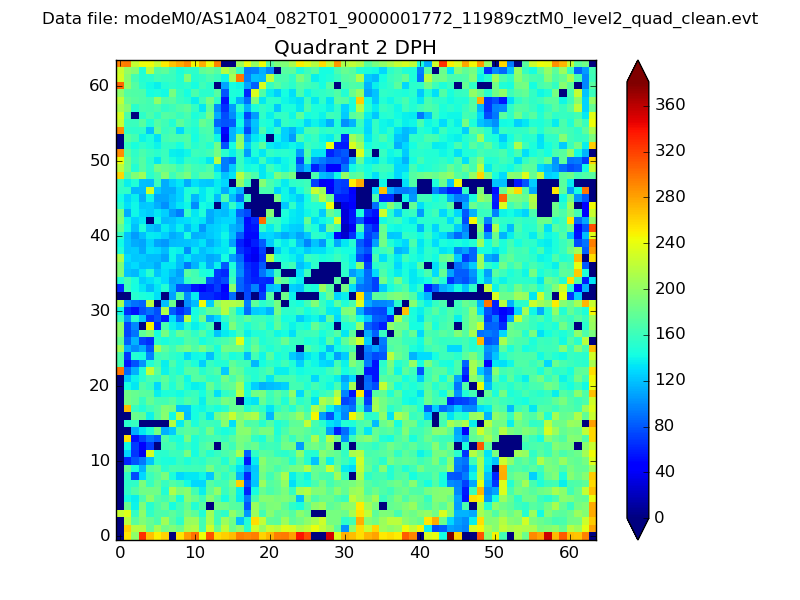 |
Quadrant C |
| Plot type | Count rate plots | Images |
|---|---|---|
| Comparison with Poisson distribution Blue bars denote a histogram of data divided into 1 sec bins. Red curve is a Poisson curve with rate = median count rate of data. |
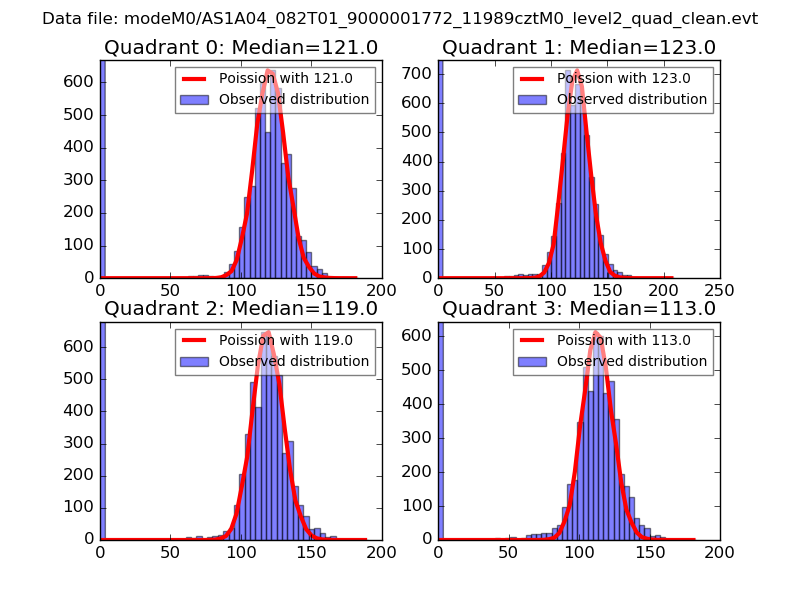 |
 |
| Quadrant-wise count rates Data is divided into 100 sec bins |
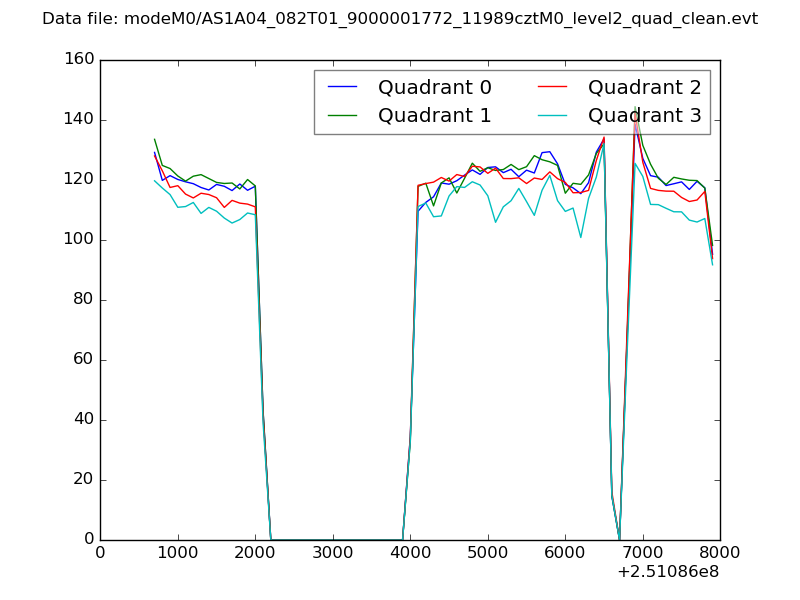 |
|
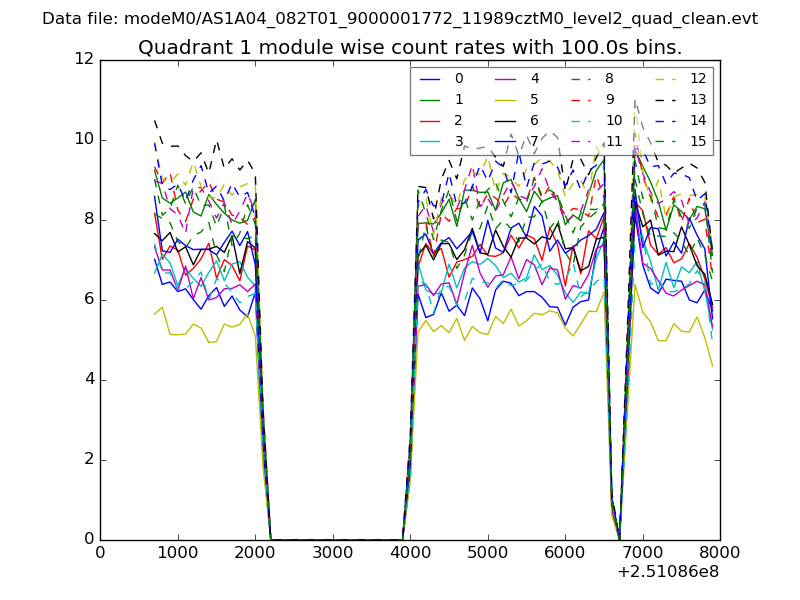
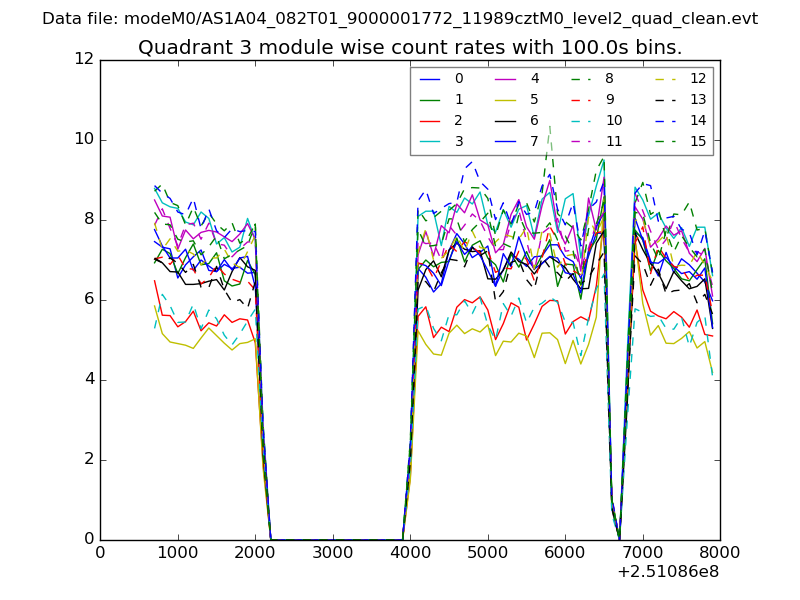
| Module-wise count rates for Quadrant A Data is divided into 100 sec bins |
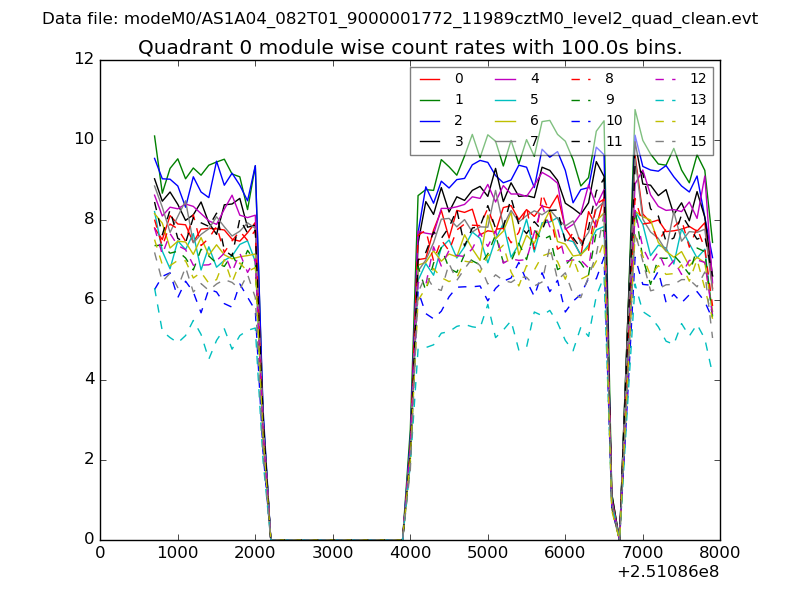 |
 |
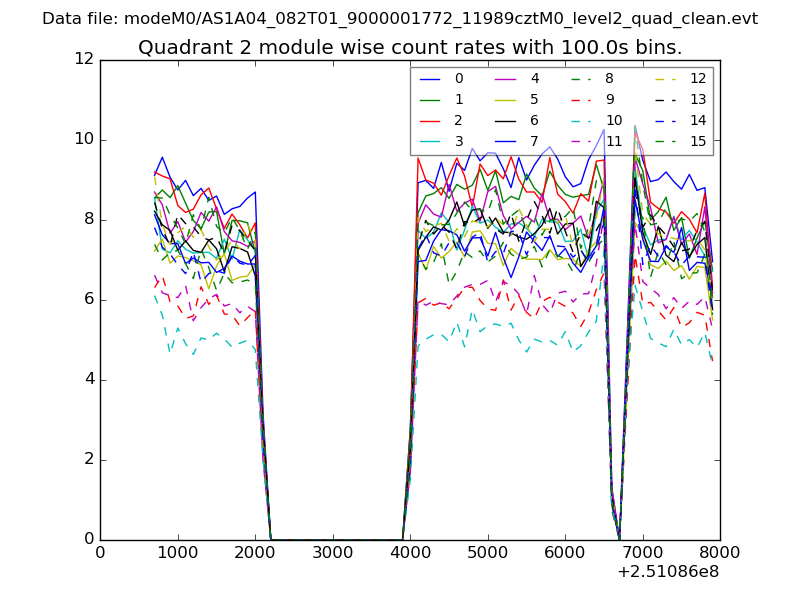
| Module-wise count rates for Quadrant B Data is divided into 100 sec bins |
 |
 |
| Module-wise count rates for Quadrant C Data is divided into 100 sec bins |
 |
 |
| Module-wise count rates for Quadrant D Data is divided into 100 sec bins |
 |
 |
| Parameter | Plot |
|---|---|
| CZT HV Monitor | 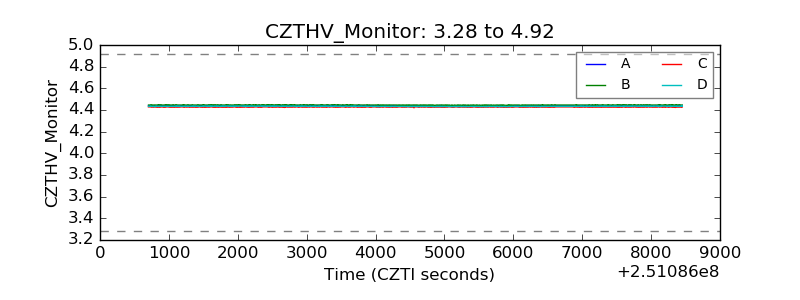 |
| D_VDD | 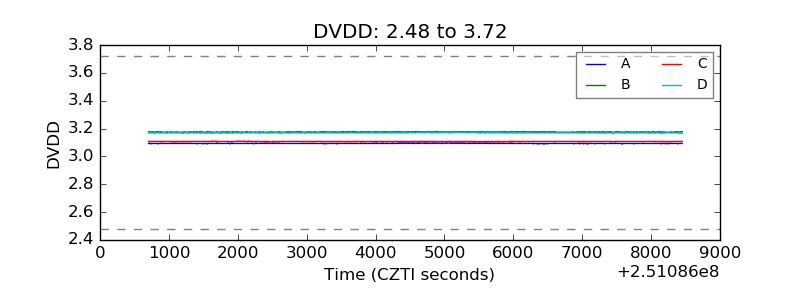 |
| Temperature 1 | 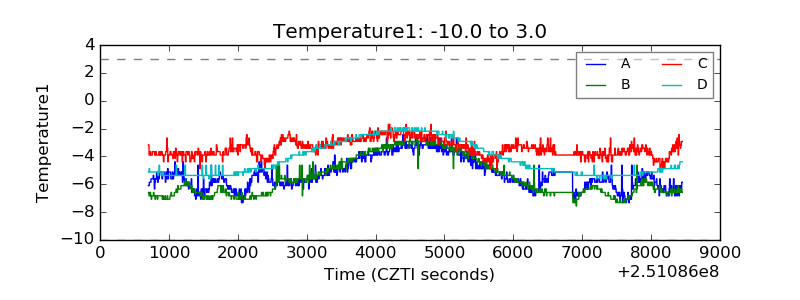 |
| Veto HV Monitor | 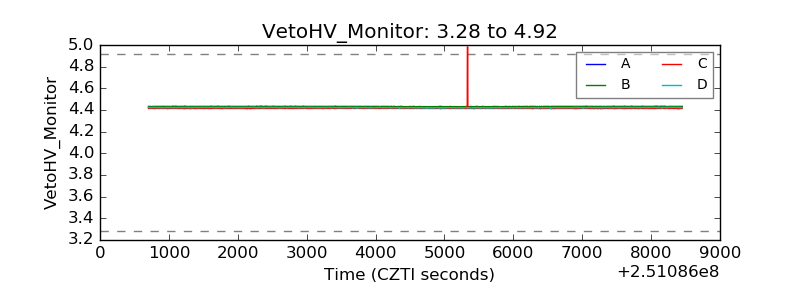 |
| Veto LLD | 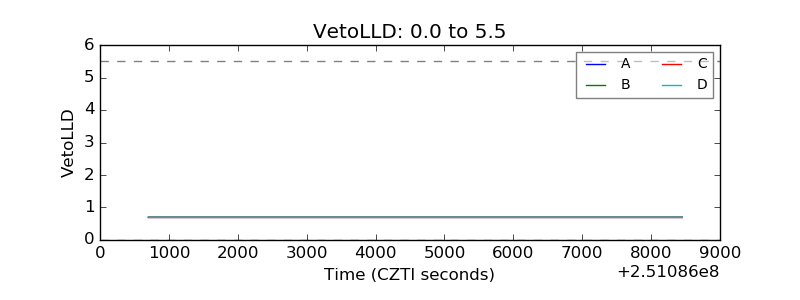 |
| Alpha Counter | 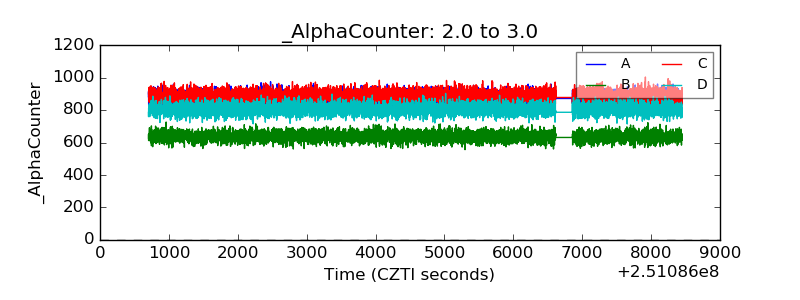 |
| _CPM_Rate | 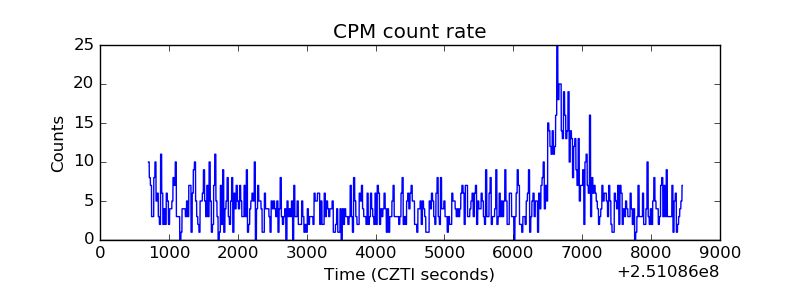 |
| CZT Counter | 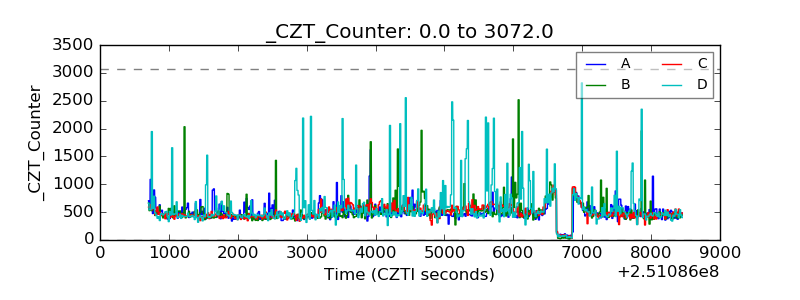 |
| +2.5 Volts monitor |  |
| +5 Volts monitor | 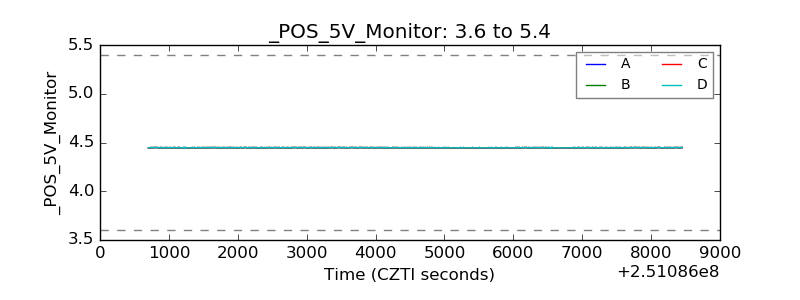 |
| _ROLL_ROT | 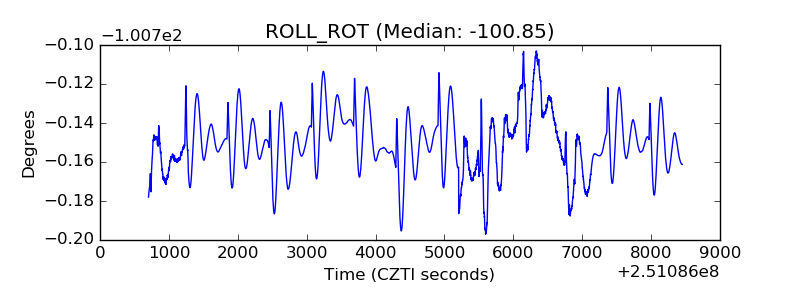 |
| _Roll_DEC | 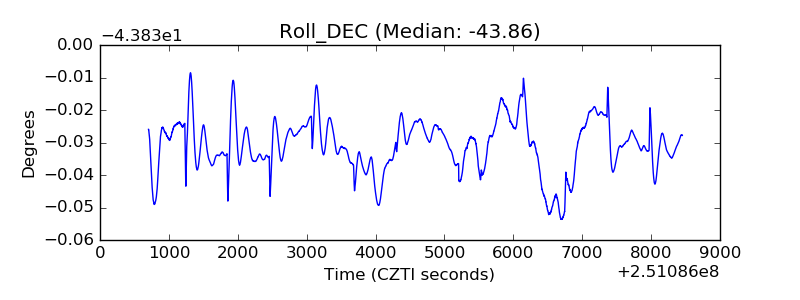 |
| _Roll_RA | 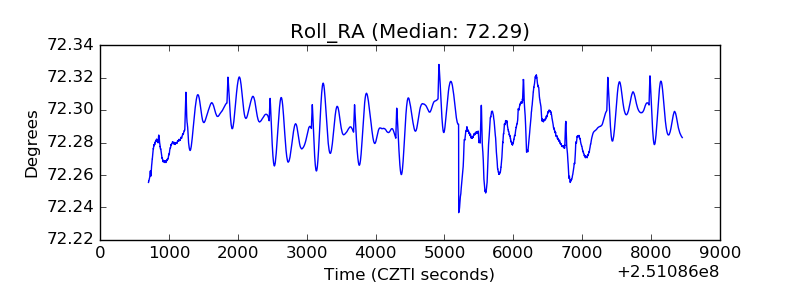 |
| Veto Counter | 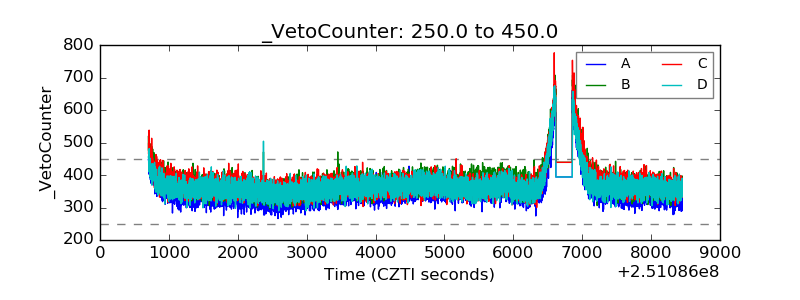 |