| Param | Original file | Final file |
|---|---|---|
| Filename | modeM0/AS1A04_082T01_9000001772_11993cztM0_level2.evt | modeM0/AS1A04_082T01_9000001772_11993cztM0_level2_quad_clean.evt |
| Size (bytes) | 1,357,427,520 | 227,540,160 |
| Size | 1.3 GB | 217.0 MB |
| Events in quadrant A | 9,799,790 | 1,416,861 |
| Events in quadrant B | 11,538,093 | 1,409,399 |
| Events in quadrant C | 8,339,715 | 1,417,498 |
| Events in quadrant D | 10,171,247 | 1,361,788 |
| Mode SS | |||
|---|---|---|---|
| Quadrant | BADHDUFLAG | Total packets | Discarded packets |
| A | 0 | 380 | 0 |
| B | 0 | 380 | 0 |
| C | 0 | 380 | 0 |
| D | 0 | 380 | 0 |
| Mode M0 | |||
|---|---|---|---|
| Quadrant | BADHDUFLAG | Total packets | Discarded packets |
| A | 0 | 41484 | 5 |
| B | 0 | 46117 | 4 |
| C | 0 | 38267 | 4 |
| D | 0 | 41998 | 4 |
| Mode M9 | |||
|---|---|---|---|
| Quadrant | BADHDUFLAG | Total packets | Discarded packets |
| A | 0 | 25 | 0 |
| B | 0 | 25 | 0 |
| C | 0 | 25 | 0 |
| D | 0 | 25 | 0 |
| Quadrant | Total seconds | Saturated seconds | Saturation percentage |
|---|---|---|---|
| A | 18667 | 462 | 2.474956% |
| B | 18667 | 888 | 4.757058% |
| C | 18667 | 260 | 1.392832% |
| D | 18667 | 413 | 2.212460% |
Noise dominated data is calculated using 1-second bins in cleaned event files. If a bin has >2000 counts, and if more than 50% of those come from <1% of pixels, then it is considered to be noise-dominated and hence unusable.
| Quadrant | # 1 sec bins | Bins with >0 counts | Bins with >2000 counts | High rate bins dominated by noise | Noise dominated (total time) | Noise dominated (detector-on time) | Marked lightcurve |
|---|---|---|---|---|---|---|---|
| A | 21053 | 18668 | 58 | 58 | 0.28% | 0.31% | 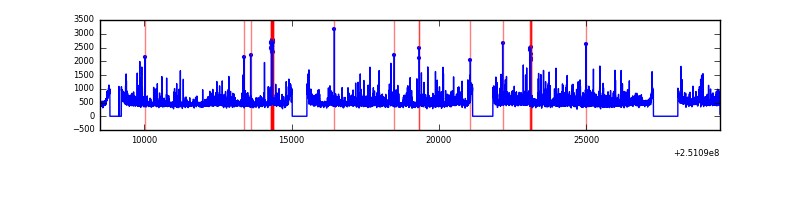 |
| B | 21053 | 18668 | 433 | 433 | 2.06% | 2.32% | 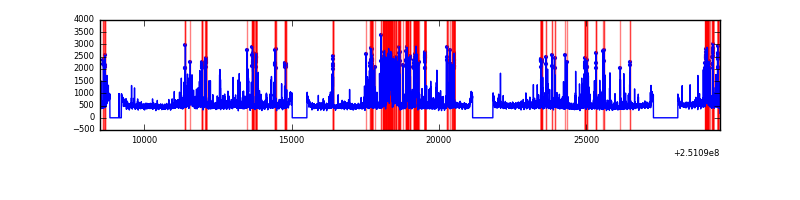 |
| C | 21053 | 18669 | 2 | 2 | 0.01% | 0.01% | 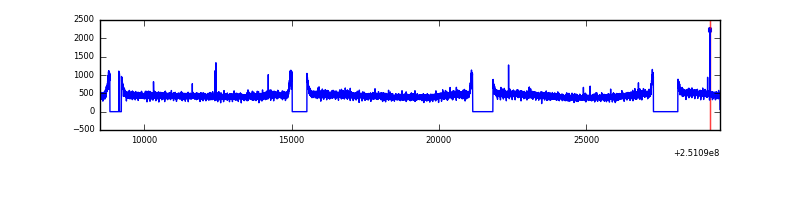 |
| D | 21053 | 18668 | 147 | 147 | 0.70% | 0.79% | 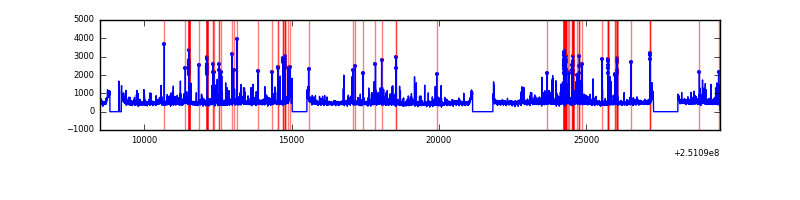 |
Top three noisy pixels from each quadrant. If the there are fewer than three noisy pixels in the level2.evt file, extra rows are filled as -1
| Pixel properties | Quadrant properties | ||||||
|---|---|---|---|---|---|---|---|
| Quadrant | DetID | PixID | Counts | Sigma | Mean | Median | Sigma |
| A | 1 | 162 | 485712 | 1094.3 | 2177 | 2127 | 441.9 |
| A | 1 | 178 | 263584 | 591.65 | 2177 | 2127 | 441.9 |
| A | 1 | 161 | 229495 | 514.51 | 2177 | 2127 | 441.9 |
| B | 4 | 239 | 2039460 | 4910.31 | 2168 | 2114 | 414.9 |
| B | 11 | 51 | 358043 | 857.84 | 2168 | 2114 | 414.9 |
| B | 3 | 64 | 310565 | 743.41 | 2168 | 2114 | 414.9 |
| C | 14 | 234 | 16982 | 30.04 | 2134 | 2134 | 494.3 |
| C | 13 | 61 | 15668 | 27.38 | 2134 | 2134 | 494.3 |
| C | 7 | 247 | 7318 | 10.49 | 2134 | 2134 | 494.3 |
| D | 1 | 52 | 897906 | 1761.55 | 2114 | 2048 | 508.6 |
| D | 8 | 195 | 648508 | 1271.15 | 2114 | 2048 | 508.6 |
| D | 13 | 104 | 162592 | 315.68 | 2114 | 2048 | 508.6 |
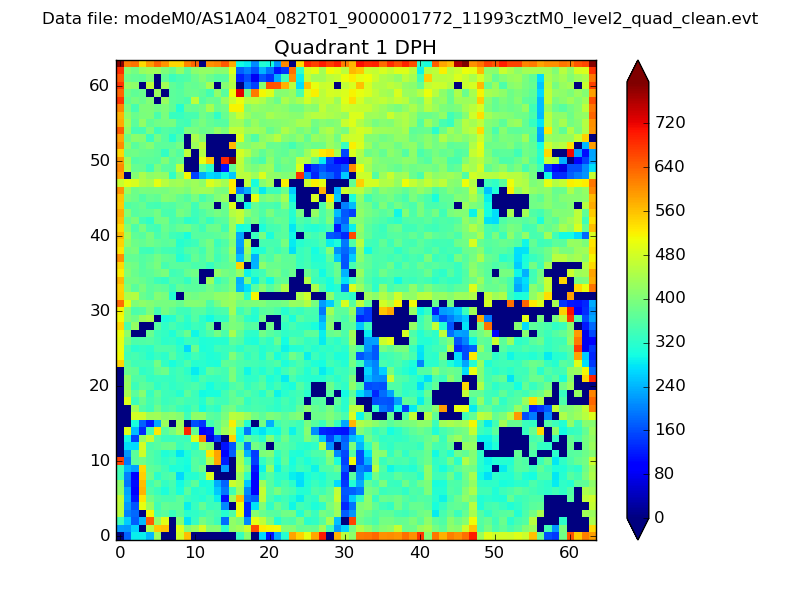
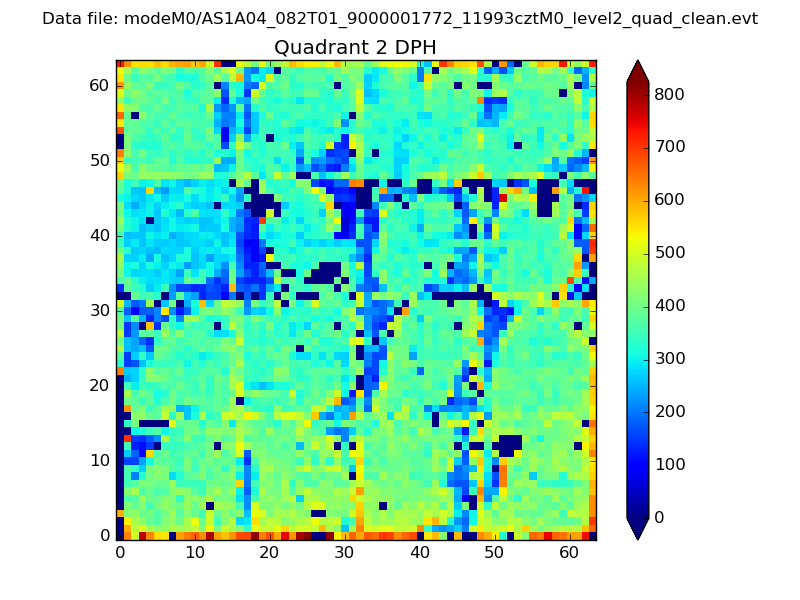
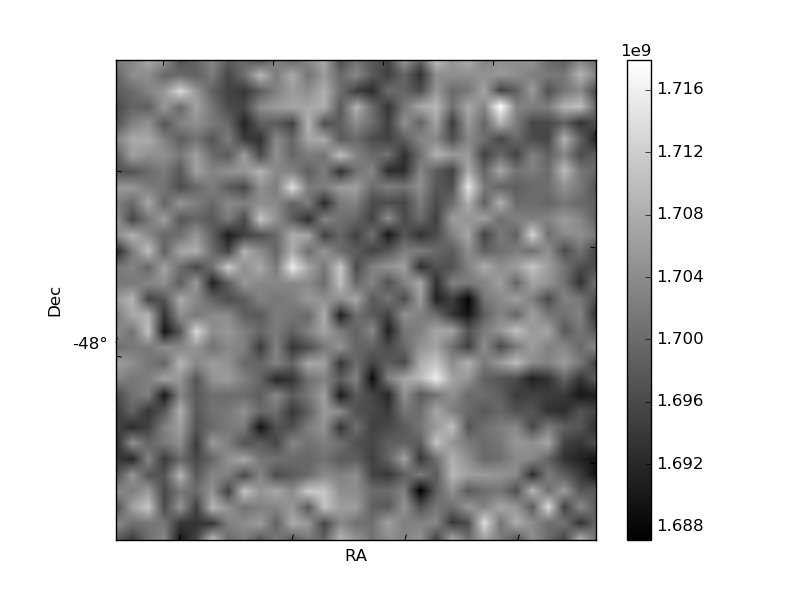
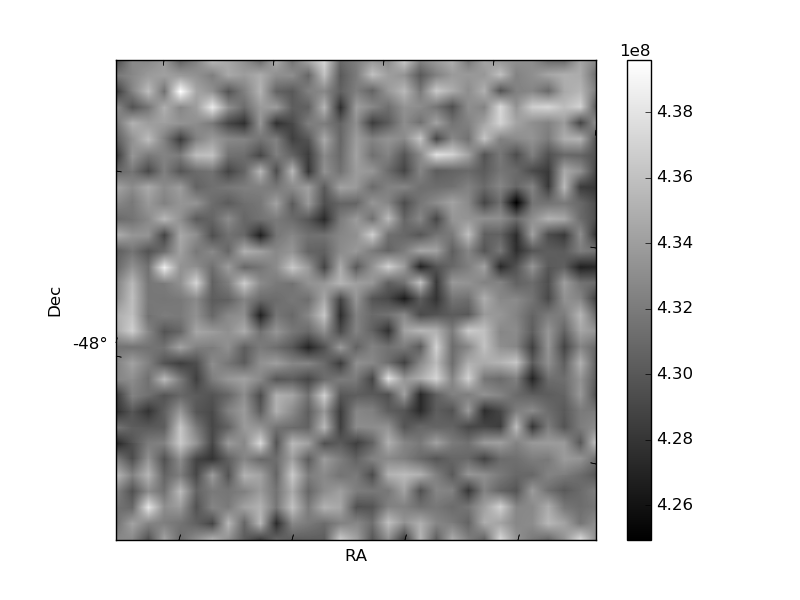
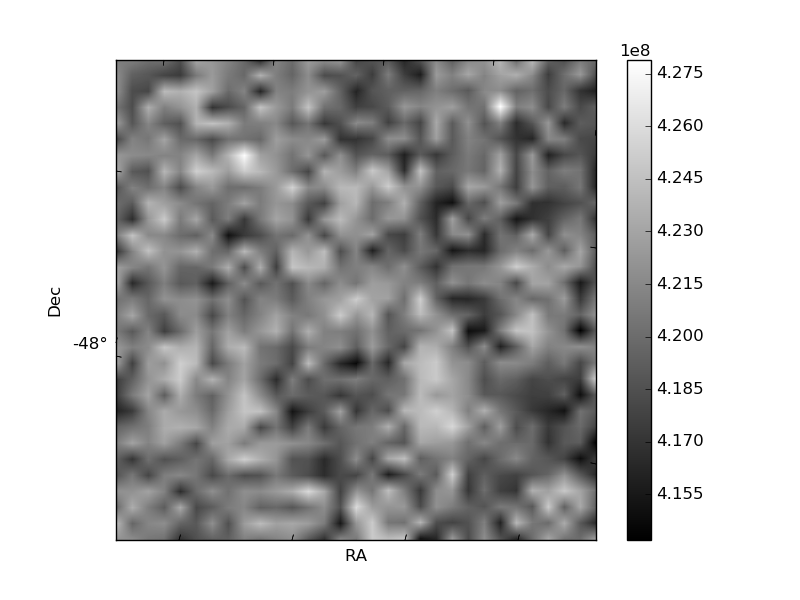
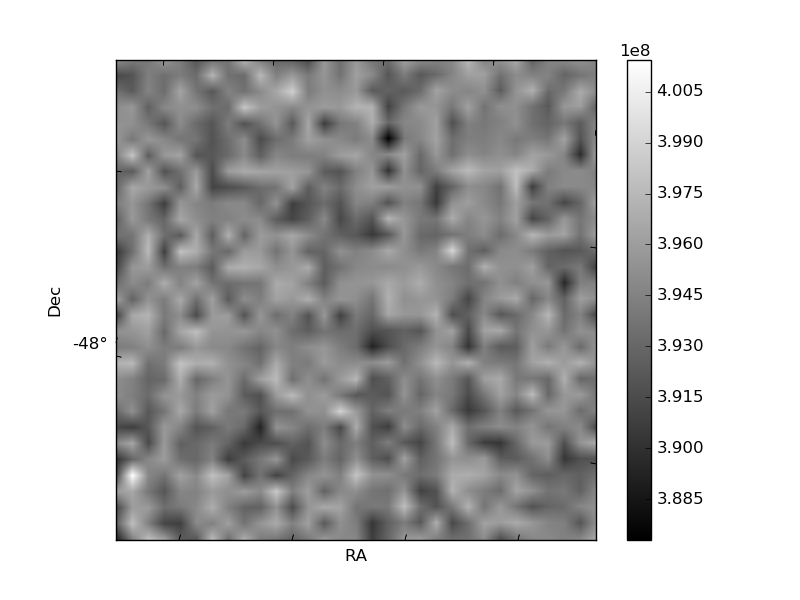
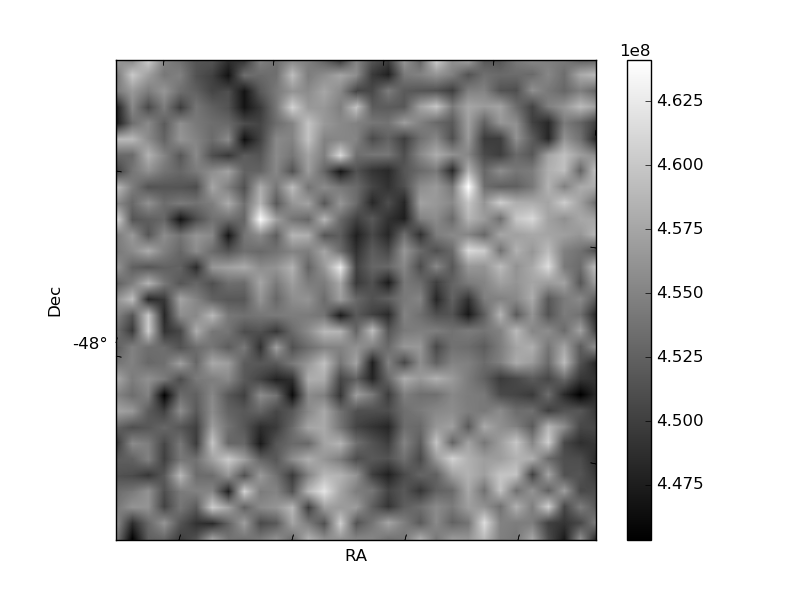
Histogram calculated using DETX and DETY for each event in the final _common_clean file
| Quadrant A |  |
 |
Quadrant B |
|---|---|---|---|
| Quadrant D | 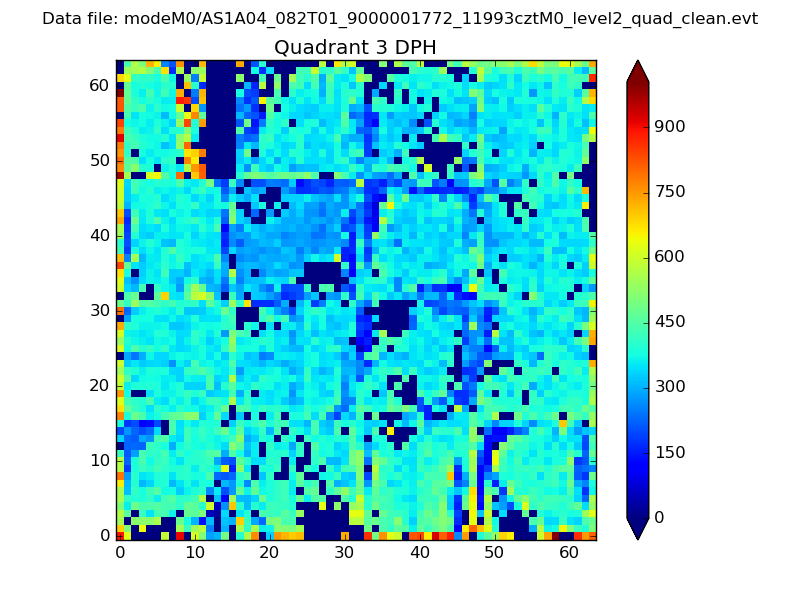 |
 |
Quadrant C |
| Plot type | Count rate plots | Images |
|---|---|---|
| Comparison with Poisson distribution Blue bars denote a histogram of data divided into 1 sec bins. Red curve is a Poisson curve with rate = median count rate of data. |
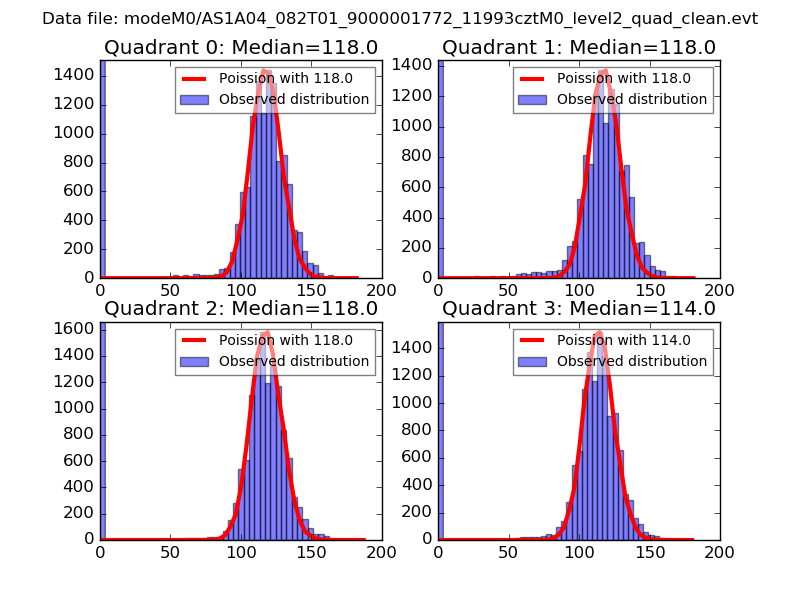 |
 |
| Quadrant-wise count rates Data is divided into 100 sec bins |
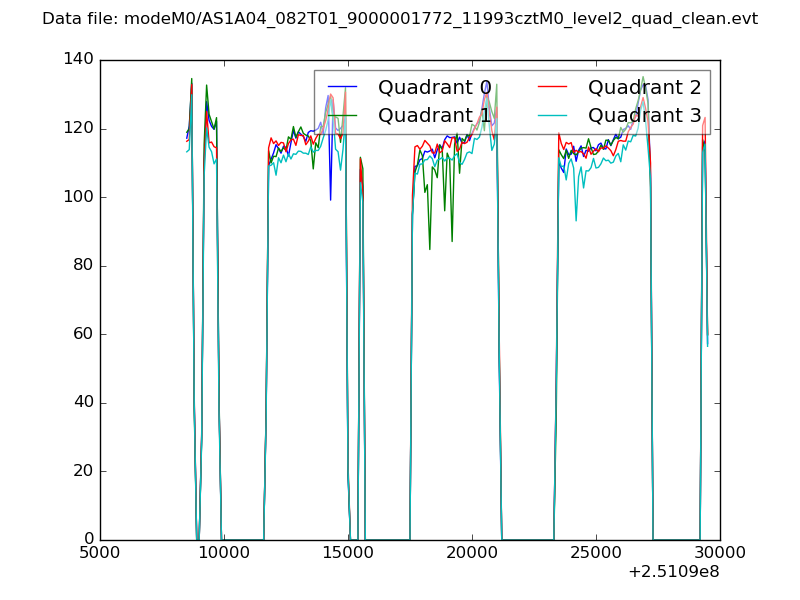 |
|
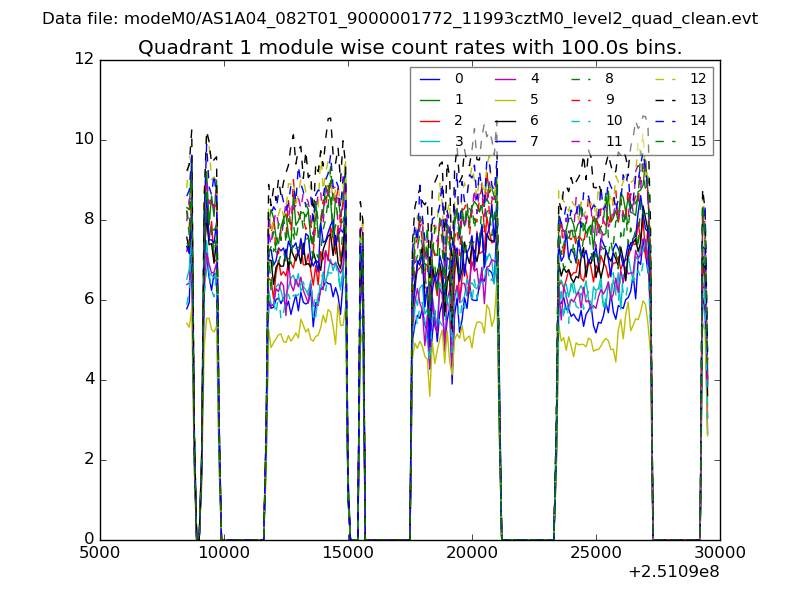
| Module-wise count rates for Quadrant A Data is divided into 100 sec bins |
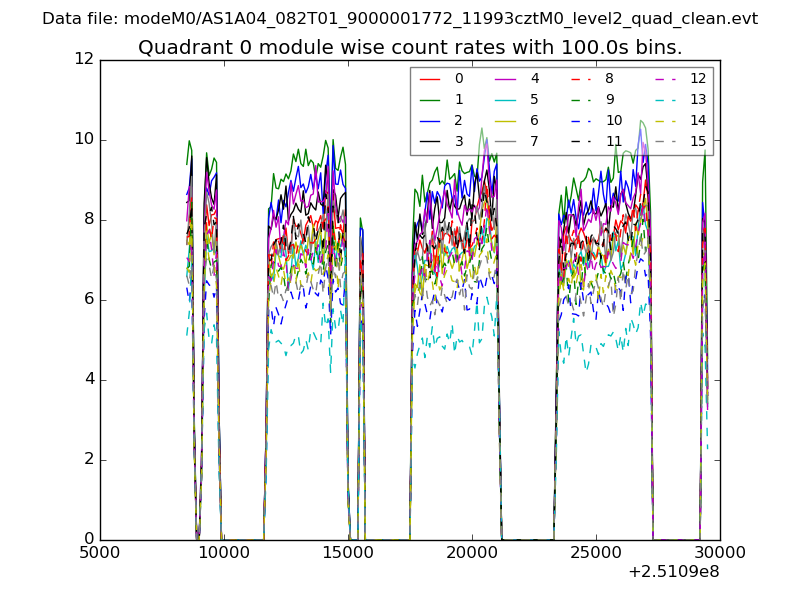 |
 |
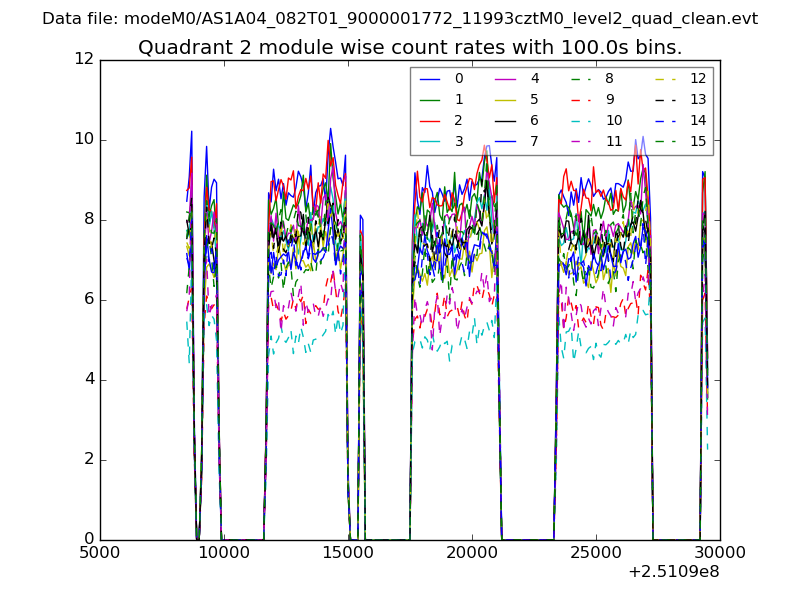
| Module-wise count rates for Quadrant B Data is divided into 100 sec bins |
 |
 |
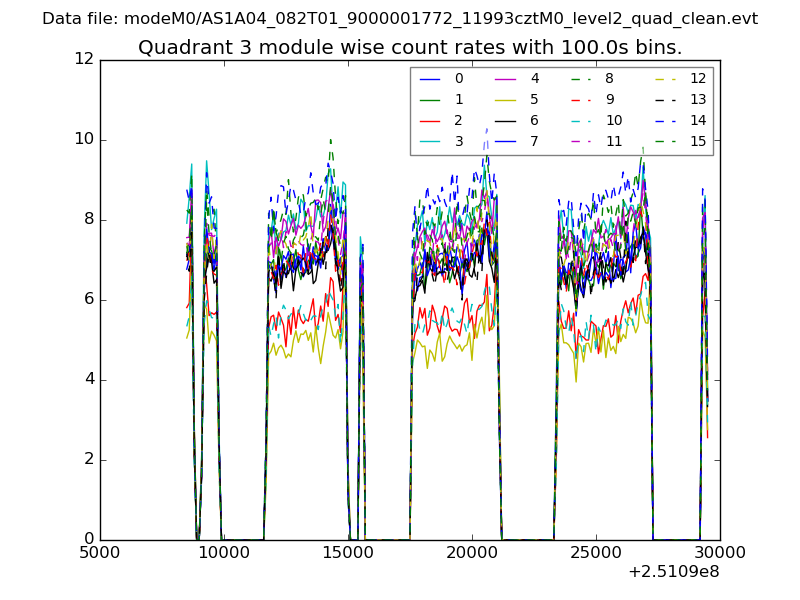
| Module-wise count rates for Quadrant C Data is divided into 100 sec bins |
 |
 |
| Module-wise count rates for Quadrant D Data is divided into 100 sec bins |
 |
 |
| Parameter | Plot |
|---|---|
| CZT HV Monitor | 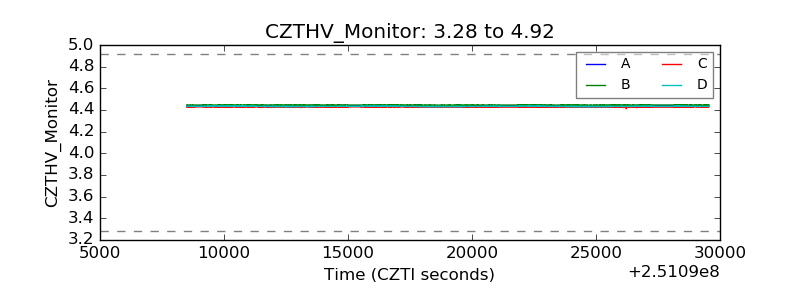 |
| D_VDD | 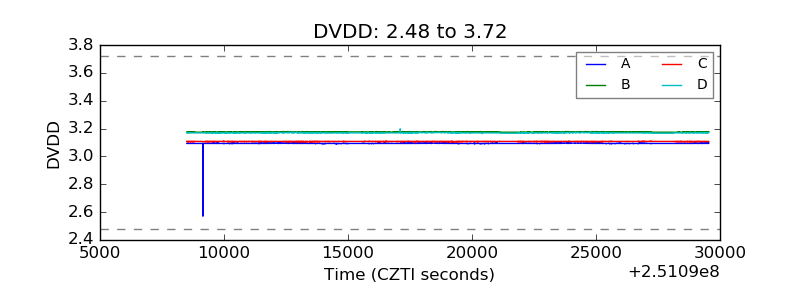 |
| Temperature 1 | 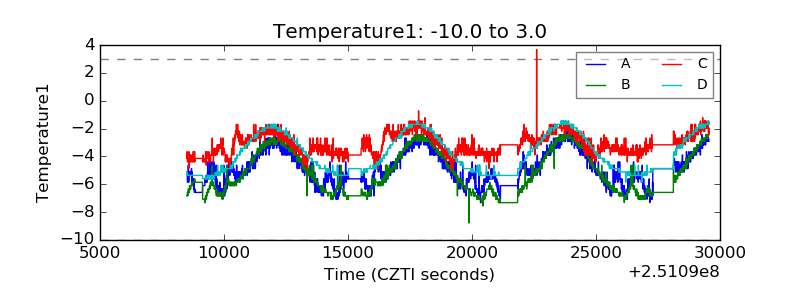 |
| Veto HV Monitor | 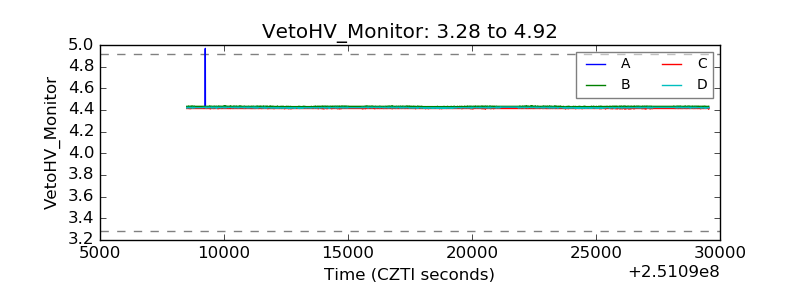 |
| Veto LLD | 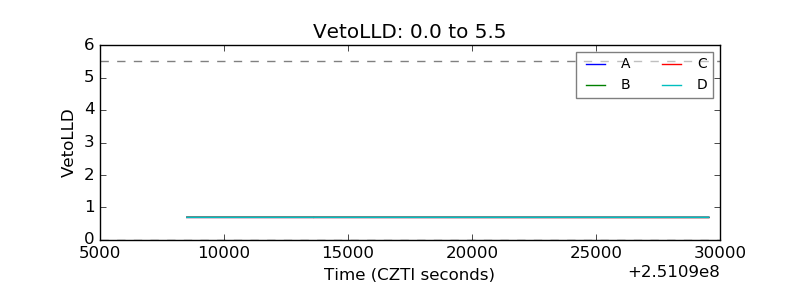 |
| Alpha Counter | 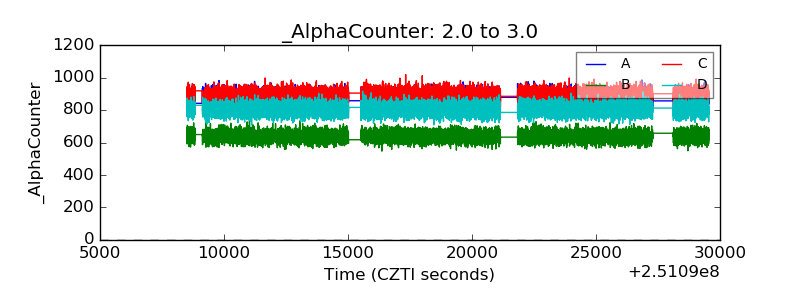 |
| _CPM_Rate | 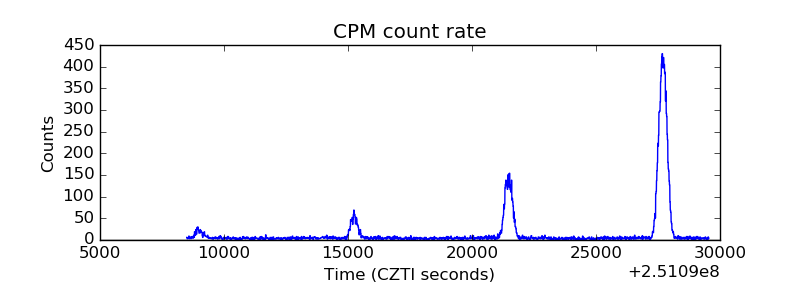 |
| CZT Counter | 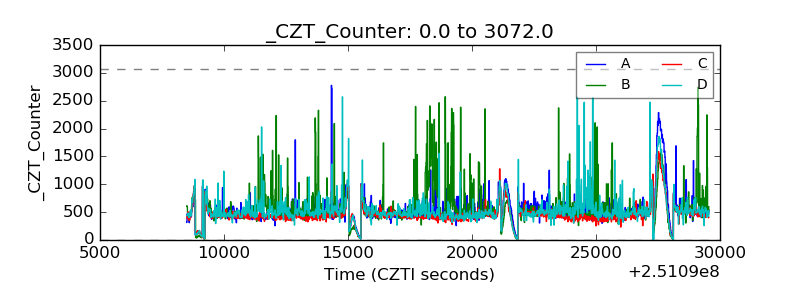 |
| +2.5 Volts monitor | 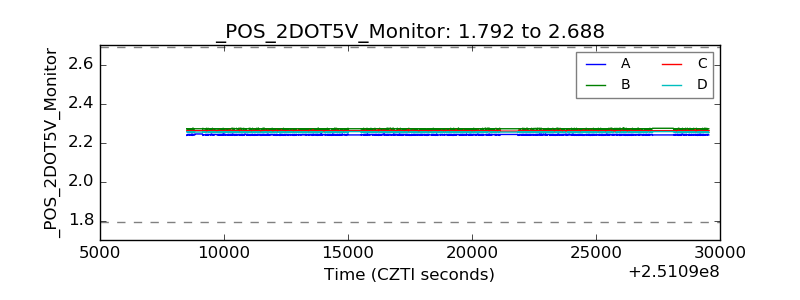 |
| +5 Volts monitor | 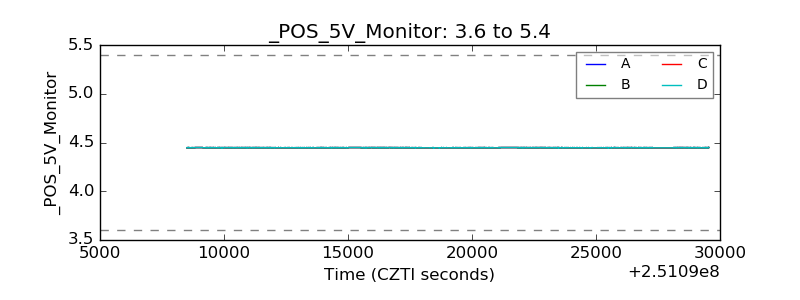 |
| _ROLL_ROT | 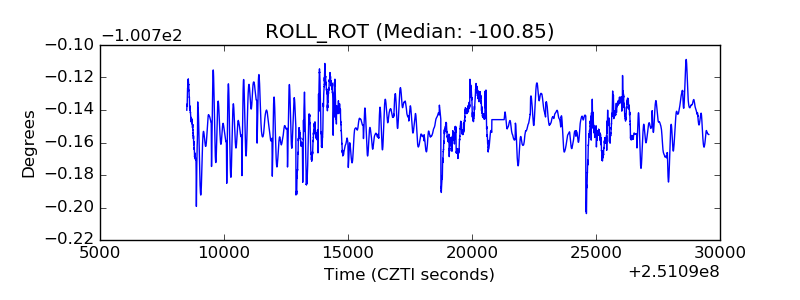 |
| _Roll_DEC | 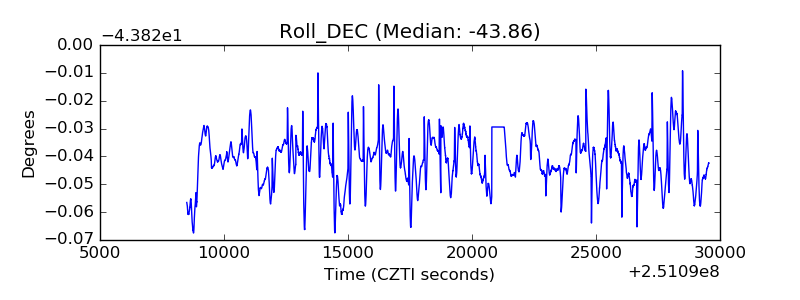 |
| _Roll_RA | 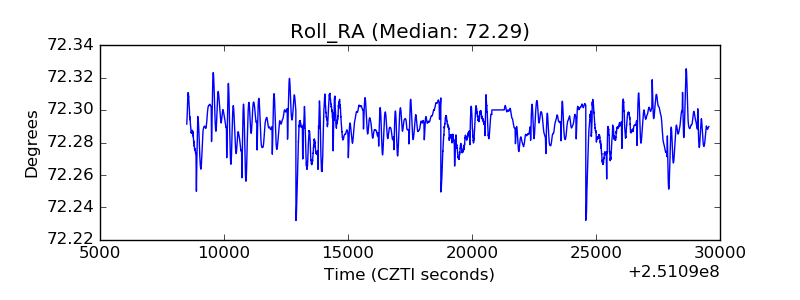 |
| Veto Counter | 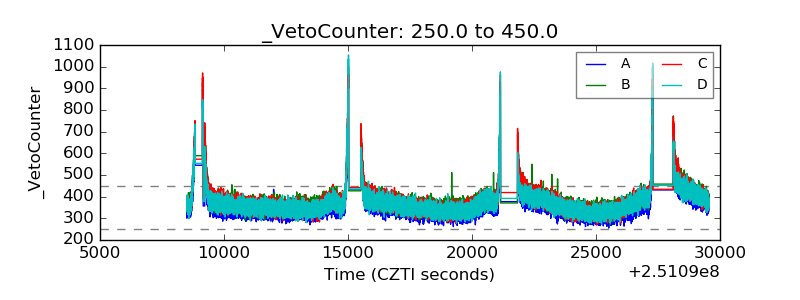 |