| Param | Original file | Final file |
|---|---|---|
| Filename | modeM0/AS1A04_082T01_9000001772_11997cztM0_level2.evt | modeM0/AS1A04_082T01_9000001772_11997cztM0_level2_quad_clean.evt |
| Size (bytes) | 169,853,760 | 40,821,120 |
| Size | 162.0 MB | 38.9 MB |
| Events in quadrant A | 1,125,851 | 278,323 |
| Events in quadrant B | 1,425,562 | 275,871 |
| Events in quadrant C | 910,293 | 271,993 |
| Events in quadrant D | 1,536,873 | 256,989 |
| Mode SS | |||
|---|---|---|---|
| Quadrant | BADHDUFLAG | Total packets | Discarded packets |
| A | 0 | 42 | 0 |
| B | 0 | 42 | 0 |
| C | 0 | 42 | 0 |
| D | 0 | 42 | 0 |
| Mode M0 | |||
|---|---|---|---|
| Quadrant | BADHDUFLAG | Total packets | Discarded packets |
| A | 0 | 4700 | 1 |
| B | 0 | 5620 | 0 |
| C | 0 | 4222 | 0 |
| D | 0 | 6050 | 0 |
| Quadrant | Total seconds | Saturated seconds | Saturation percentage |
|---|---|---|---|
| A | 2106 | 21 | 0.997151% |
| B | 2106 | 93 | 4.415954% |
| C | 2106 | 2 | 0.094967% |
| D | 2106 | 50 | 2.374169% |
Noise dominated data is calculated using 1-second bins in cleaned event files. If a bin has >2000 counts, and if more than 50% of those come from <1% of pixels, then it is considered to be noise-dominated and hence unusable.
| Quadrant | # 1 sec bins | Bins with >0 counts | Bins with >2000 counts | High rate bins dominated by noise | Noise dominated (total time) | Noise dominated (detector-on time) | Marked lightcurve |
|---|---|---|---|---|---|---|---|
| A | 2108 | 2108 | 2 | 2 | 0.09% | 0.09% | 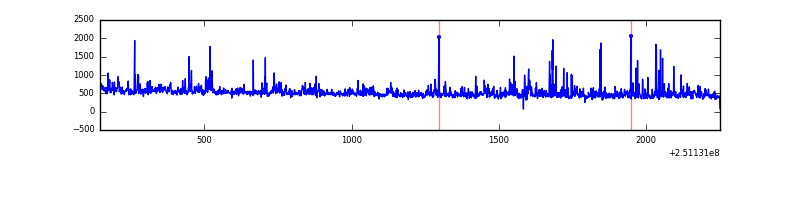 |
| B | 2108 | 2108 | 63 | 63 | 2.99% | 2.99% | 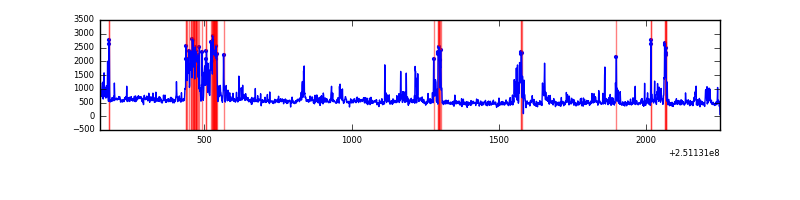 |
| C | 2108 | 2108 | 0 | 0 | 0.00% | 0.00% | 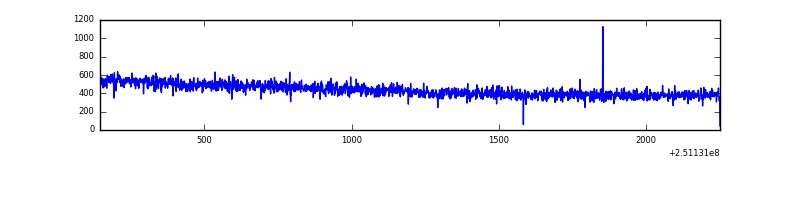 |
| D | 2108 | 2108 | 53 | 53 | 2.51% | 2.51% | 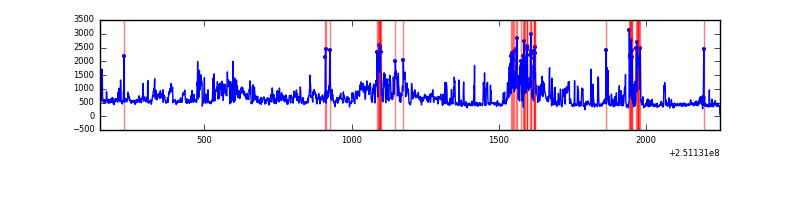 |
Top three noisy pixels from each quadrant. If the there are fewer than three noisy pixels in the level2.evt file, extra rows are filled as -1
| Pixel properties | Quadrant properties | ||||||
|---|---|---|---|---|---|---|---|
| Quadrant | DetID | PixID | Counts | Sigma | Mean | Median | Sigma |
| A | 1 | 162 | 66449 | 1264.35 | 249 | 245 | 52.4 |
| A | 1 | 178 | 34333 | 651.01 | 249 | 245 | 52.4 |
| A | 1 | 161 | 30693 | 581.49 | 249 | 245 | 52.4 |
| B | 4 | 239 | 275653 | 5696.57 | 245 | 240 | 48.3 |
| B | 11 | 51 | 68067 | 1402.92 | 245 | 240 | 48.3 |
| B | 15 | 204 | 46427 | 955.32 | 245 | 240 | 48.3 |
| C | 1 | 16 | 3858 | 66.02 | 232 | 233 | 54.9 |
| C | 13 | 61 | 1718 | 27.05 | 232 | 233 | 54.9 |
| C | 14 | 234 | 568 | 6.1 | 232 | 233 | 54.9 |
| D | 1 | 52 | 311671 | 5464.65 | 231 | 225 | 57.0 |
| D | 13 | 104 | 265792 | 4659.66 | 231 | 225 | 57.0 |
| D | 8 | 195 | 35831 | 624.75 | 231 | 225 | 57.0 |
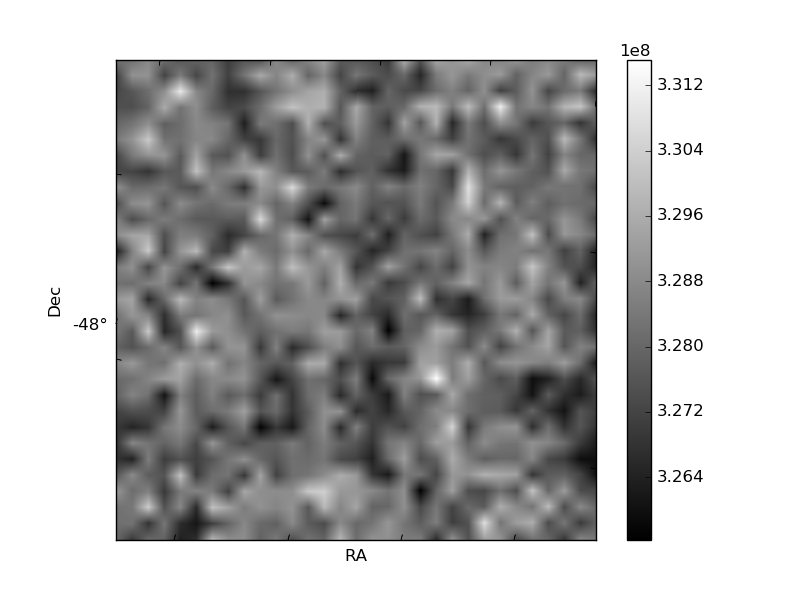
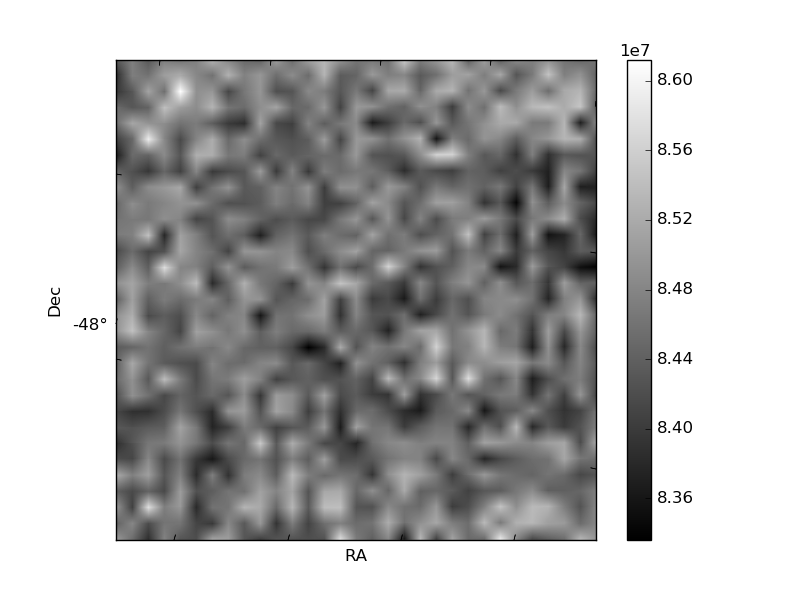
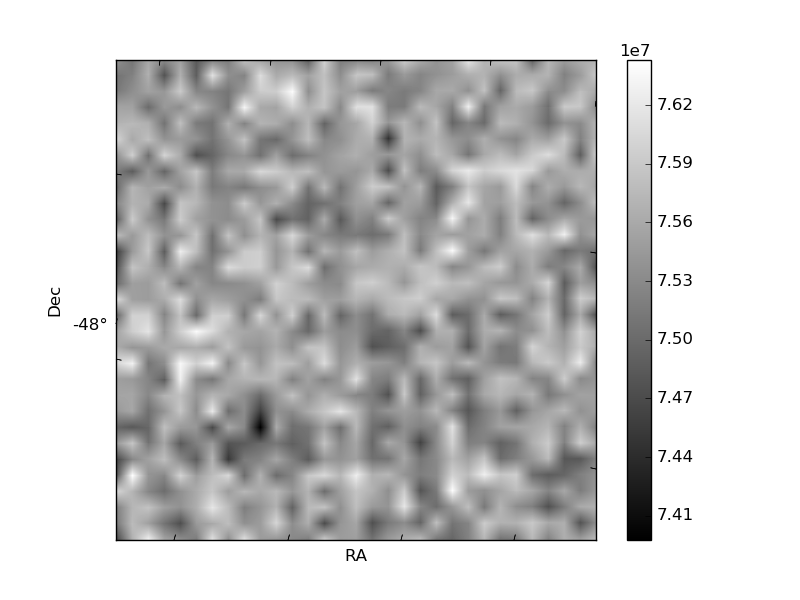
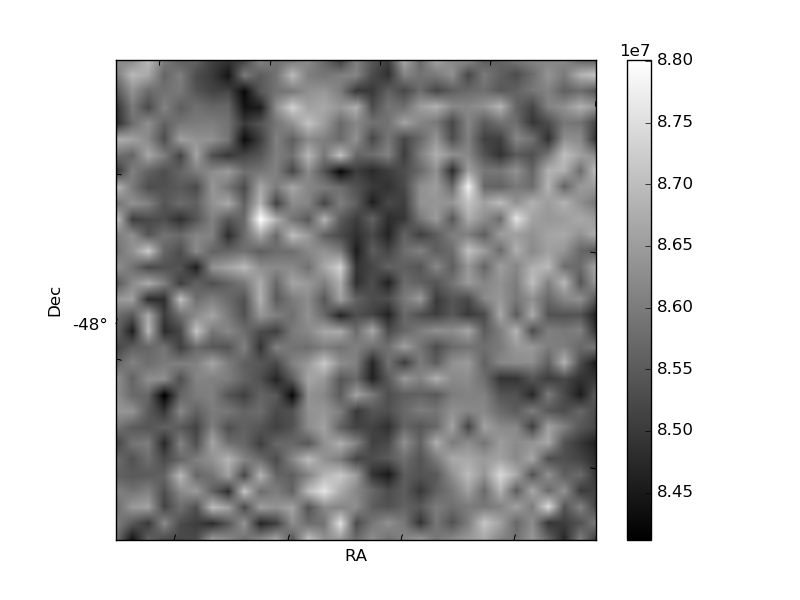
Histogram calculated using DETX and DETY for each event in the final _common_clean file
| Quadrant A | 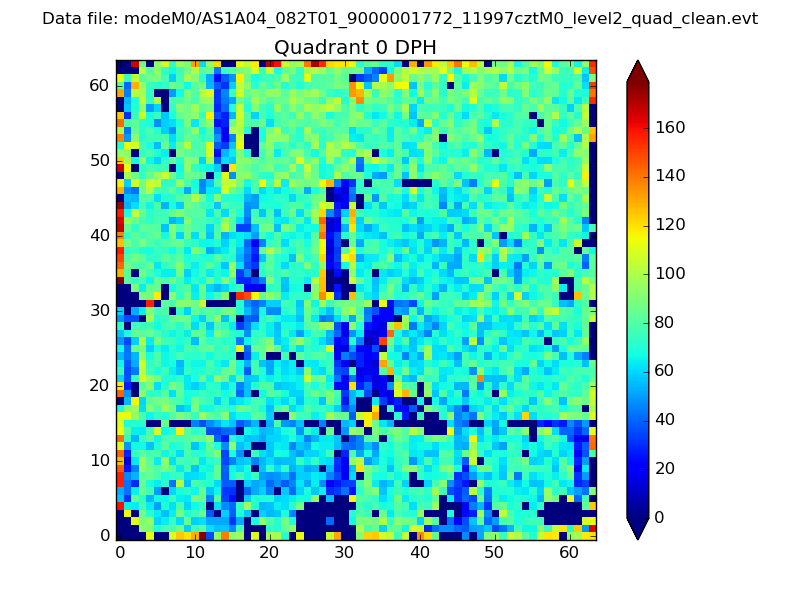 |
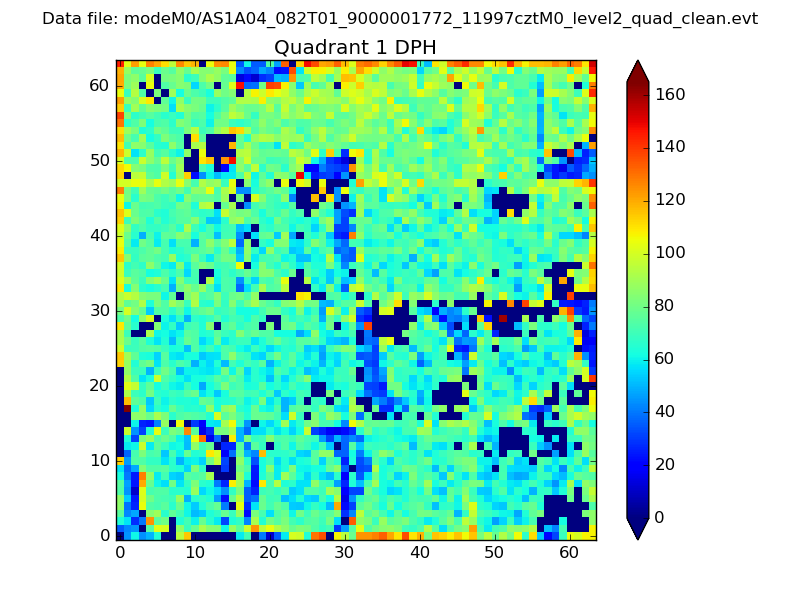 |
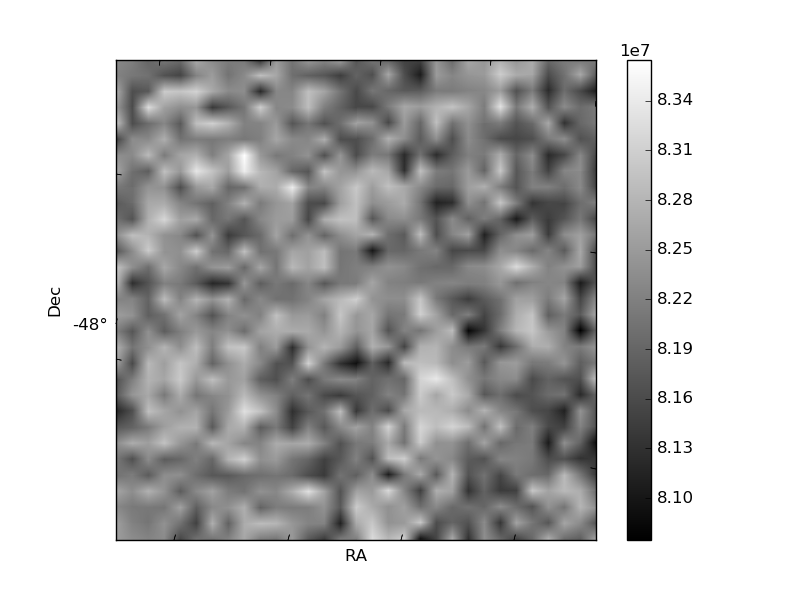
Quadrant B |
|---|---|---|---|
| Quadrant D | 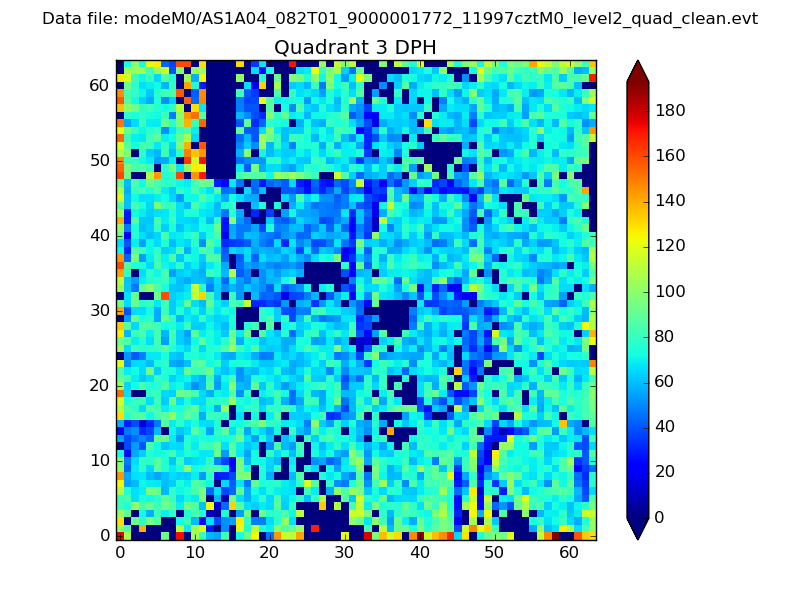 |
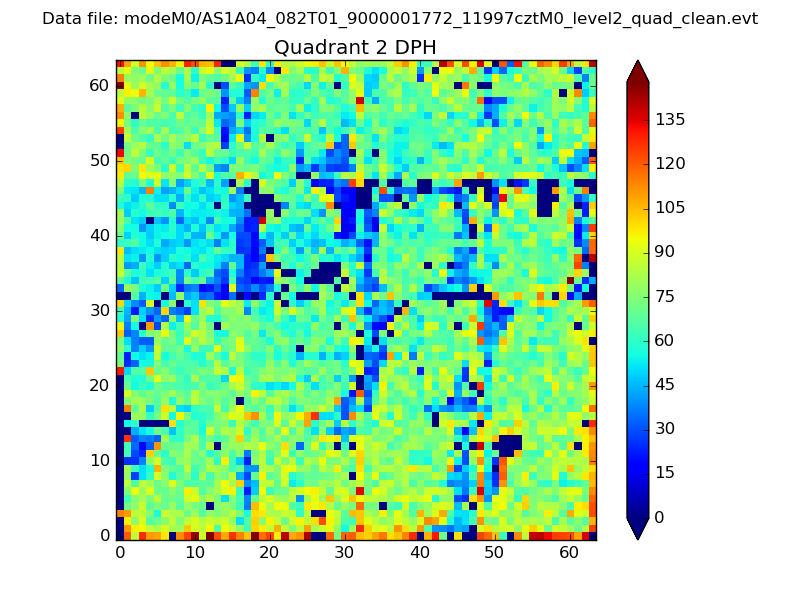 |
Quadrant C |
| Plot type | Count rate plots | Images |
|---|---|---|
| Comparison with Poisson distribution Blue bars denote a histogram of data divided into 1 sec bins. Red curve is a Poisson curve with rate = median count rate of data. |
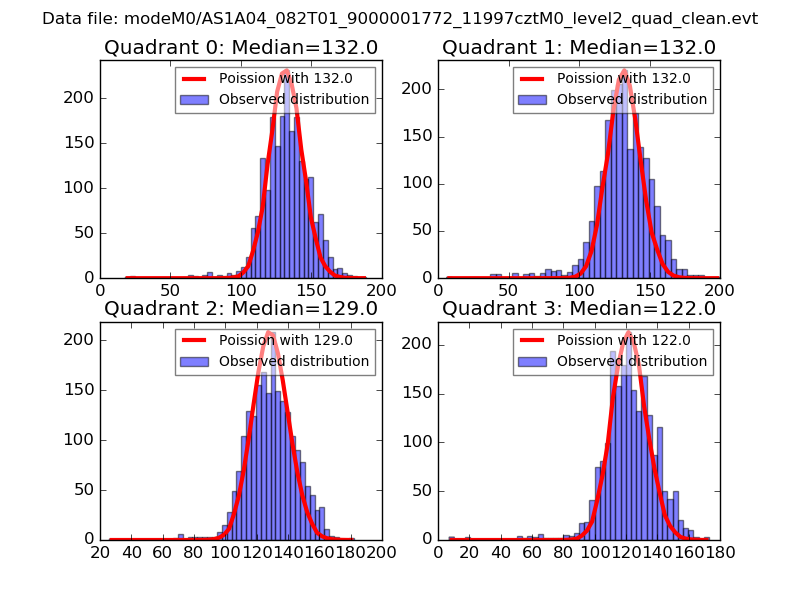 |
 |
| Quadrant-wise count rates Data is divided into 100 sec bins |
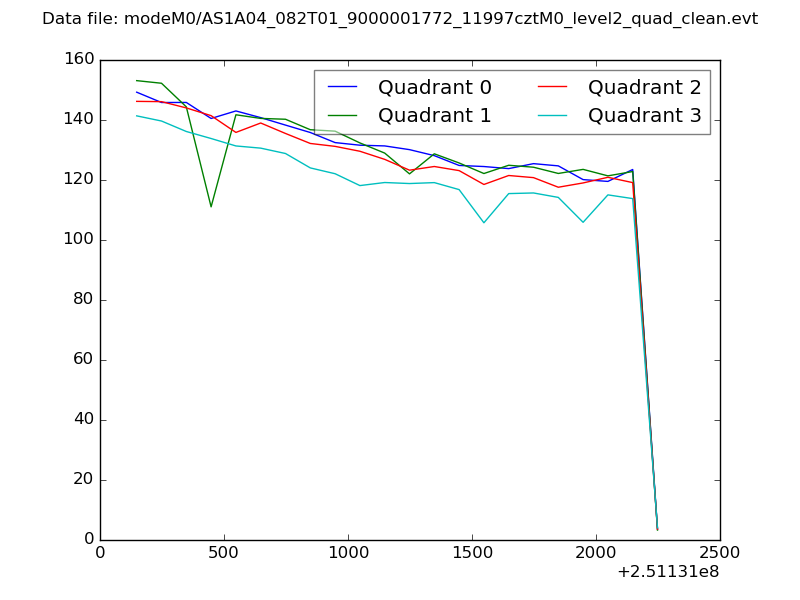 |
|
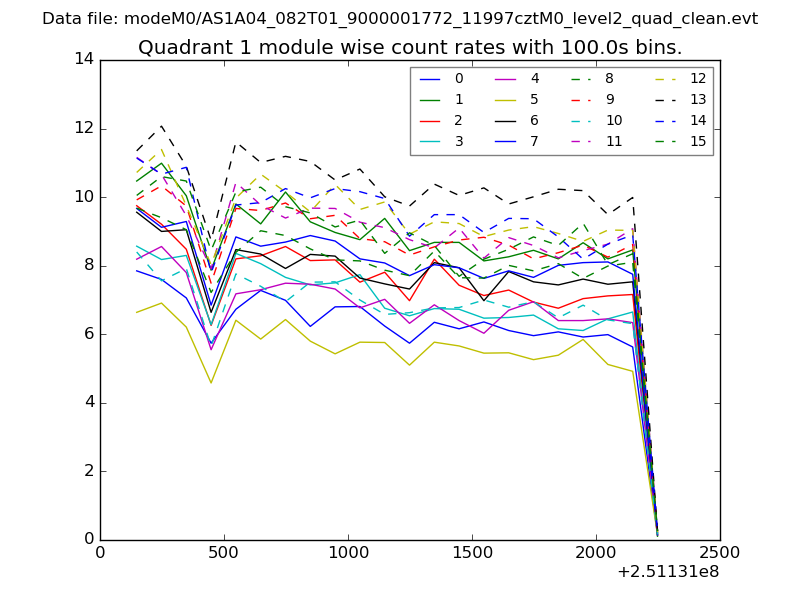
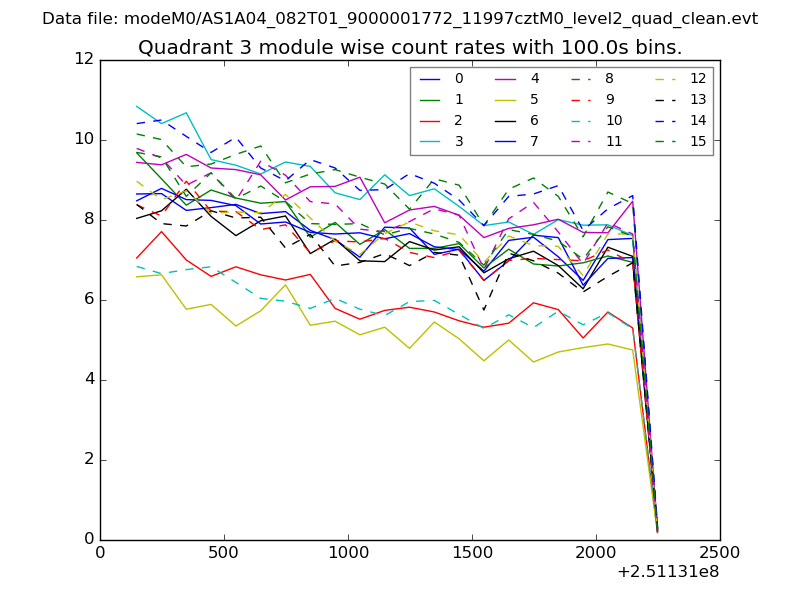
| Module-wise count rates for Quadrant A Data is divided into 100 sec bins |
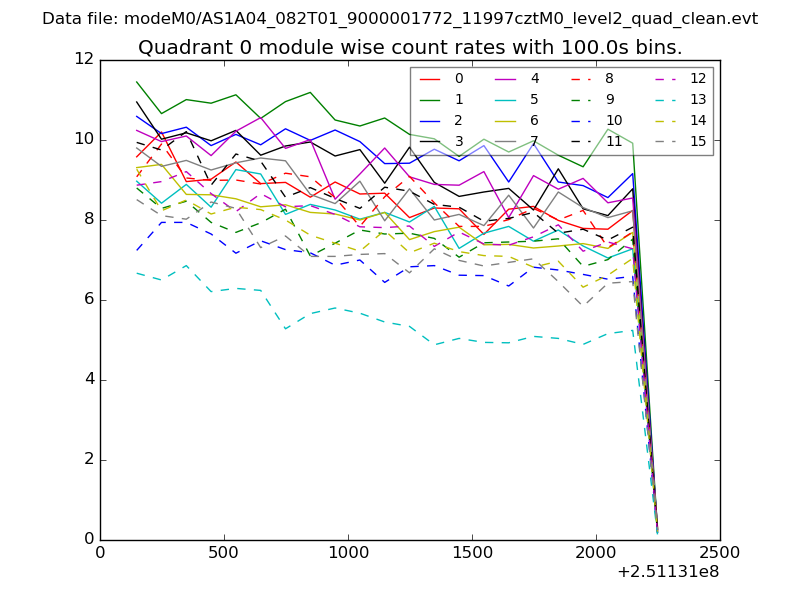 |
 |
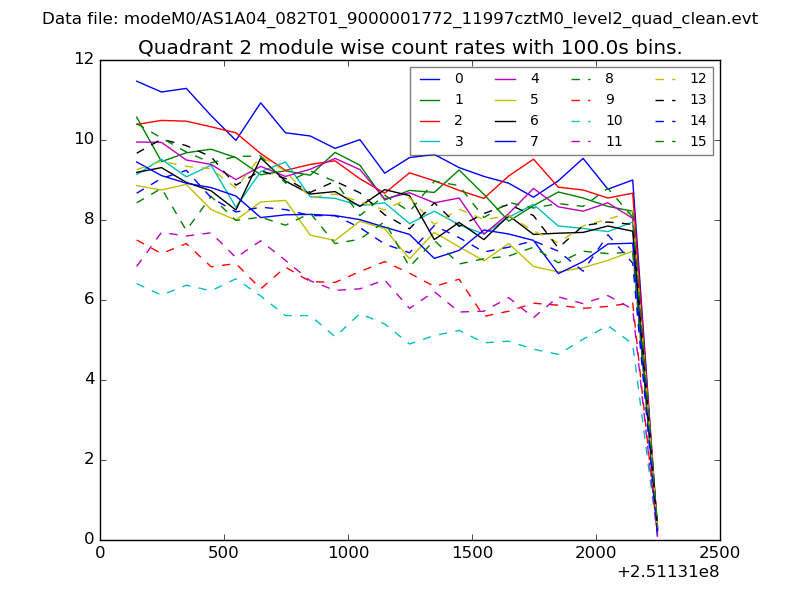
| Module-wise count rates for Quadrant B Data is divided into 100 sec bins |
 |
 |
| Module-wise count rates for Quadrant C Data is divided into 100 sec bins |
 |
 |
| Module-wise count rates for Quadrant D Data is divided into 100 sec bins |
 |
 |
| Parameter | Plot |
|---|---|
| CZT HV Monitor | 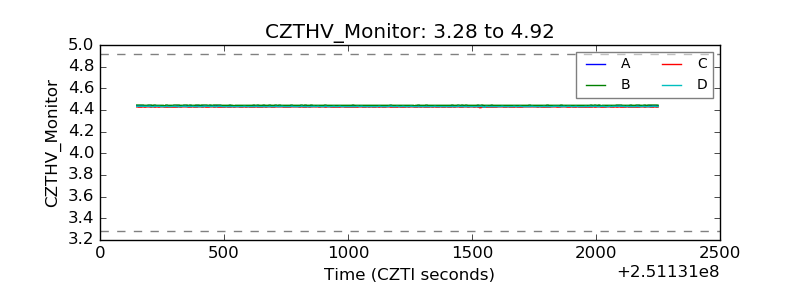 |
| D_VDD | 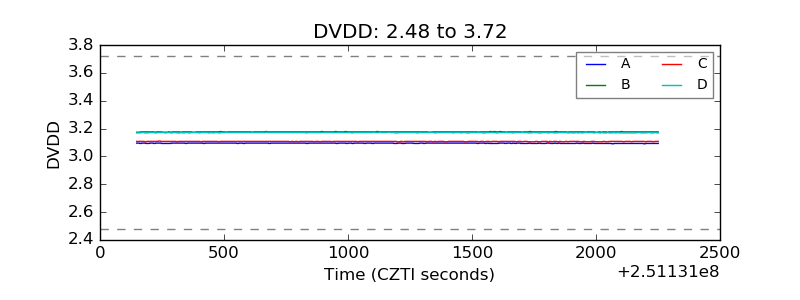 |
| Temperature 1 | 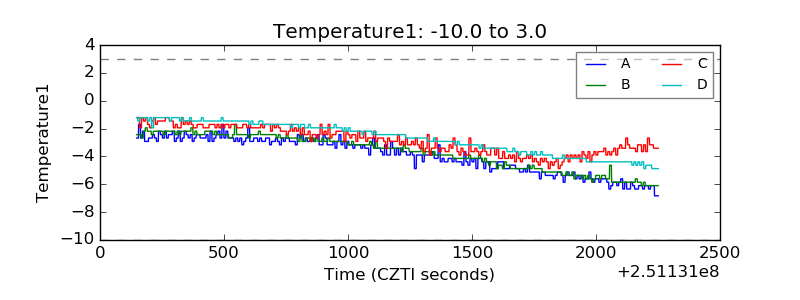 |
| Veto HV Monitor | 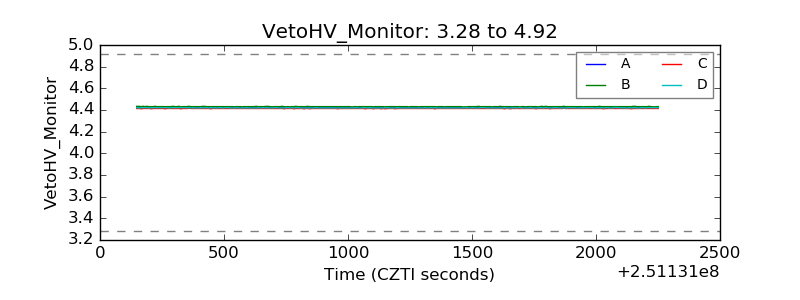 |
| Veto LLD | 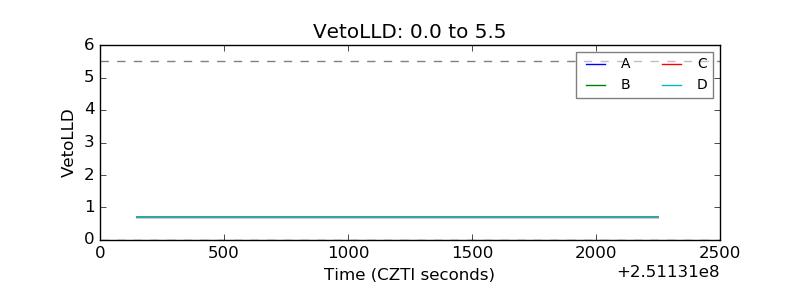 |
| Alpha Counter | 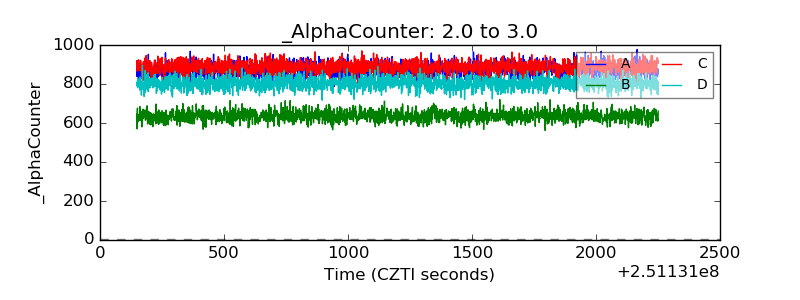 |
| _CPM_Rate | 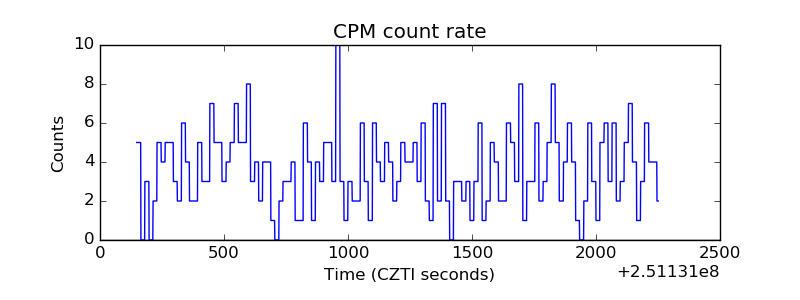 |
| CZT Counter | 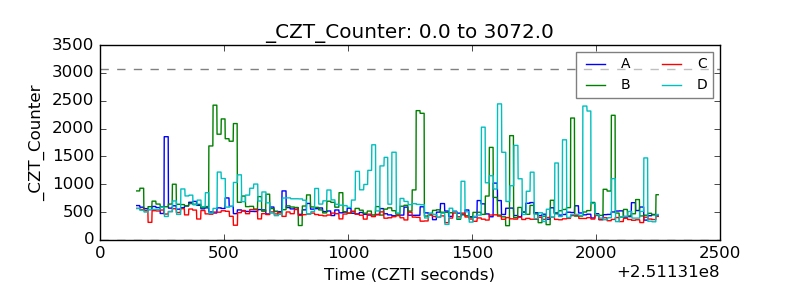 |
| +2.5 Volts monitor |  |
| +5 Volts monitor |  |
| _ROLL_ROT | 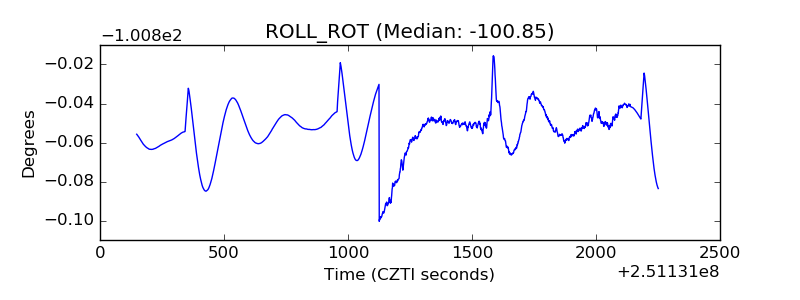 |
| _Roll_DEC | 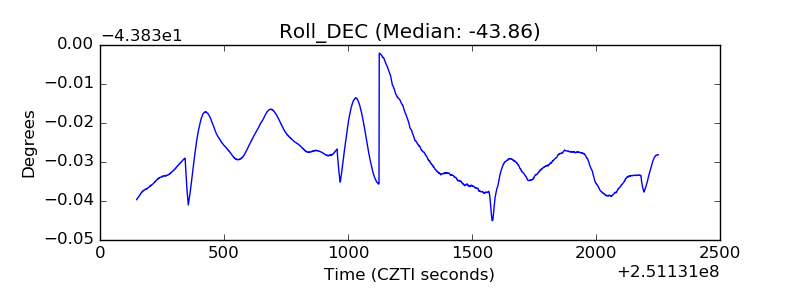 |
| _Roll_RA | 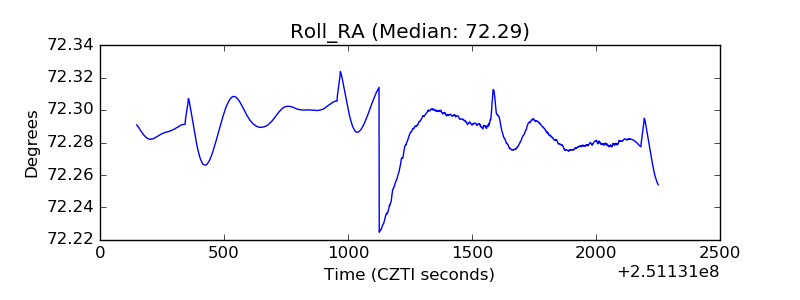 |
| Veto Counter | 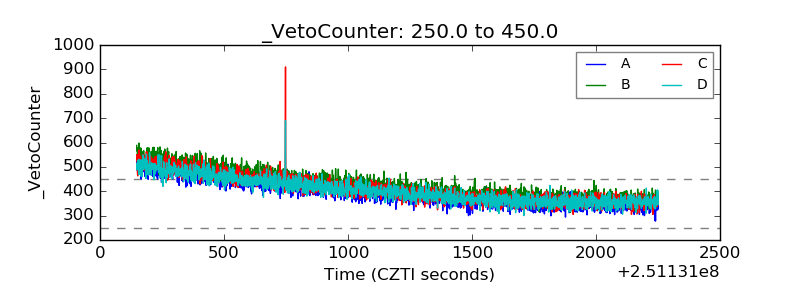 |