| Param | Original file | Final file |
|---|---|---|
| Filename | modeM0/AS1G08_024T03_9000001774cztM0_level2.fits | modeM0/AS1G08_024T03_9000001774cztM0_level2_quad_clean.evt |
| Size (bytes) | 459,190,080 | 474,007,680 |
| Size | 437.9 MB | 452.0 MB |
| Events in quadrant A | 2,776,794 | 2,907,763 |
| Events in quadrant B | 2,604,330 | 2,755,630 |
| Events in quadrant C | 2,775,418 | 2,772,836 |
| Events in quadrant D | 2,364,588 | 2,535,628 |
| Mode SS | |||
|---|---|---|---|
| Quadrant | BADHDUFLAG | Total packets | Discarded packets |
| A | 0 | 1004 | 0 |
| B | 0 | 1004 | 0 |
| C | 0 | 1004 | 0 |
| D | 0 | 1004 | 0 |
| Mode M9 | |||
|---|---|---|---|
| Quadrant | BADHDUFLAG | Total packets | Discarded packets |
| A | 0 | 76 | 0 |
| B | 0 | 76 | 0 |
| C | 0 | 76 | 0 |
| D | 0 | 76 | 0 |
| Mode M0 | |||
|---|---|---|---|
| Quadrant | BADHDUFLAG | Total packets | Discarded packets |
| A | 0 | 108324 | 0 |
| B | 0 | 133702 | 0 |
| C | 0 | 101554 | 0 |
| D | 0 | 120311 | 0 |
| Quadrant | Total seconds | Saturated seconds | Saturation percentage |
|---|---|---|---|
| A | 49305 | 693 | 1.405537% |
| B | 49305 | 3833 | 7.774059% |
| C | 49305 | 266 | 0.539499% |
| D | 49305 | 1531 | 3.105162% |
Noise dominated data is calculated using 1-second bins in cleaned event files. If a bin has >2000 counts, and if more than 50% of those come from <1% of pixels, then it is considered to be noise-dominated and hence unusable.
| Quadrant | # 1 sec bins | Bins with >0 counts | Bins with >2000 counts | High rate bins dominated by noise | Noise dominated (total time) | Noise dominated (detector-on time) | Marked lightcurve |
|---|---|---|---|---|---|---|---|
| A | 56955 | 49299 | 0 | 0 | 0.00% | 0.00% |  |
| B | 56955 | 49074 | 0 | 0 | 0.00% | 0.00% |  |
| C | 56955 | 49301 | 0 | 0 | 0.00% | 0.00% |  |
| D | 56955 | 49233 | 0 | 0 | 0.00% | 0.00% |  |
Top three noisy pixels from each quadrant. If the there are fewer than three noisy pixels in the level2.evt file, extra rows are filled as -1
| Pixel properties | Quadrant properties | ||||||
|---|---|---|---|---|---|---|---|
| Quadrant | DetID | PixID | Counts | Sigma | Mean | Median | Sigma |
| A | 0 | 29 | 2678 | 10.99 | 723 | 678 | 182.0 |
| A | 7 | 110 | 2274 | 8.77 | 723 | 678 | 182.0 |
| A | 0 | 30 | 2157 | 8.13 | 723 | 678 | 182.0 |
| B | 2 | 9 | 2240 | 11.39 | 689 | 656 | 139.1 |
| B | 12 | 226 | 1793 | 8.18 | 689 | 656 | 139.1 |
| B | 3 | 17 | 1770 | 8.01 | 689 | 656 | 139.1 |
| C | 12 | 241 | 1961 | 6.78 | 733 | 684 | 188.5 |
| C | 9 | 188 | 1806 | 5.95 | 733 | 684 | 188.5 |
| C | 2 | 191 | 1800 | 5.92 | 733 | 684 | 188.5 |
| D | 3 | 14 | 1767 | 6.34 | 674 | 613 | 182.1 |
| D | 6 | 231 | 1700 | 5.97 | 674 | 613 | 182.1 |
| D | 10 | 189 | 1684 | 5.88 | 674 | 613 | 182.1 |
Histogram calculated using DETX and DETY for each event in the final _common_clean file
| Quadrant A |  |
 |
Quadrant B |
|---|---|---|---|
| Quadrant D |  |
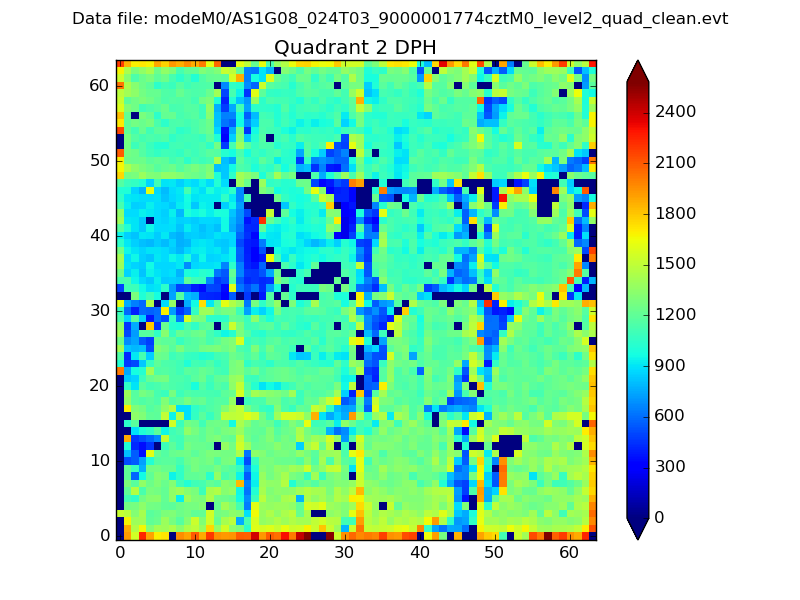 |
Quadrant C |
| Plot type | Count rate plots | Images |
|---|---|---|
| Comparison with Poisson distribution Blue bars denote a histogram of data divided into 1 sec bins. Red curve is a Poisson curve with rate = median count rate of data. |
 |
 |
| Quadrant-wise count rates Data is divided into 100 sec bins |
 |
|
| Module-wise count rates for Quadrant A Data is divided into 100 sec bins |
 |
 |
| Module-wise count rates for Quadrant B Data is divided into 100 sec bins |
 |
 |
| Module-wise count rates for Quadrant C Data is divided into 100 sec bins |
 |
 |
| Module-wise count rates for Quadrant D Data is divided into 100 sec bins |
 |
 |
| Parameter | Plot |
|---|---|
| CZT HV Monitor |  |
| D_VDD |  |
| Temperature 1 |  |
| Veto HV Monitor |  |
| Veto LLD |  |
| Alpha Counter |  |
| _CPM_Rate |  |
| CZT Counter |  |
| +2.5 Volts monitor |  |
| +5 Volts monitor |  |
| _ROLL_ROT |  |
| _Roll_DEC |  |
| _Roll_RA |  |
| Veto Counter |  |