| Param | Original file | Final file |
|---|---|---|
| Filename | modeM0/AS1G08_024T03_9000001774_11997cztM0_level2.evt | modeM0/AS1G08_024T03_9000001774_11997cztM0_level2_quad_clean.evt |
| Size (bytes) | 193,662,720 | 32,204,160 |
| Size | 184.7 MB | 30.7 MB |
| Events in quadrant A | 1,356,724 | 205,642 |
| Events in quadrant B | 1,707,651 | 201,802 |
| Events in quadrant C | 1,224,473 | 202,945 |
| Events in quadrant D | 1,415,822 | 196,203 |
| Mode SS | |||
|---|---|---|---|
| Quadrant | BADHDUFLAG | Total packets | Discarded packets |
| A | 0 | 48 | 0 |
| B | 0 | 48 | 0 |
| C | 0 | 48 | 0 |
| D | 0 | 48 | 0 |
| Mode M9 | |||
|---|---|---|---|
| Quadrant | BADHDUFLAG | Total packets | Discarded packets |
| A | 0 | 12 | 0 |
| B | 0 | 12 | 0 |
| C | 0 | 12 | 0 |
| D | 0 | 12 | 0 |
| Mode M0 | |||
|---|---|---|---|
| Quadrant | BADHDUFLAG | Total packets | Discarded packets |
| A | 0 | 5649 | 2 |
| B | 0 | 6767 | 1 |
| C | 0 | 5195 | 1 |
| D | 0 | 5776 | 1 |
| Quadrant | Total seconds | Saturated seconds | Saturation percentage |
|---|---|---|---|
| A | 2333 | 69 | 2.957565% |
| B | 2333 | 213 | 9.129876% |
| C | 2333 | 39 | 1.671667% |
| D | 2333 | 58 | 2.486069% |
Noise dominated data is calculated using 1-second bins in cleaned event files. If a bin has >2000 counts, and if more than 50% of those come from <1% of pixels, then it is considered to be noise-dominated and hence unusable.
| Quadrant | # 1 sec bins | Bins with >0 counts | Bins with >2000 counts | High rate bins dominated by noise | Noise dominated (total time) | Noise dominated (detector-on time) | Marked lightcurve |
|---|---|---|---|---|---|---|---|
| A | 3569 | 2334 | 0 | 0 | 0.00% | 0.00% | 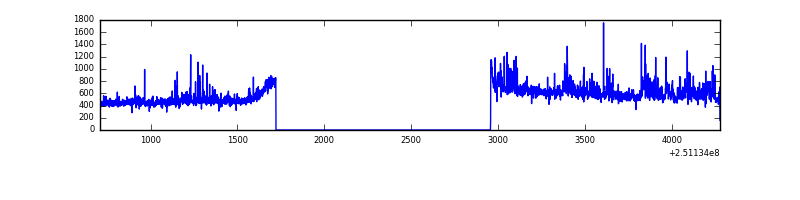 |
| B | 3568 | 2333 | 116 | 116 | 3.25% | 4.97% | 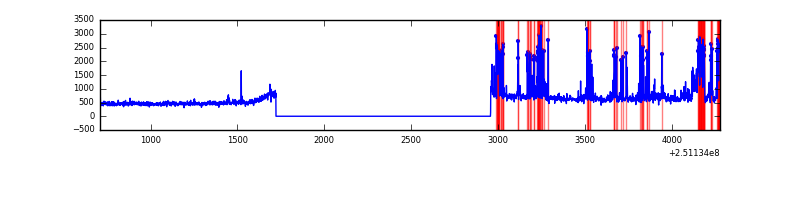 |
| C | 3569 | 2334 | 0 | 0 | 0.00% | 0.00% | 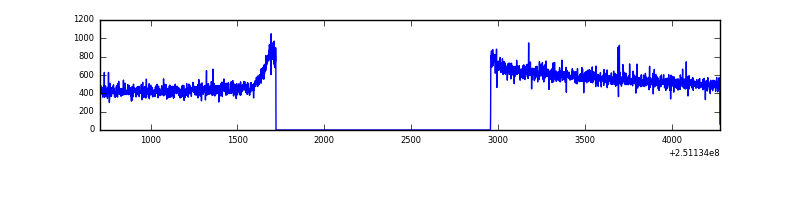 |
| D | 3569 | 2334 | 10 | 10 | 0.28% | 0.43% | 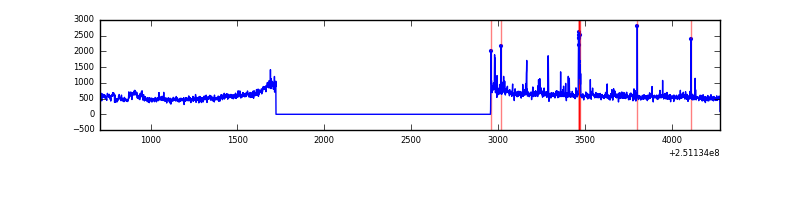 |
Top three noisy pixels from each quadrant. If the there are fewer than three noisy pixels in the level2.evt file, extra rows are filled as -1
| Pixel properties | Quadrant properties | ||||||
|---|---|---|---|---|---|---|---|
| Quadrant | DetID | PixID | Counts | Sigma | Mean | Median | Sigma |
| A | 1 | 162 | 39947 | 605.38 | 321 | 314 | 65.5 |
| A | 1 | 178 | 20148 | 302.96 | 321 | 314 | 65.5 |
| A | 1 | 161 | 17919 | 268.91 | 321 | 314 | 65.5 |
| B | 4 | 239 | 355775 | 5979.21 | 309 | 302 | 59.5 |
| B | 15 | 204 | 55185 | 923.16 | 309 | 302 | 59.5 |
| B | 0 | 85 | 34027 | 567.27 | 309 | 302 | 59.5 |
| C | 1 | 16 | 7922 | 104.53 | 311 | 313 | 72.8 |
| C | 13 | 61 | 2245 | 26.54 | 311 | 313 | 72.8 |
| C | 14 | 234 | 1033 | 9.89 | 311 | 313 | 72.8 |
| D | 1 | 52 | 118015 | 1574.12 | 310 | 301 | 74.8 |
| D | 13 | 104 | 32692 | 433.15 | 310 | 301 | 74.8 |
| D | 8 | 195 | 30863 | 408.69 | 310 | 301 | 74.8 |
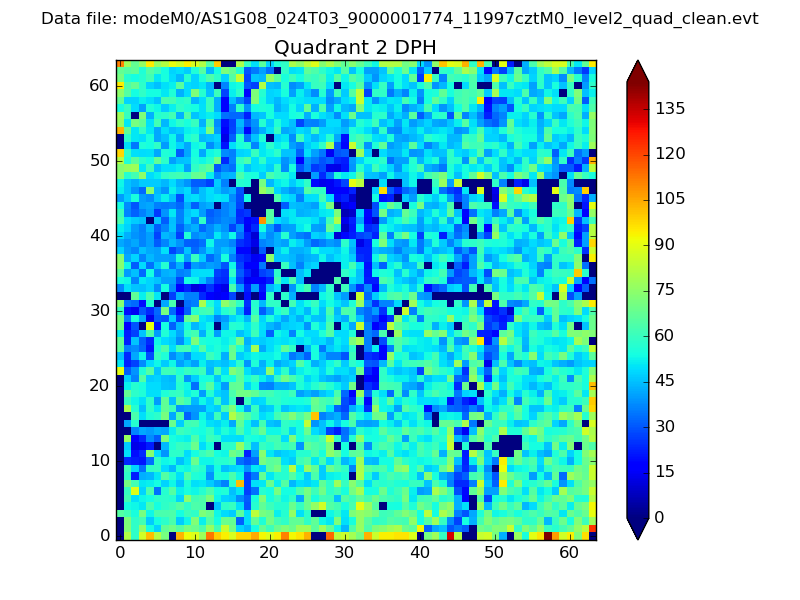
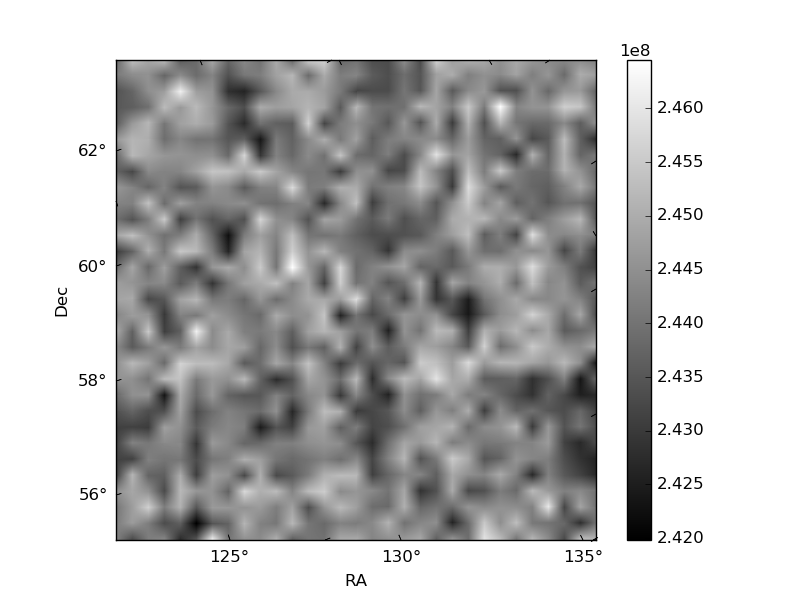
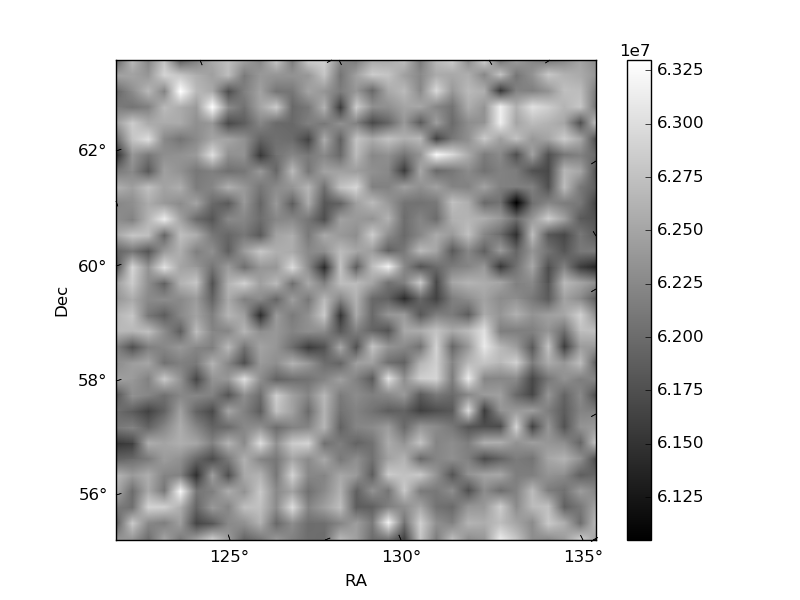
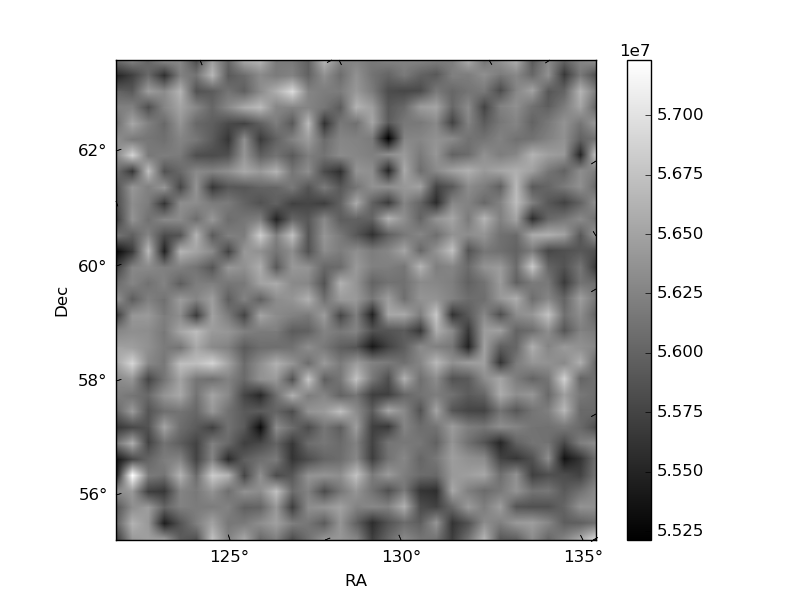
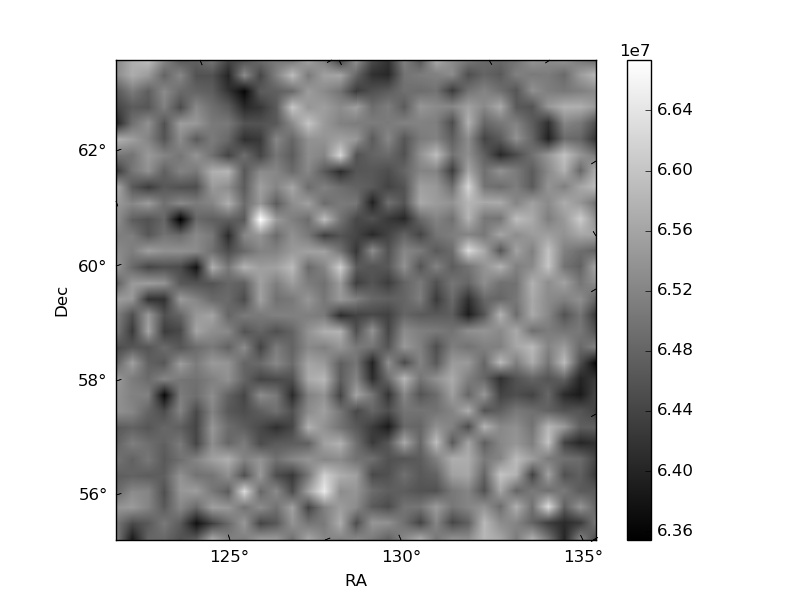
Histogram calculated using DETX and DETY for each event in the final _common_clean file
| Quadrant A | 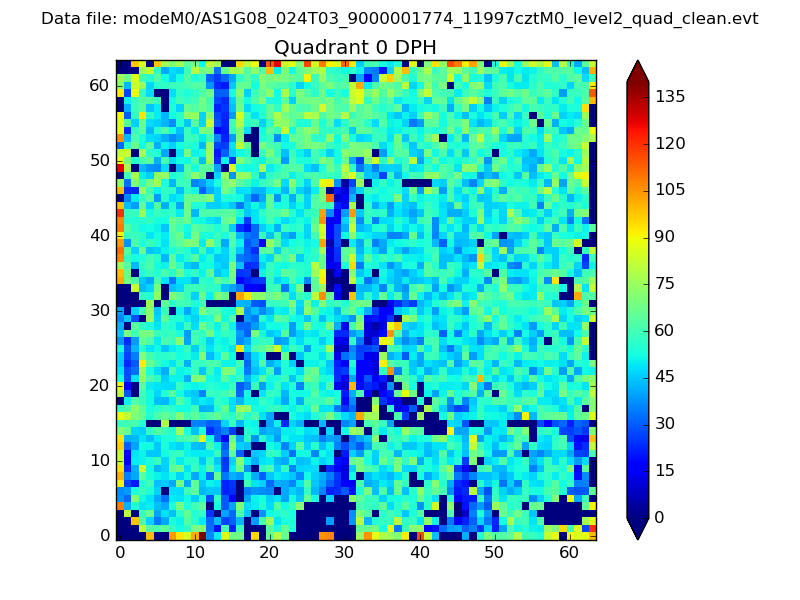 |
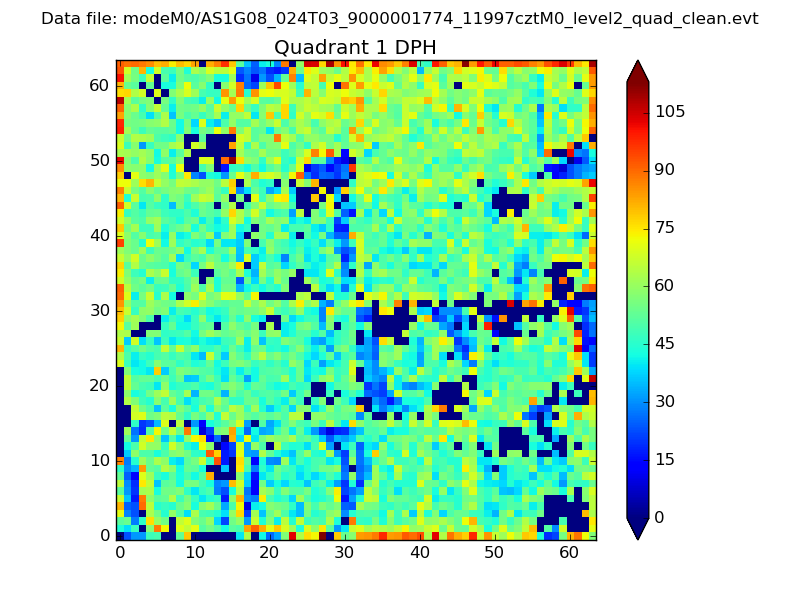 |
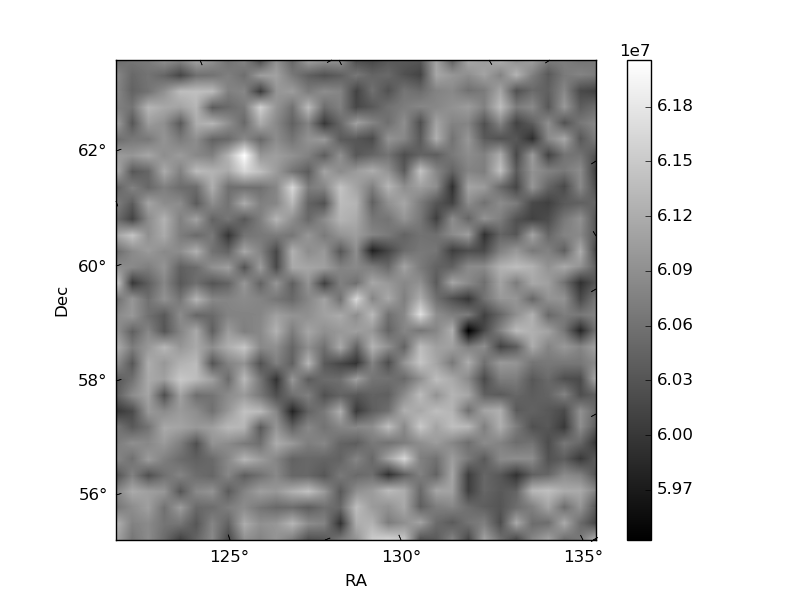
Quadrant B |
|---|---|---|---|
| Quadrant D | 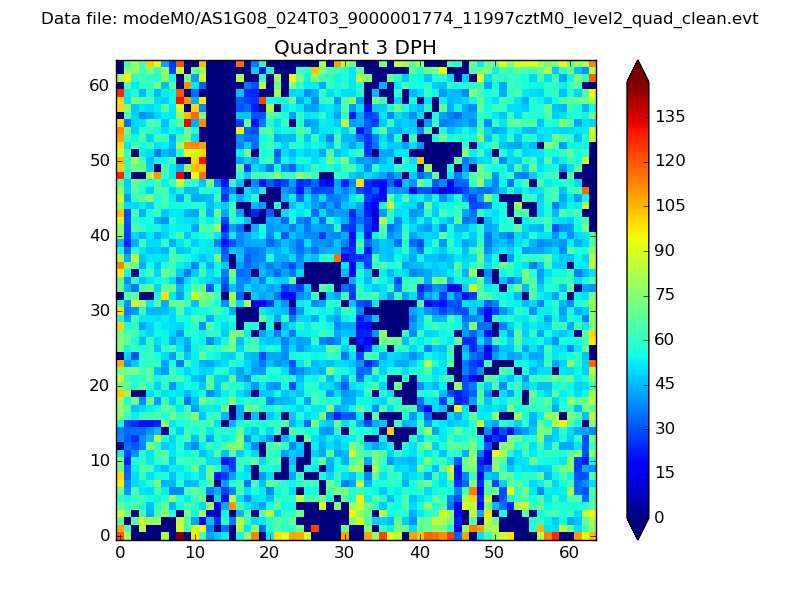 |
 |
Quadrant C |
| Plot type | Count rate plots | Images |
|---|---|---|
| Comparison with Poisson distribution Blue bars denote a histogram of data divided into 1 sec bins. Red curve is a Poisson curve with rate = median count rate of data. |
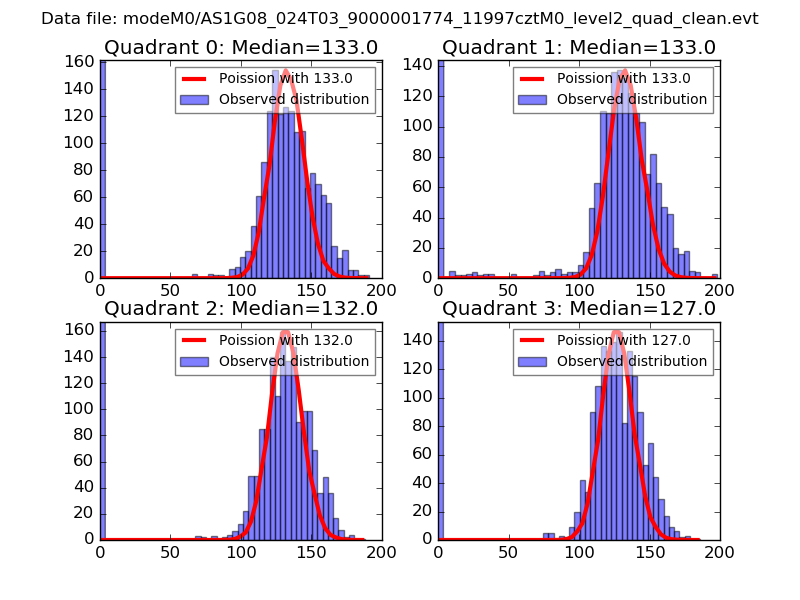 |
 |
| Quadrant-wise count rates Data is divided into 100 sec bins |
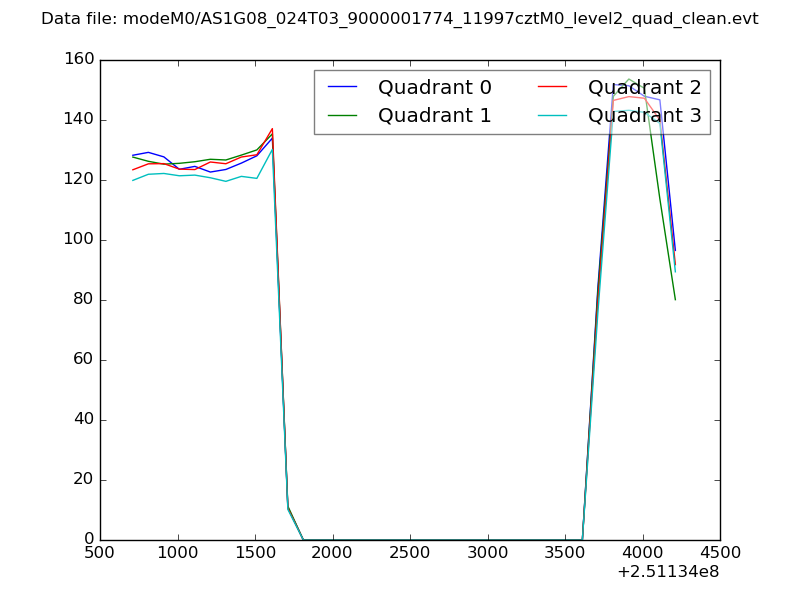 |
|
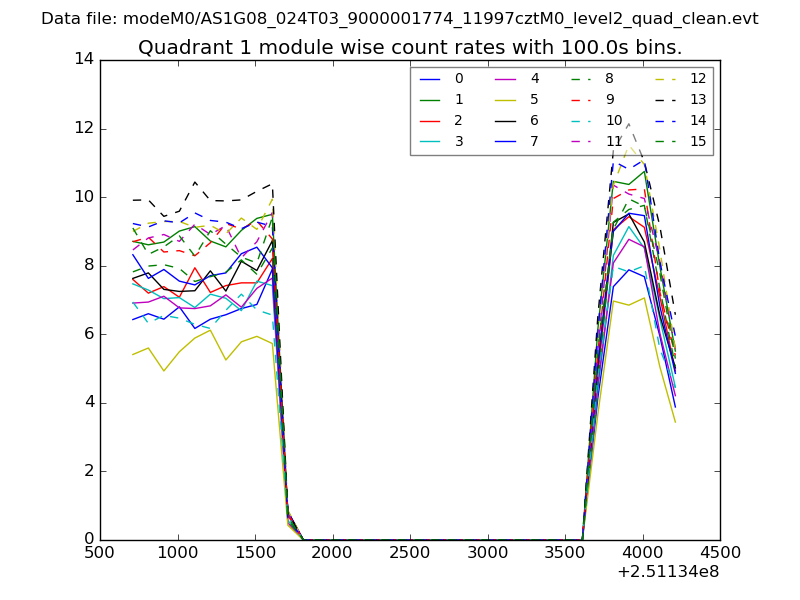
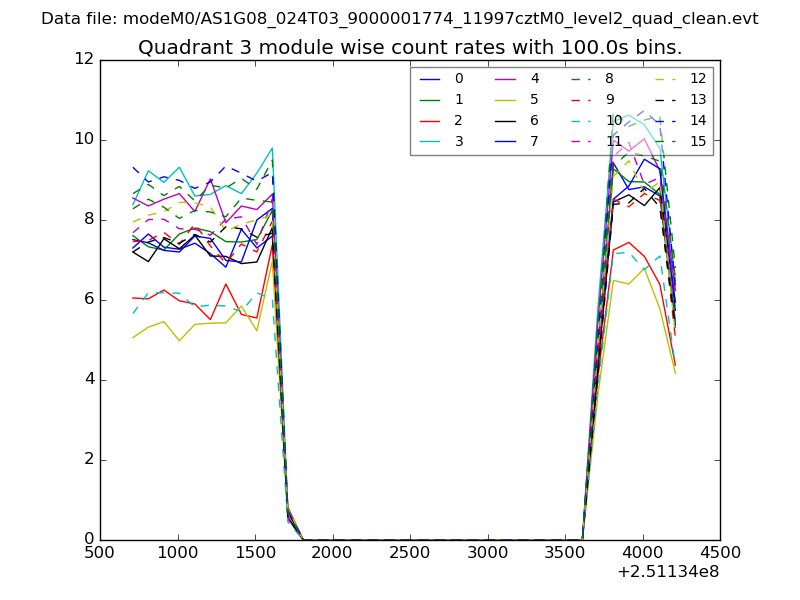
| Module-wise count rates for Quadrant A Data is divided into 100 sec bins |
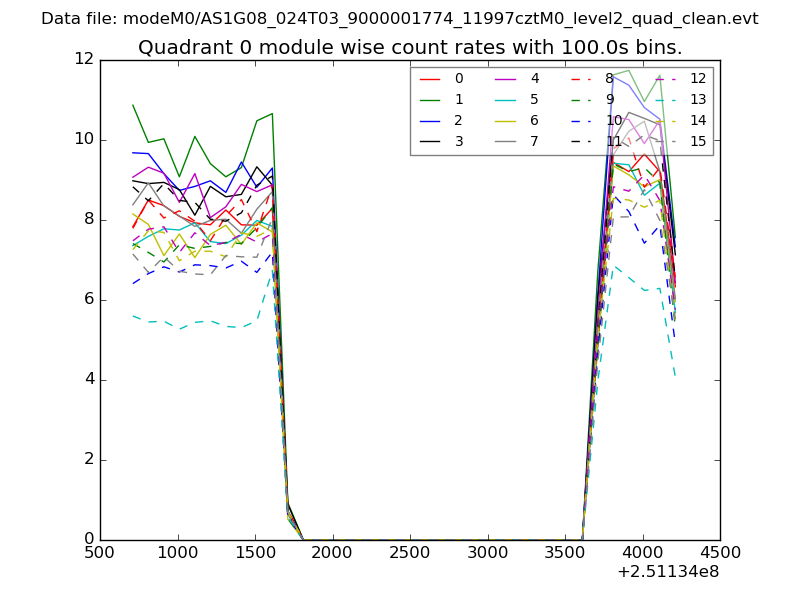 |
 |
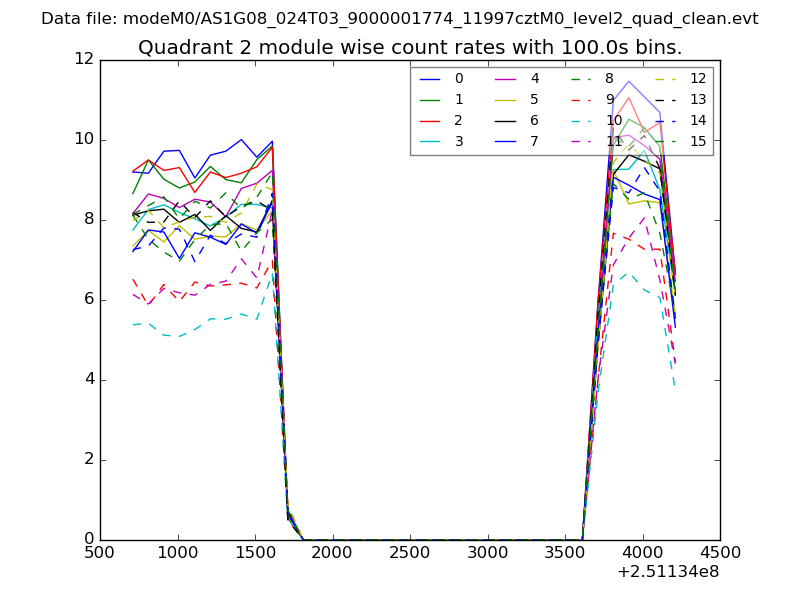
| Module-wise count rates for Quadrant B Data is divided into 100 sec bins |
 |
 |
| Module-wise count rates for Quadrant C Data is divided into 100 sec bins |
 |
 |
| Module-wise count rates for Quadrant D Data is divided into 100 sec bins |
 |
 |
| Parameter | Plot |
|---|---|
| CZT HV Monitor | 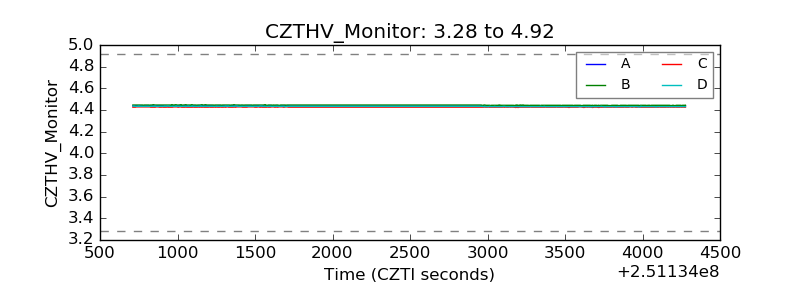 |
| D_VDD | 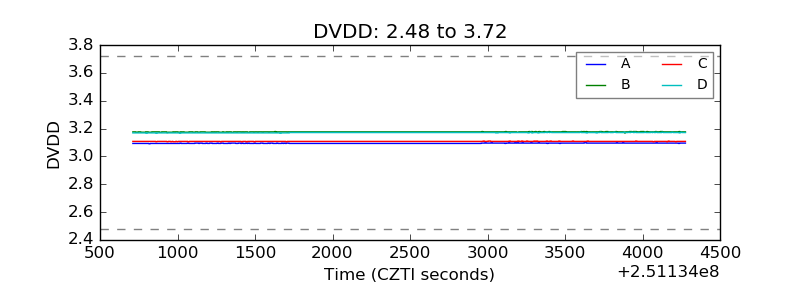 |
| Temperature 1 | 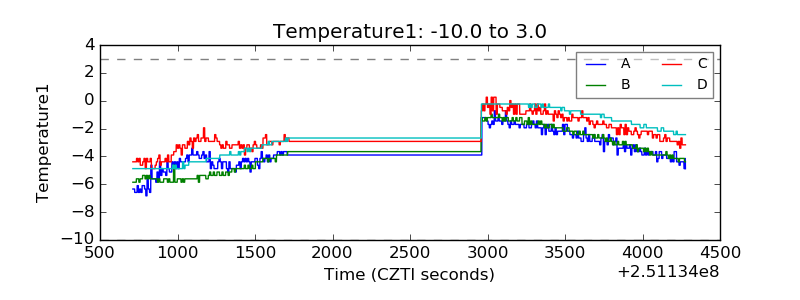 |
| Veto HV Monitor | 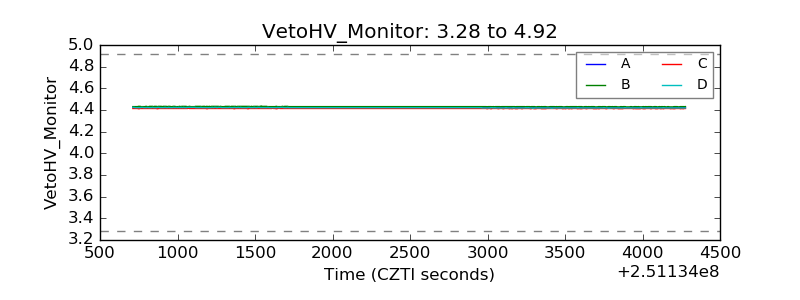 |
| Veto LLD | 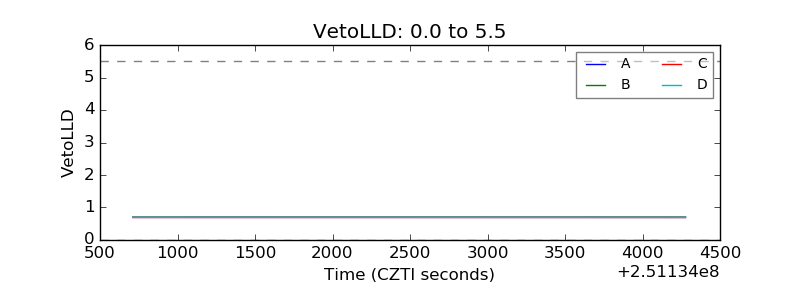 |
| Alpha Counter | 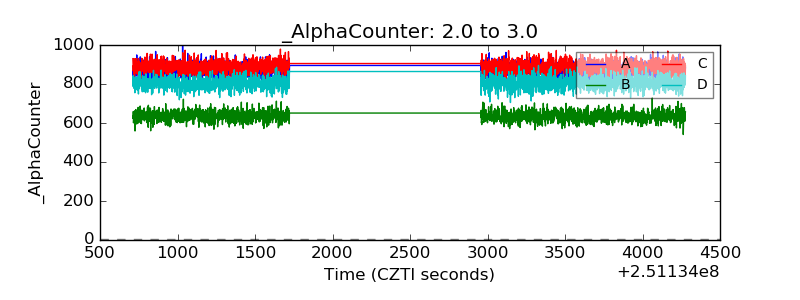 |
| _CPM_Rate | 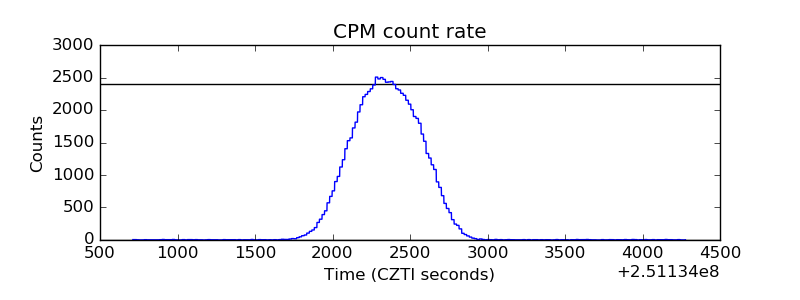 |
| CZT Counter | 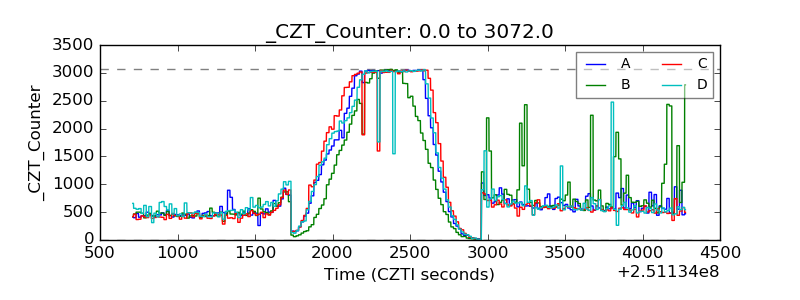 |
| +2.5 Volts monitor |  |
| +5 Volts monitor |  |
| _ROLL_ROT | 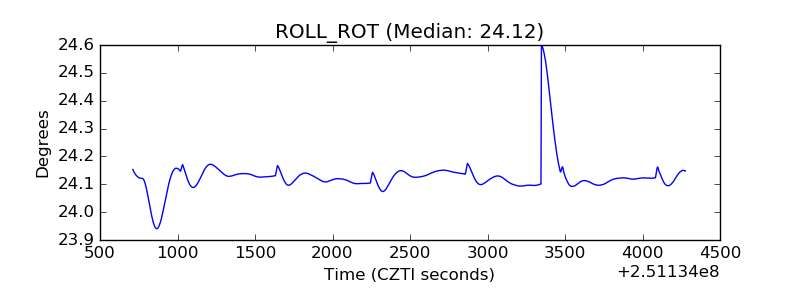 |
| _Roll_DEC | 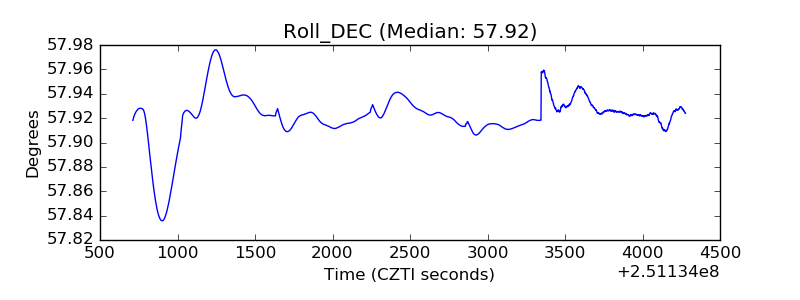 |
| _Roll_RA | 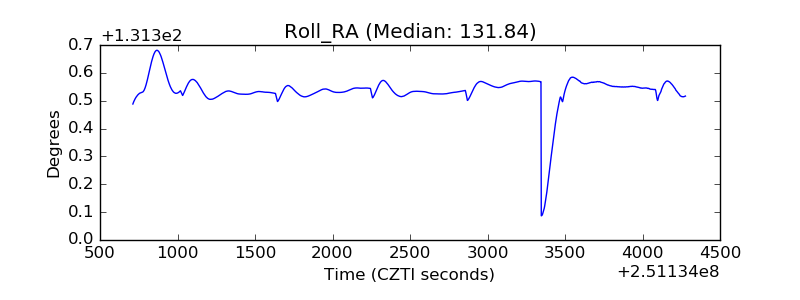 |
| Veto Counter | 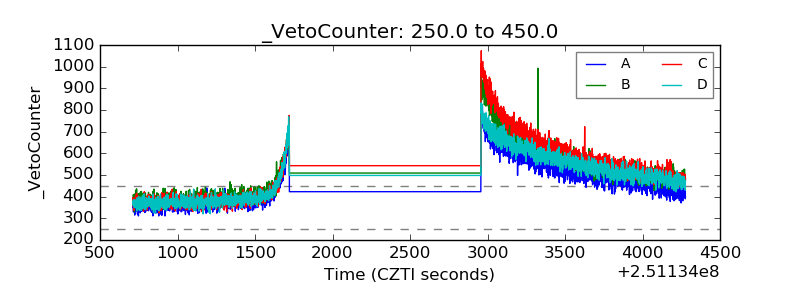 |