| Param | Original file | Final file |
|---|---|---|
| Filename | modeM0/AS1G08_024T03_9000001774_11998cztM0_level2.evt | modeM0/AS1G08_024T03_9000001774_11998cztM0_level2_quad_clean.evt |
| Size (bytes) | 515,128,320 | 102,824,640 |
| Size | 491.3 MB | 98.1 MB |
| Events in quadrant A | 3,592,382 | 683,905 |
| Events in quadrant B | 4,666,507 | 662,488 |
| Events in quadrant C | 3,151,093 | 678,204 |
| Events in quadrant D | 3,762,052 | 648,398 |
| Mode SS | |||
|---|---|---|---|
| Quadrant | BADHDUFLAG | Total packets | Discarded packets |
| A | 0 | 132 | 0 |
| B | 0 | 132 | 0 |
| C | 0 | 132 | 0 |
| D | 0 | 132 | 0 |
| Mode M9 | |||
|---|---|---|---|
| Quadrant | BADHDUFLAG | Total packets | Discarded packets |
| A | 0 | 25 | 0 |
| B | 0 | 25 | 0 |
| C | 0 | 25 | 0 |
| D | 0 | 25 | 0 |
| Mode M0 | |||
|---|---|---|---|
| Quadrant | BADHDUFLAG | Total packets | Discarded packets |
| A | 0 | 14974 | 3 |
| B | 0 | 18342 | 2 |
| C | 0 | 13605 | 2 |
| D | 0 | 15468 | 2 |
| Quadrant | Total seconds | Saturated seconds | Saturation percentage |
|---|---|---|---|
| A | 6312 | 135 | 2.138783% |
| B | 6312 | 532 | 8.428390% |
| C | 6312 | 84 | 1.330798% |
| D | 6312 | 141 | 2.233840% |
Noise dominated data is calculated using 1-second bins in cleaned event files. If a bin has >2000 counts, and if more than 50% of those come from <1% of pixels, then it is considered to be noise-dominated and hence unusable.
| Quadrant | # 1 sec bins | Bins with >0 counts | Bins with >2000 counts | High rate bins dominated by noise | Noise dominated (total time) | Noise dominated (detector-on time) | Marked lightcurve |
|---|---|---|---|---|---|---|---|
| A | 8843 | 6314 | 0 | 0 | 0.00% | 0.00% | 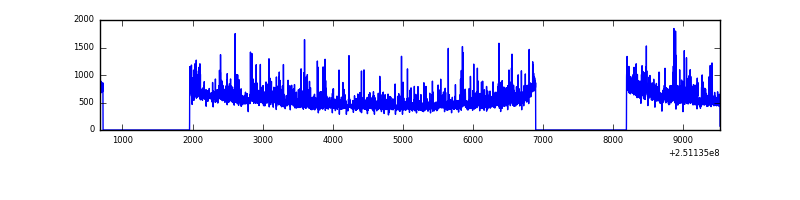 |
| B | 8843 | 6313 | 332 | 332 | 3.75% | 5.26% | 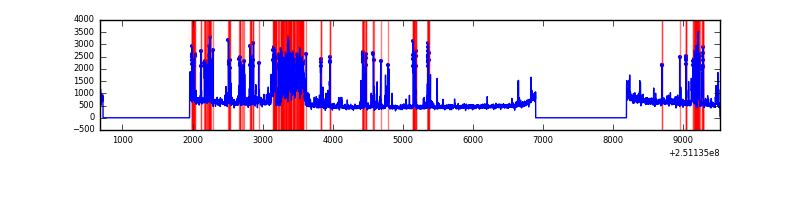 |
| C | 8843 | 6313 | 0 | 0 | 0.00% | 0.00% | 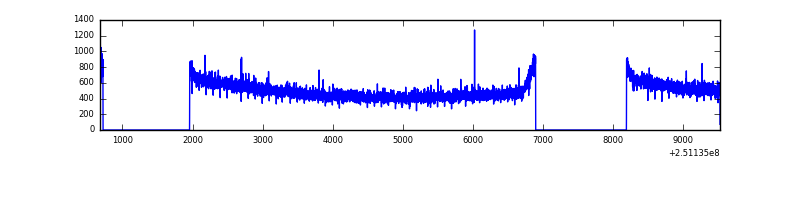 |
| D | 8843 | 6313 | 54 | 54 | 0.61% | 0.86% | 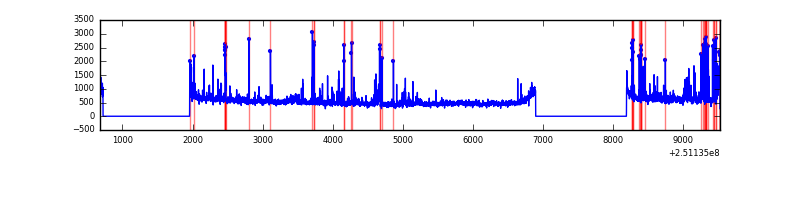 |
Top three noisy pixels from each quadrant. If the there are fewer than three noisy pixels in the level2.evt file, extra rows are filled as -1
| Pixel properties | Quadrant properties | ||||||
|---|---|---|---|---|---|---|---|
| Quadrant | DetID | PixID | Counts | Sigma | Mean | Median | Sigma |
| A | 1 | 162 | 162214 | 989.05 | 815 | 800 | 163.2 |
| A | 1 | 178 | 87779 | 532.95 | 815 | 800 | 163.2 |
| A | 1 | 161 | 76741 | 465.32 | 815 | 800 | 163.2 |
| B | 4 | 239 | 857248 | 5827.38 | 794 | 775 | 147.0 |
| B | 0 | 85 | 320333 | 2174.25 | 794 | 775 | 147.0 |
| B | 15 | 204 | 135833 | 918.92 | 794 | 775 | 147.0 |
| C | 1 | 16 | 12425 | 63.0 | 803 | 806 | 184.4 |
| C | 13 | 61 | 6053 | 28.45 | 803 | 806 | 184.4 |
| C | 12 | 4 | 3252 | 13.26 | 803 | 806 | 184.4 |
| D | 8 | 195 | 159441 | 844.56 | 795 | 773 | 187.9 |
| D | 1 | 52 | 156024 | 826.37 | 795 | 773 | 187.9 |
| D | 13 | 104 | 106829 | 564.52 | 795 | 773 | 187.9 |
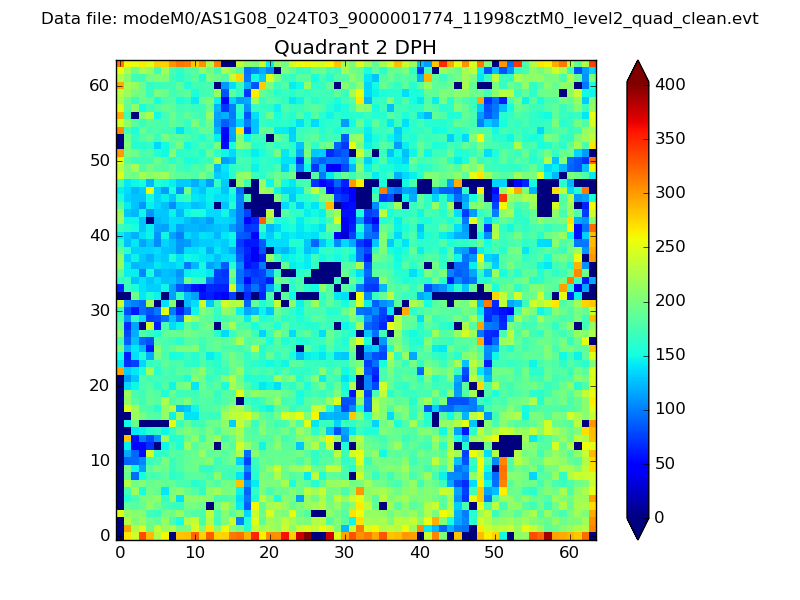
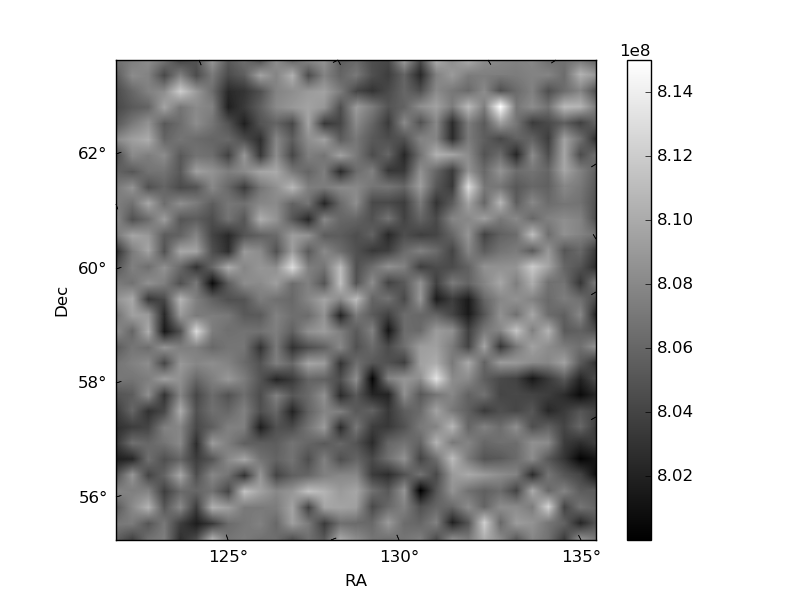
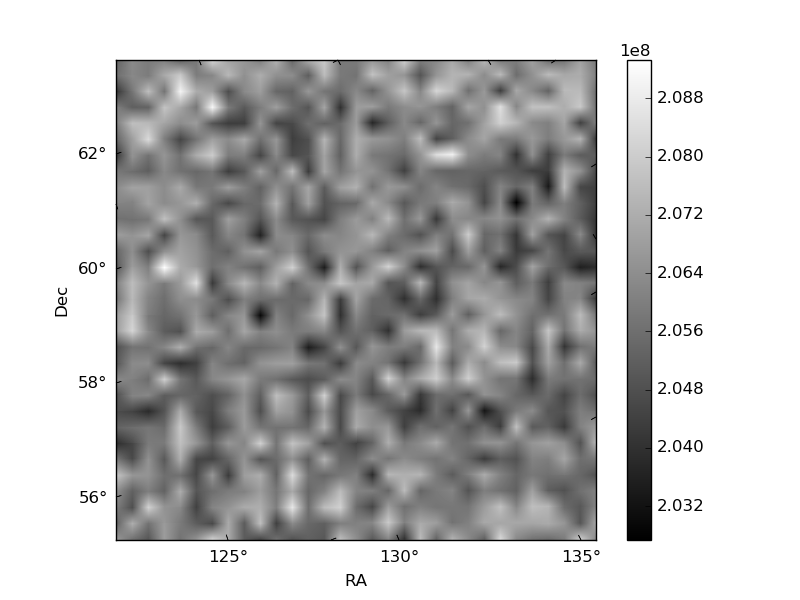
Histogram calculated using DETX and DETY for each event in the final _common_clean file
| Quadrant A | 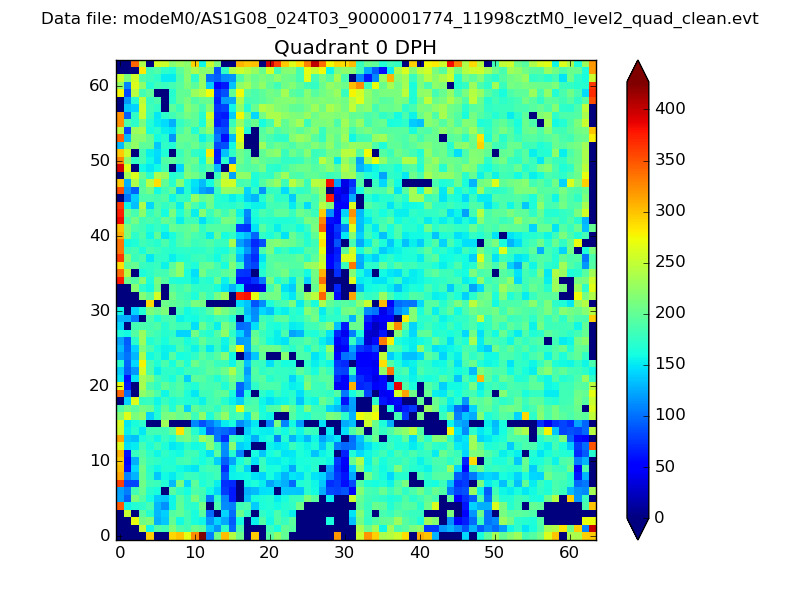 |
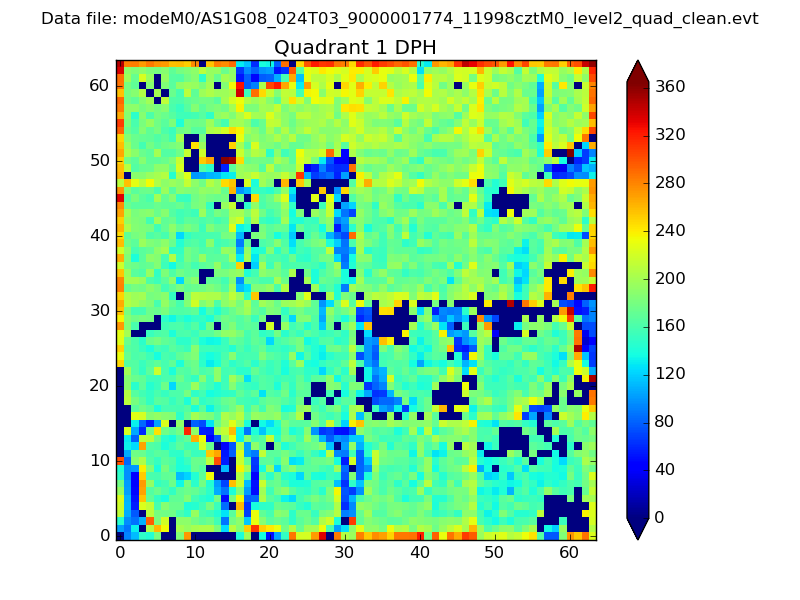 |
Quadrant B |
|---|---|---|---|
| Quadrant D | 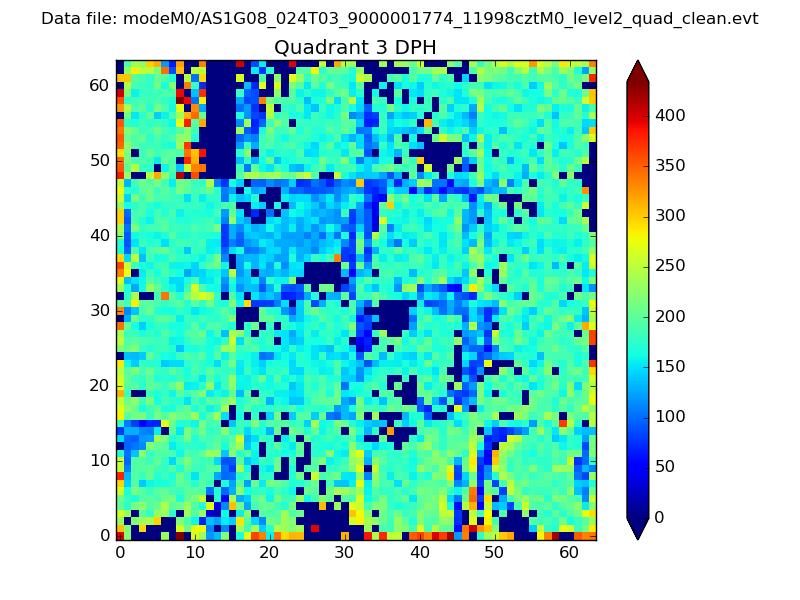 |
 |
Quadrant C |
| Plot type | Count rate plots | Images |
|---|---|---|
| Comparison with Poisson distribution Blue bars denote a histogram of data divided into 1 sec bins. Red curve is a Poisson curve with rate = median count rate of data. |
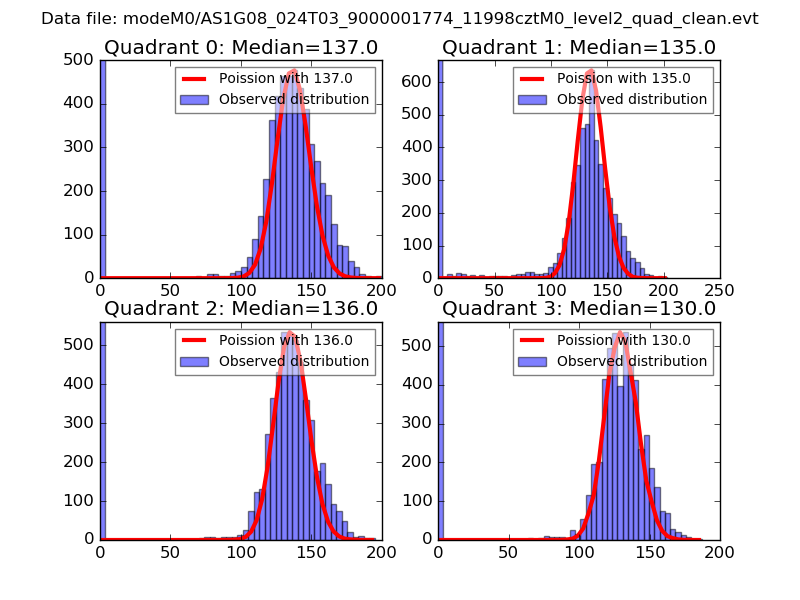 |
 |
| Quadrant-wise count rates Data is divided into 100 sec bins |
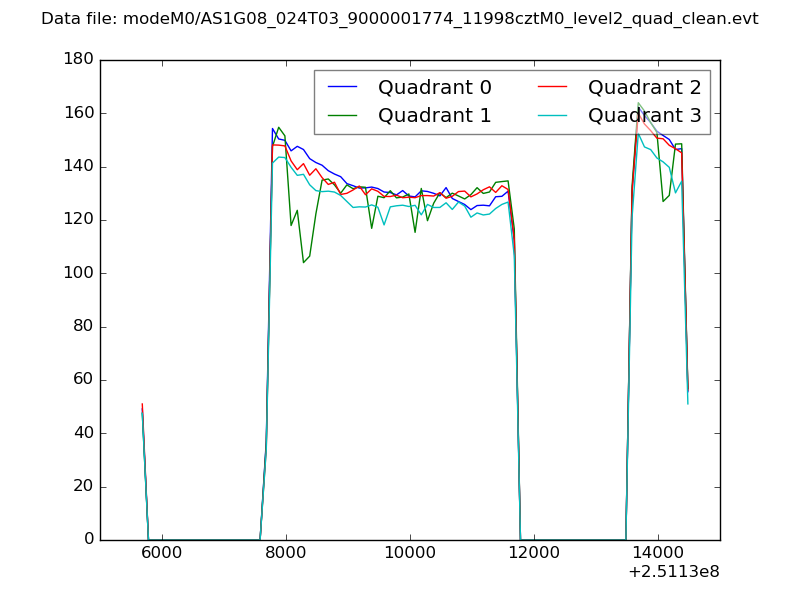 |
|
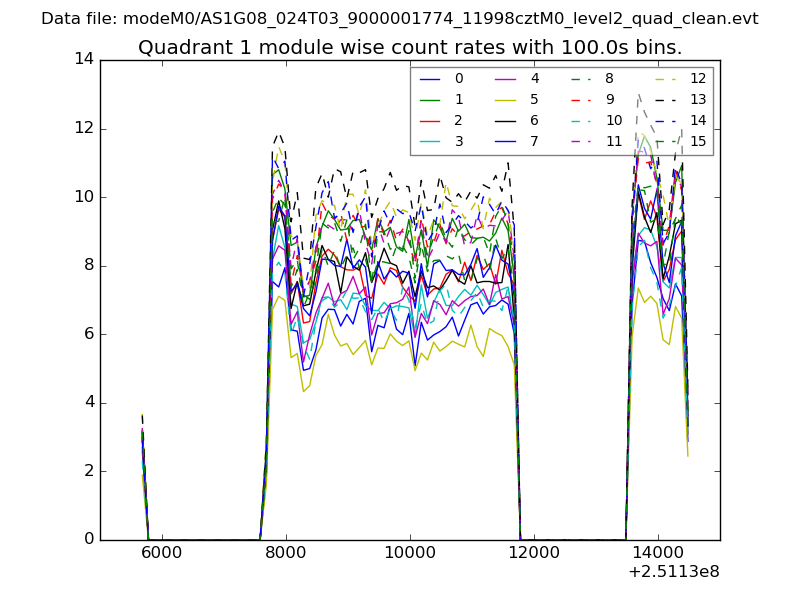
| Module-wise count rates for Quadrant A Data is divided into 100 sec bins |
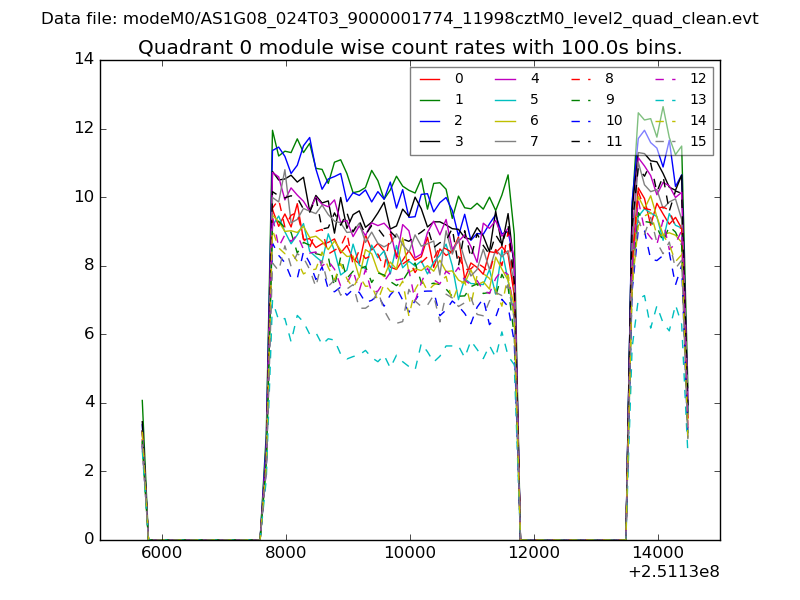 |
 |
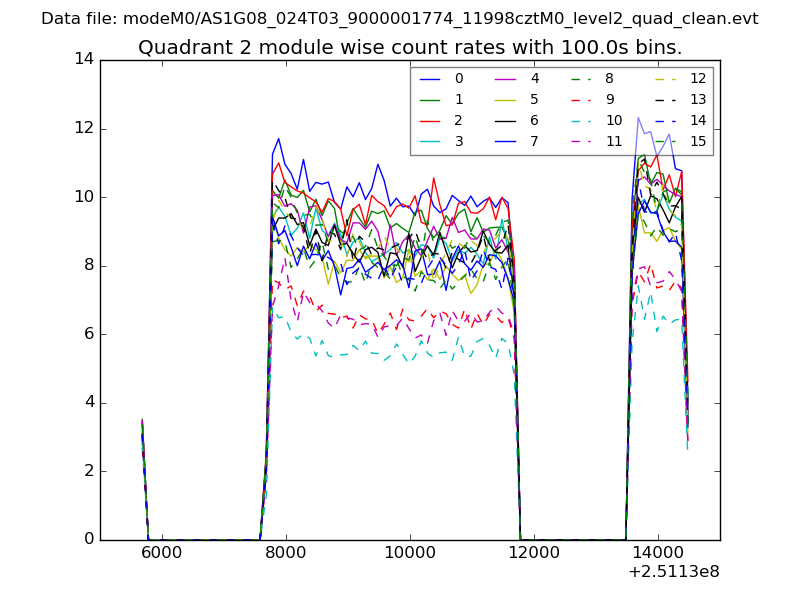
| Module-wise count rates for Quadrant B Data is divided into 100 sec bins |
 |
 |
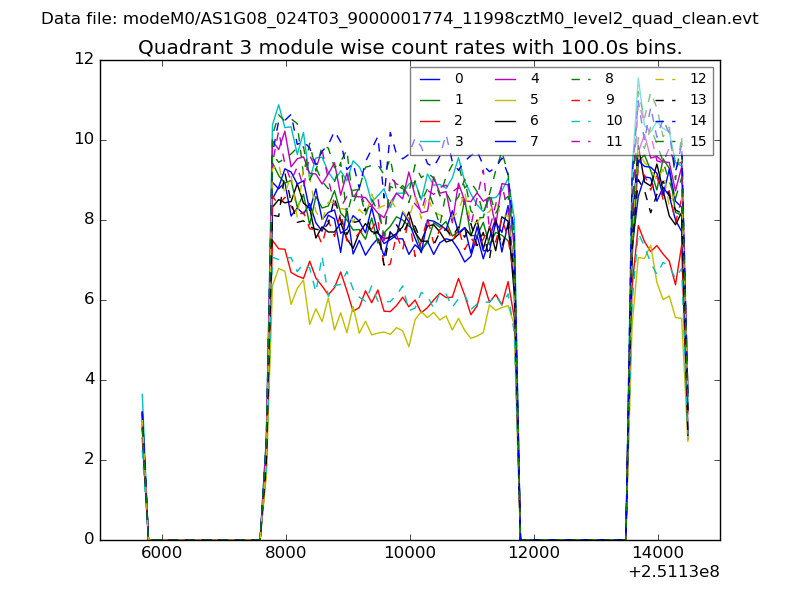
| Module-wise count rates for Quadrant C Data is divided into 100 sec bins |
 |
 |
| Module-wise count rates for Quadrant D Data is divided into 100 sec bins |
 |
 |
| Parameter | Plot |
|---|---|
| CZT HV Monitor | 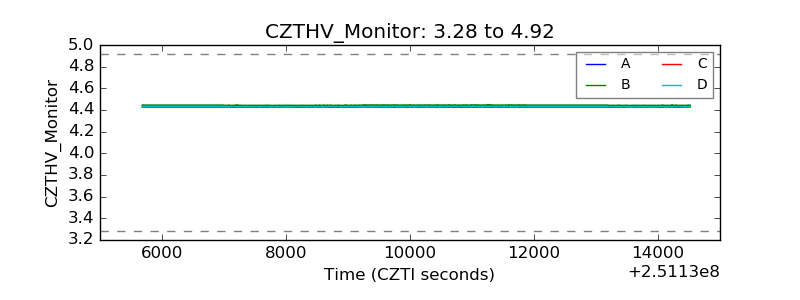 |
| D_VDD | 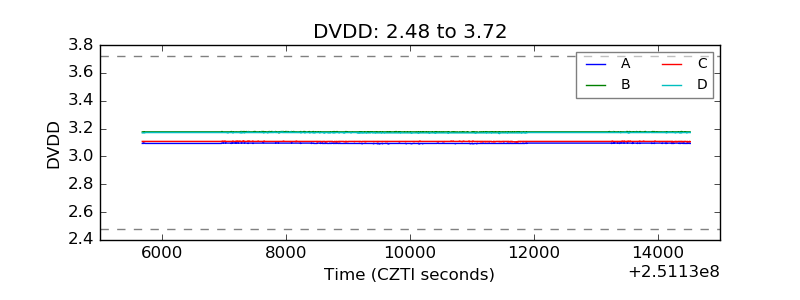 |
| Temperature 1 | 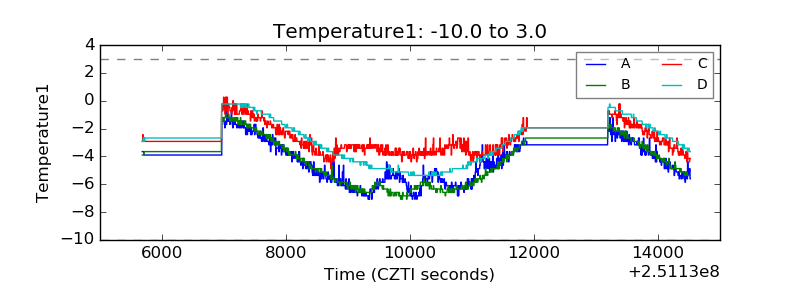 |
| Veto HV Monitor | 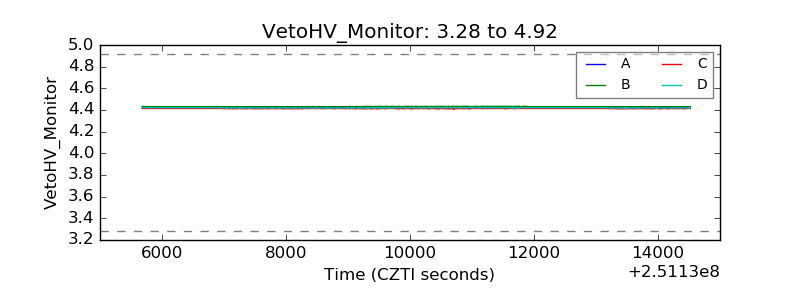 |
| Veto LLD | 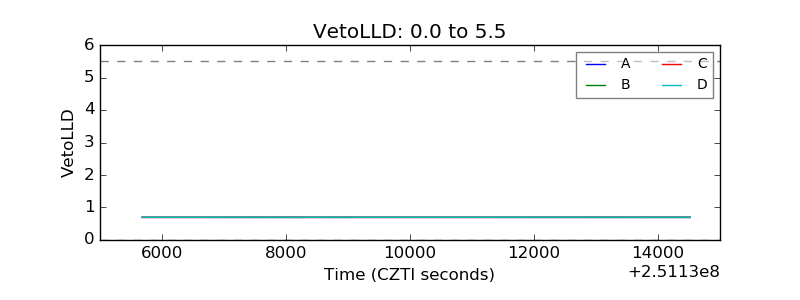 |
| Alpha Counter | 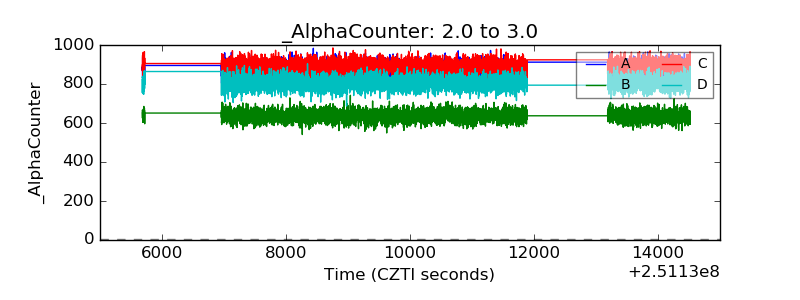 |
| _CPM_Rate | 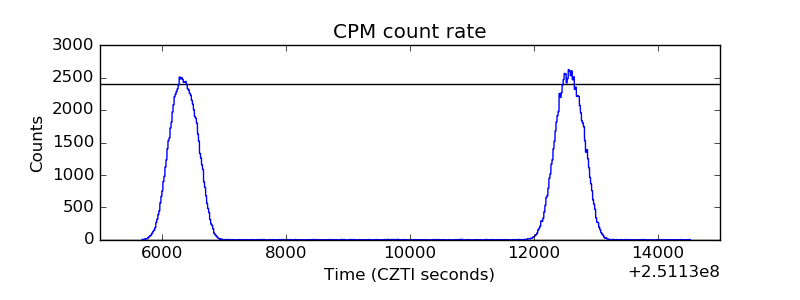 |
| CZT Counter | 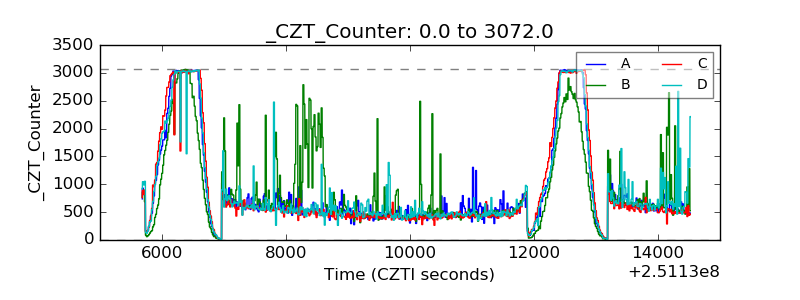 |
| +2.5 Volts monitor |  |
| +5 Volts monitor |  |
| _ROLL_ROT | 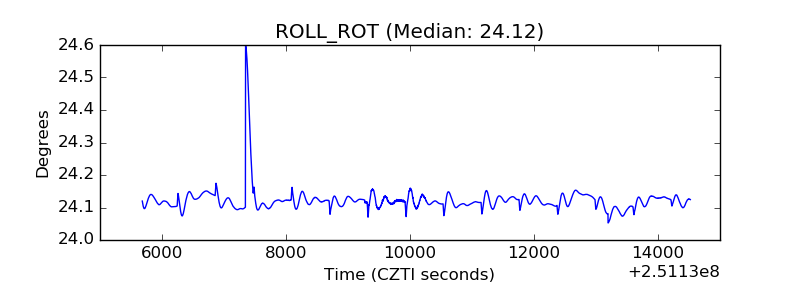 |
| _Roll_DEC | 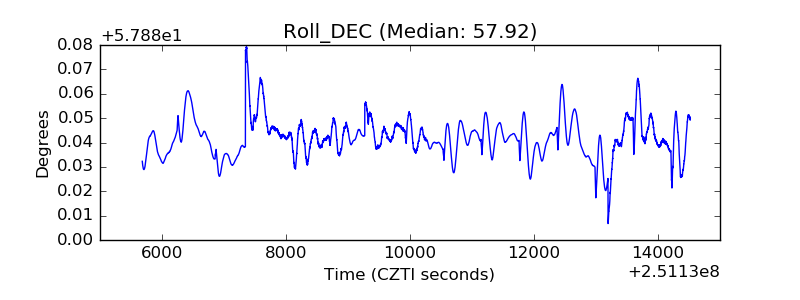 |
| _Roll_RA | 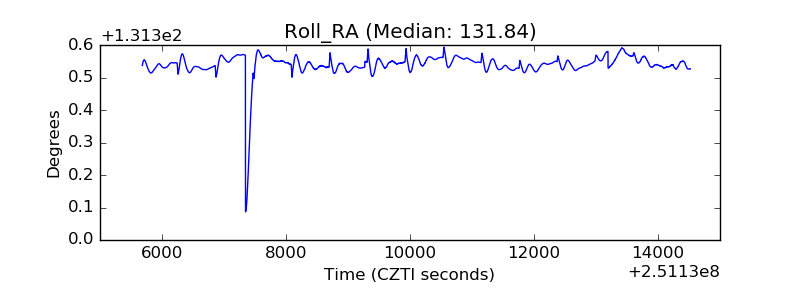 |
| Veto Counter | 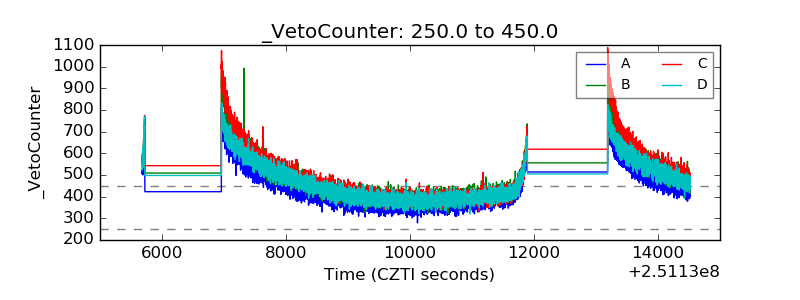 |