| Param | Original file | Final file |
|---|---|---|
| Filename | modeM0/AS1G08_024T03_9000001774_11999cztM0_level2.evt | modeM0/AS1G08_024T03_9000001774_11999cztM0_level2_quad_clean.evt |
| Size (bytes) | 530,297,280 | 106,439,040 |
| Size | 505.7 MB | 101.5 MB |
| Events in quadrant A | 3,443,014 | 724,727 |
| Events in quadrant B | 3,975,381 | 720,072 |
| Events in quadrant C | 2,993,310 | 724,782 |
| Events in quadrant D | 5,233,210 | 626,251 |
| Mode SS | |||
|---|---|---|---|
| Quadrant | BADHDUFLAG | Total packets | Discarded packets |
| A | 0 | 126 | 0 |
| B | 0 | 126 | 0 |
| C | 0 | 126 | 0 |
| D | 0 | 126 | 0 |
| Mode M9 | |||
|---|---|---|---|
| Quadrant | BADHDUFLAG | Total packets | Discarded packets |
| A | 0 | 13 | 0 |
| B | 0 | 13 | 0 |
| C | 0 | 13 | 0 |
| D | 0 | 14 | 0 |
| Mode M0 | |||
|---|---|---|---|
| Quadrant | BADHDUFLAG | Total packets | Discarded packets |
| A | 0 | 14351 | 3 |
| B | 0 | 16033 | 2 |
| C | 0 | 12989 | 2 |
| D | 0 | 19856 | 2 |
| Quadrant | Total seconds | Saturated seconds | Saturation percentage |
|---|---|---|---|
| A | 6119 | 77 | 1.258376% |
| B | 6119 | 294 | 4.804707% |
| C | 6119 | 31 | 0.506619% |
| D | 6119 | 657 | 10.737049% |
Noise dominated data is calculated using 1-second bins in cleaned event files. If a bin has >2000 counts, and if more than 50% of those come from <1% of pixels, then it is considered to be noise-dominated and hence unusable.
| Quadrant | # 1 sec bins | Bins with >0 counts | Bins with >2000 counts | High rate bins dominated by noise | Noise dominated (total time) | Noise dominated (detector-on time) | Marked lightcurve |
|---|---|---|---|---|---|---|---|
| A | 7470 | 6121 | 4 | 4 | 0.05% | 0.07% | 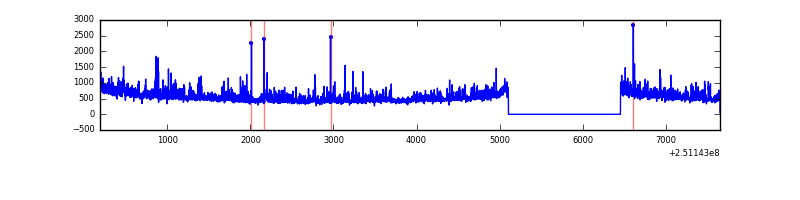 |
| B | 7470 | 6120 | 160 | 160 | 2.14% | 2.61% | 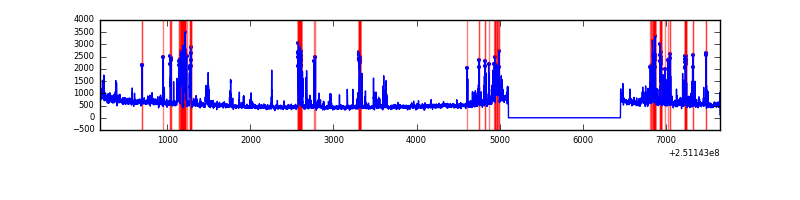 |
| C | 7470 | 6121 | 2 | 2 | 0.03% | 0.03% | 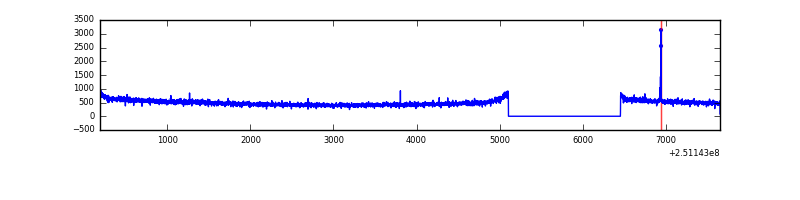 |
| D | 7470 | 6121 | 671 | 671 | 8.98% | 10.96% | 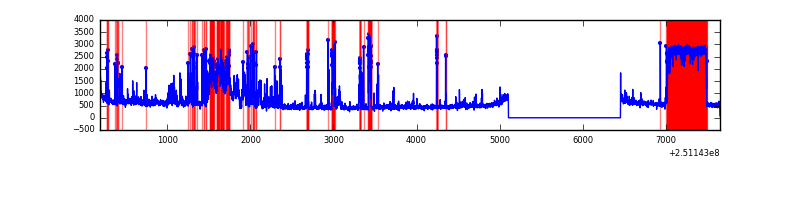 |
Top three noisy pixels from each quadrant. If the there are fewer than three noisy pixels in the level2.evt file, extra rows are filled as -1
| Pixel properties | Quadrant properties | ||||||
|---|---|---|---|---|---|---|---|
| Quadrant | DetID | PixID | Counts | Sigma | Mean | Median | Sigma |
| A | 1 | 162 | 184396 | 1187.06 | 768 | 754 | 154.7 |
| A | 1 | 178 | 100629 | 645.59 | 768 | 754 | 154.7 |
| A | 1 | 161 | 87679 | 561.88 | 768 | 754 | 154.7 |
| B | 4 | 239 | 614956 | 4327.58 | 764 | 746 | 141.9 |
| B | 15 | 204 | 126645 | 887.05 | 764 | 746 | 141.9 |
| B | 0 | 231 | 116795 | 817.65 | 764 | 746 | 141.9 |
| C | 14 | 234 | 15579 | 85.25 | 761 | 766 | 173.8 |
| C | 13 | 61 | 5706 | 28.43 | 761 | 766 | 173.8 |
| C | 8 | 128 | 3742 | 17.13 | 761 | 766 | 173.8 |
| D | 10 | 199 | 1242079 | 7500.1 | 700 | 683 | 165.5 |
| D | 1 | 52 | 850134 | 5132.1 | 700 | 683 | 165.5 |
| D | 13 | 104 | 128688 | 773.36 | 700 | 683 | 165.5 |
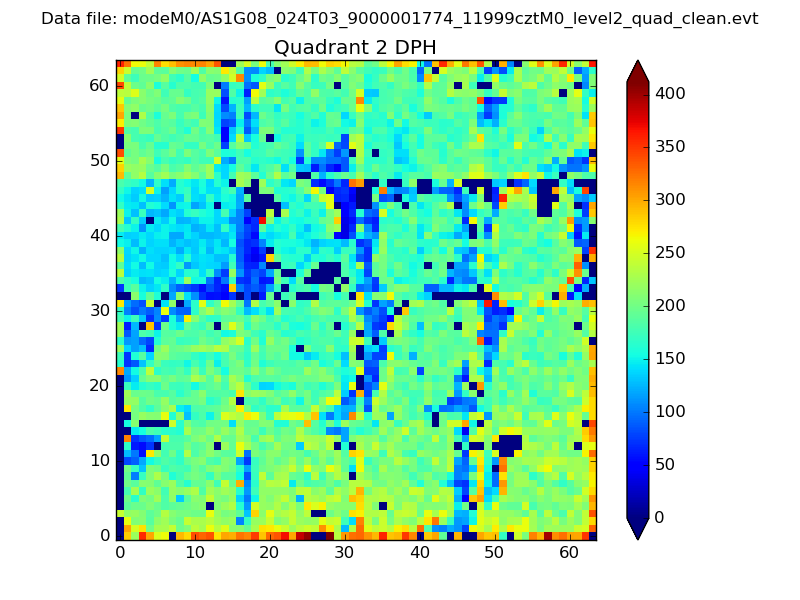
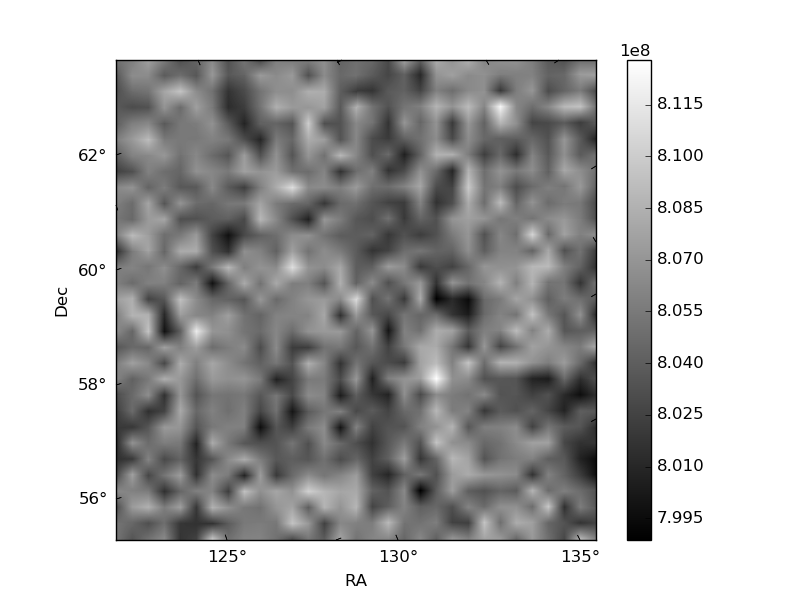
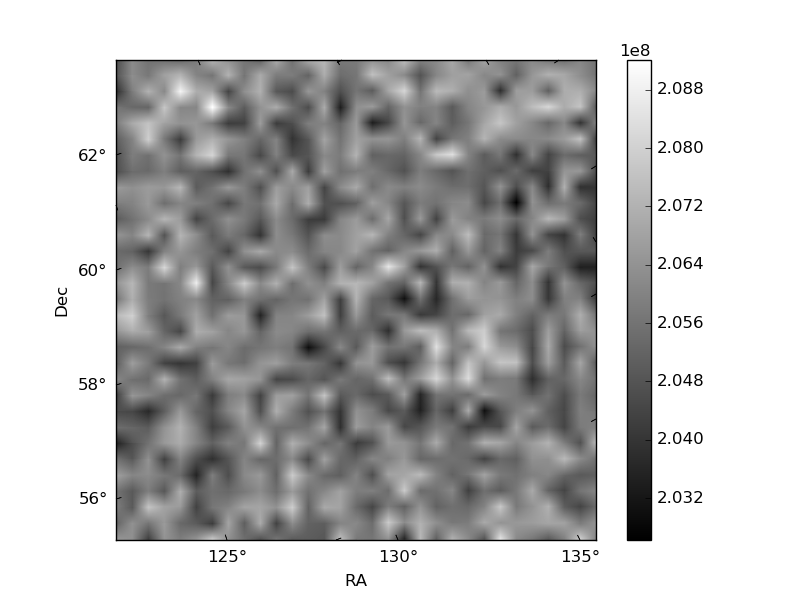
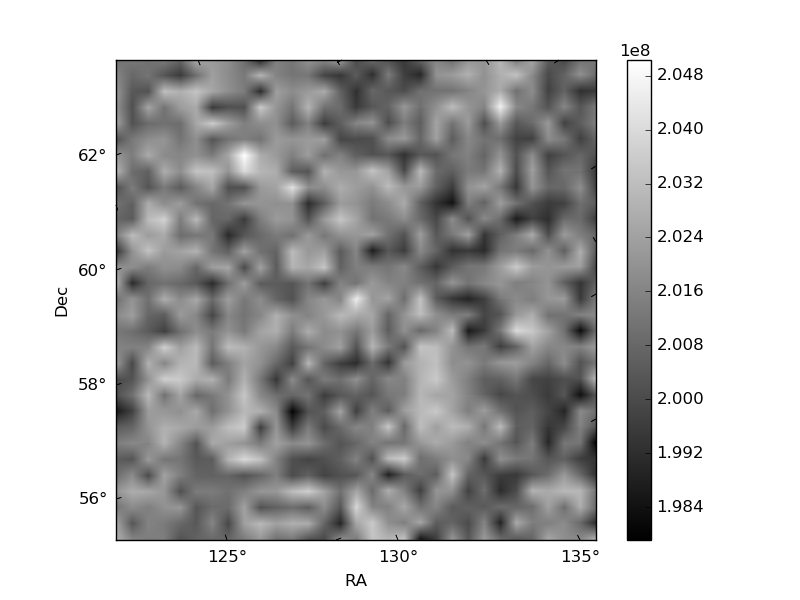
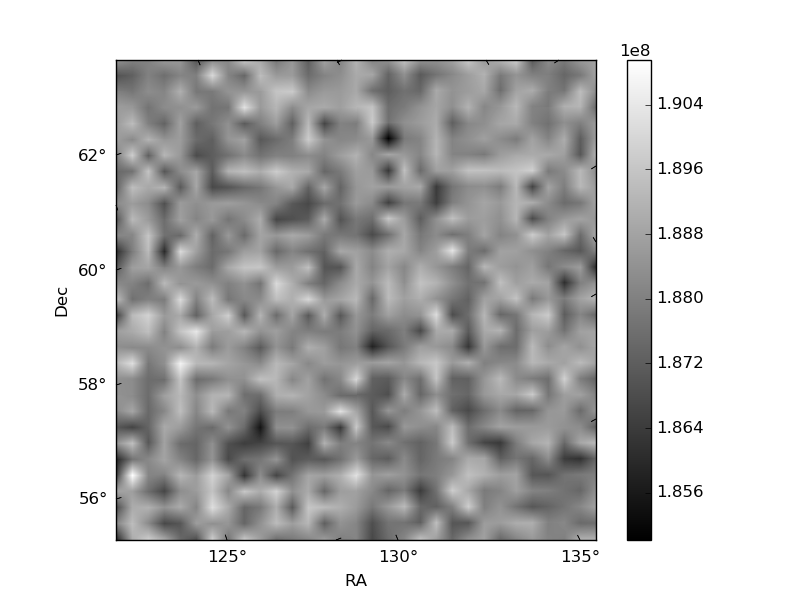
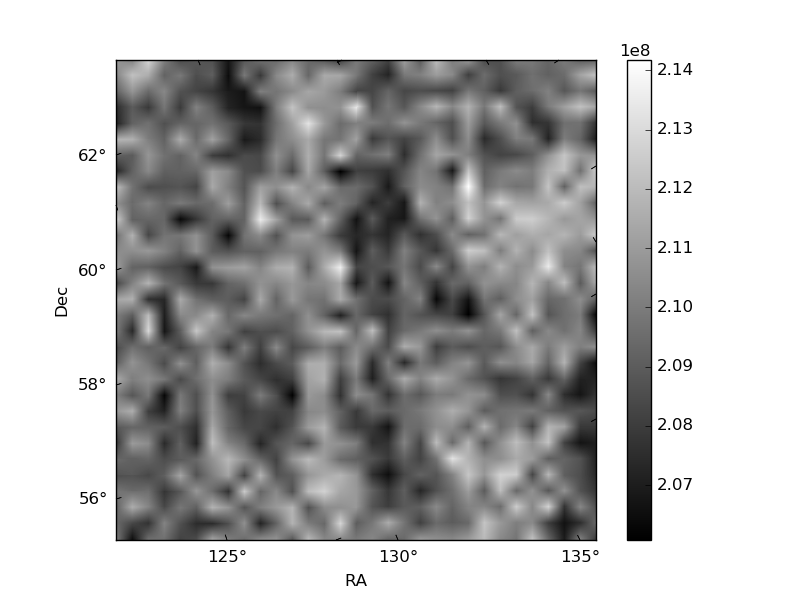
Histogram calculated using DETX and DETY for each event in the final _common_clean file
| Quadrant A | 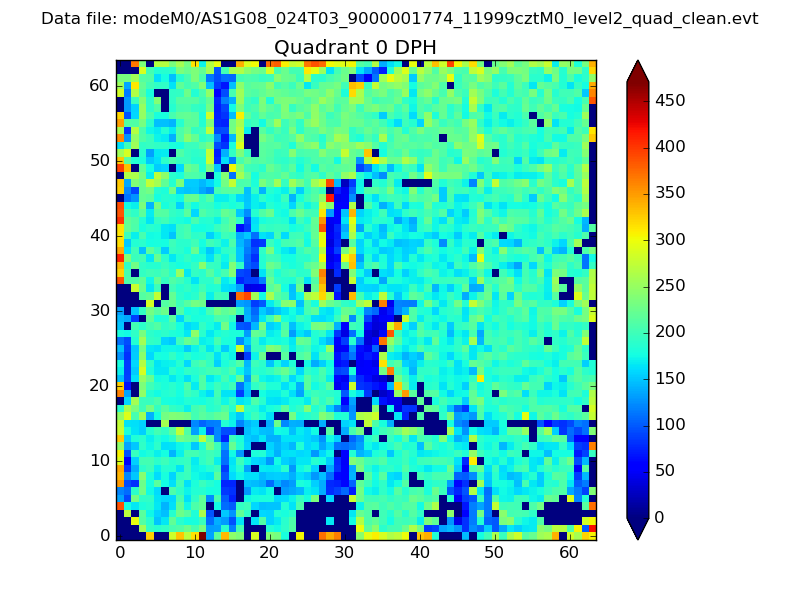 |
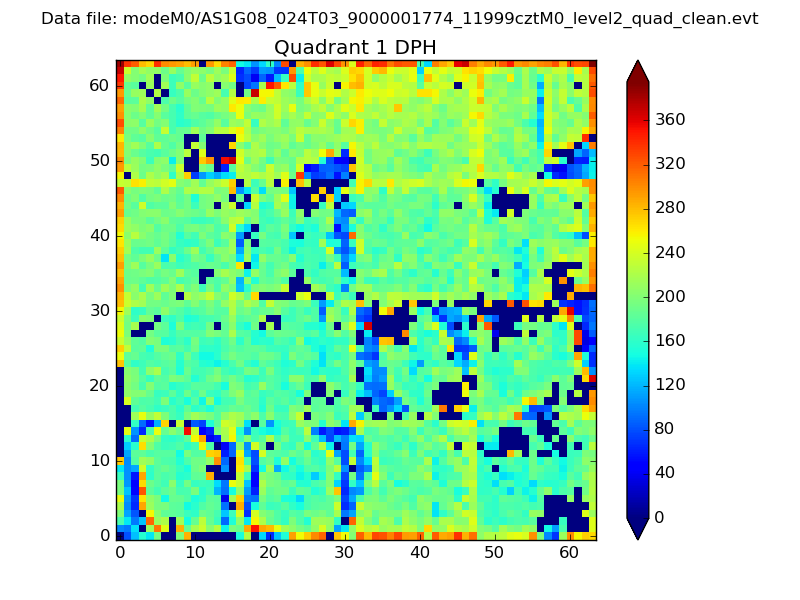 |
Quadrant B |
|---|---|---|---|
| Quadrant D | 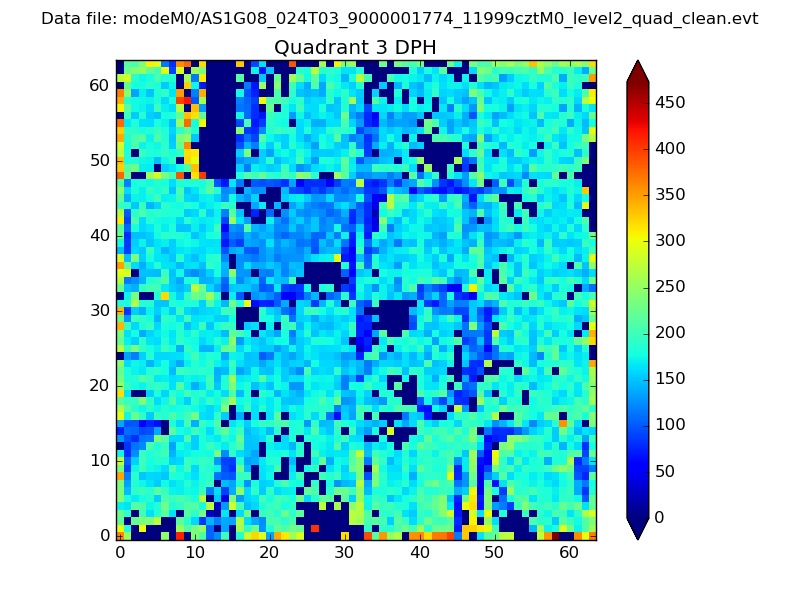 |
 |
Quadrant C |
| Plot type | Count rate plots | Images |
|---|---|---|
| Comparison with Poisson distribution Blue bars denote a histogram of data divided into 1 sec bins. Red curve is a Poisson curve with rate = median count rate of data. |
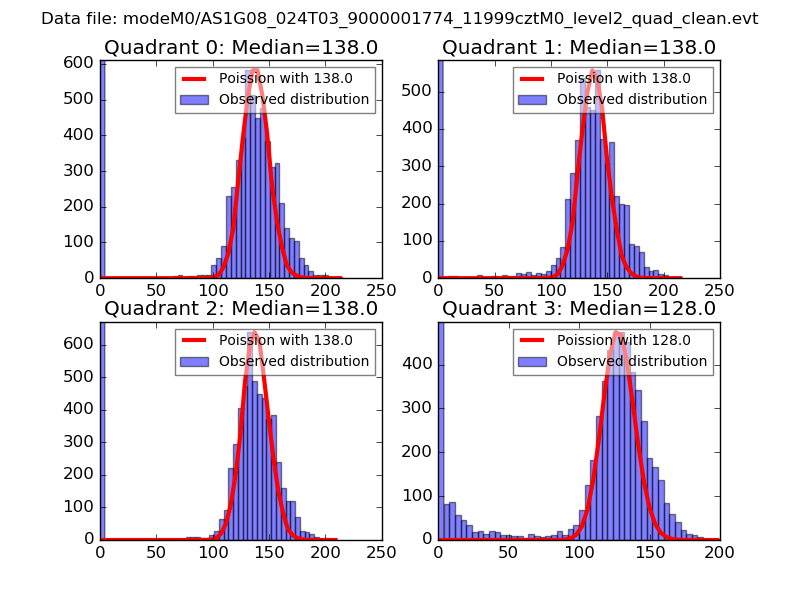 |
 |
| Quadrant-wise count rates Data is divided into 100 sec bins |
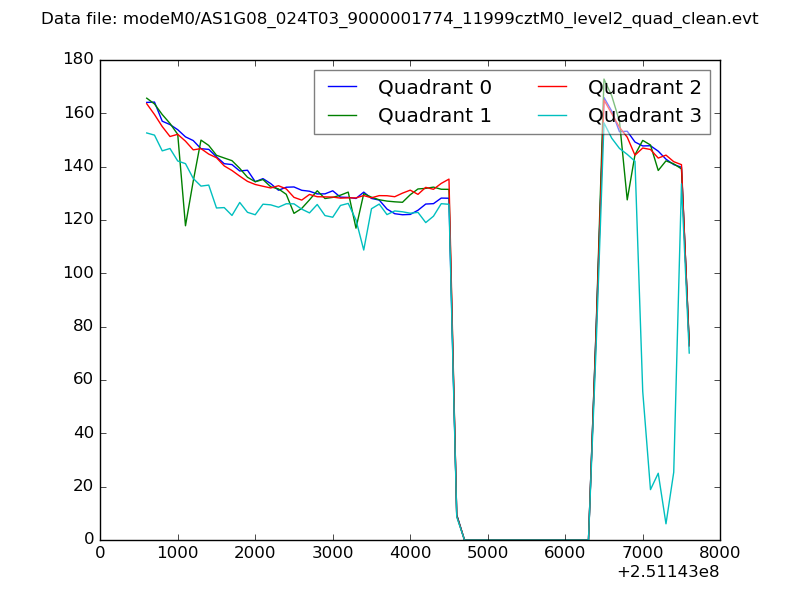 |
|
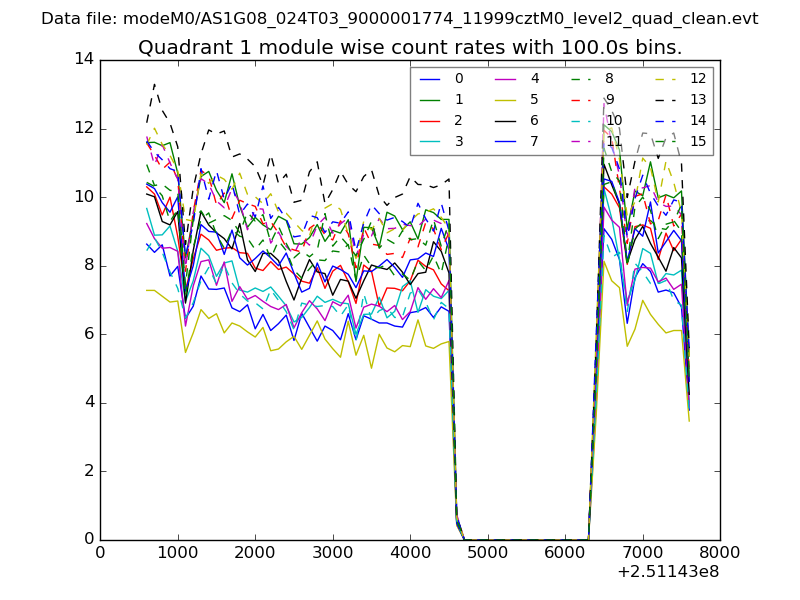
| Module-wise count rates for Quadrant A Data is divided into 100 sec bins |
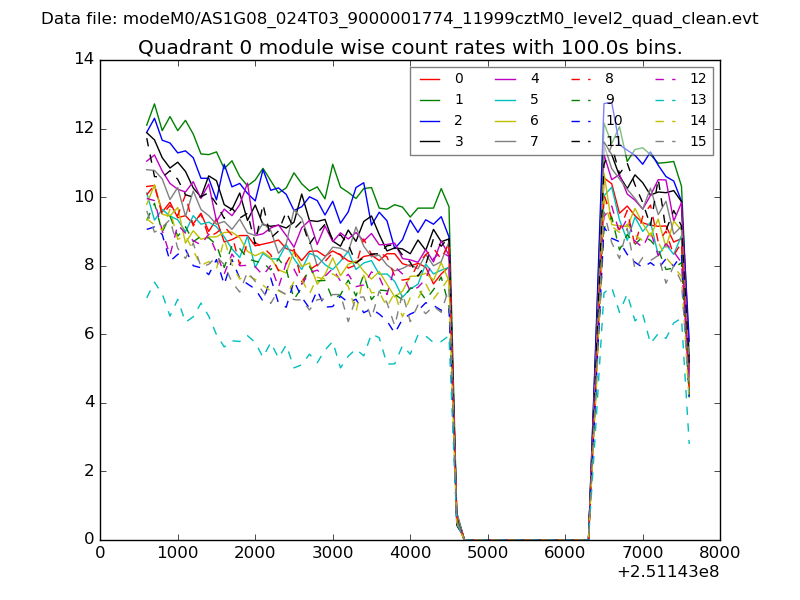 |
 |
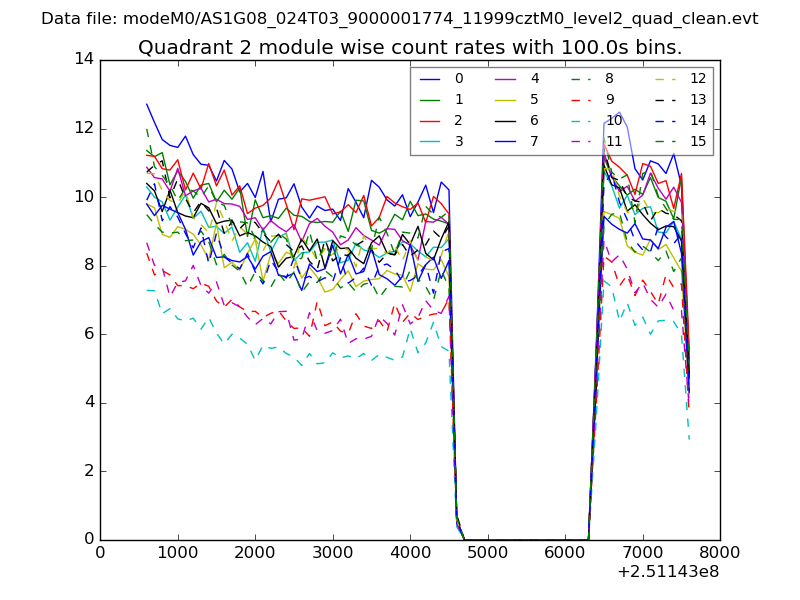
| Module-wise count rates for Quadrant B Data is divided into 100 sec bins |
 |
 |
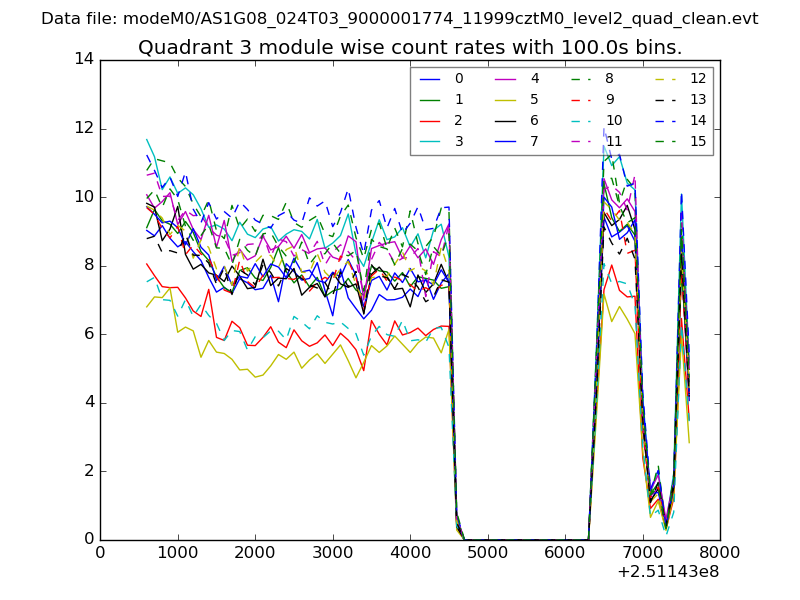
| Module-wise count rates for Quadrant C Data is divided into 100 sec bins |
 |
 |
| Module-wise count rates for Quadrant D Data is divided into 100 sec bins |
 |
 |
| Parameter | Plot |
|---|---|
| CZT HV Monitor | 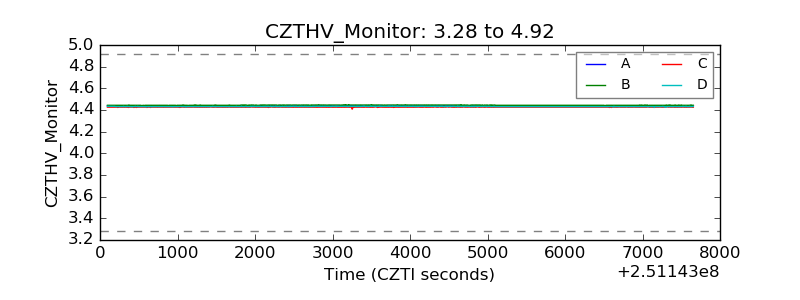 |
| D_VDD | 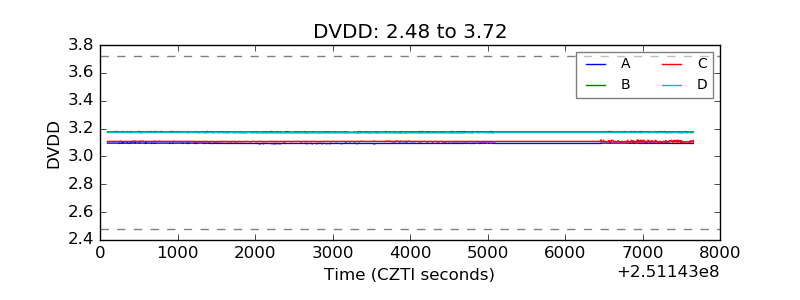 |
| Temperature 1 | 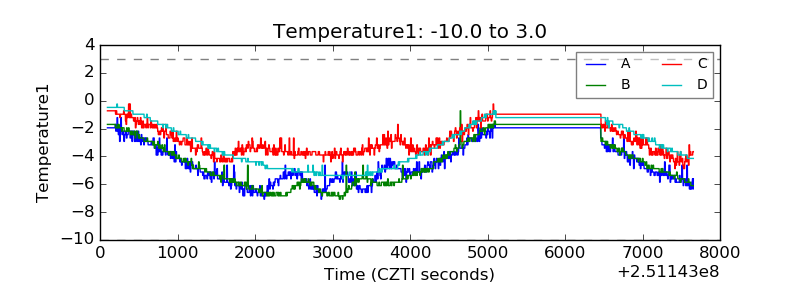 |
| Veto HV Monitor | 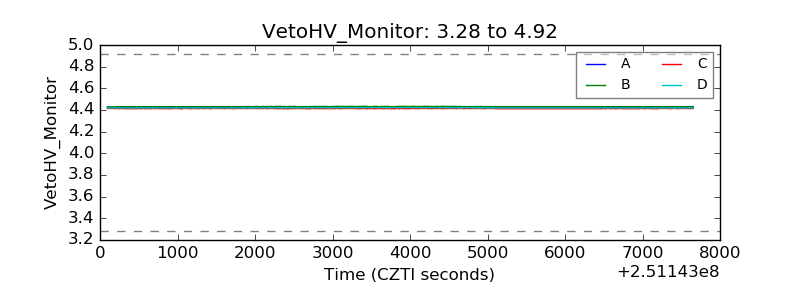 |
| Veto LLD |  |
| Alpha Counter | 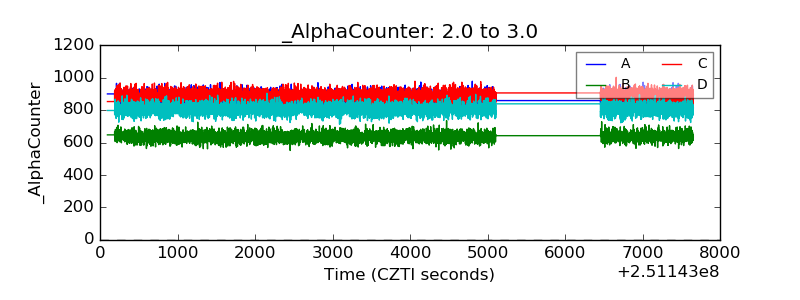 |
| _CPM_Rate | 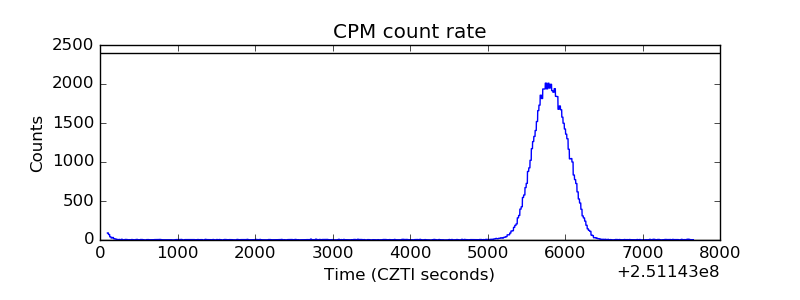 |
| CZT Counter | 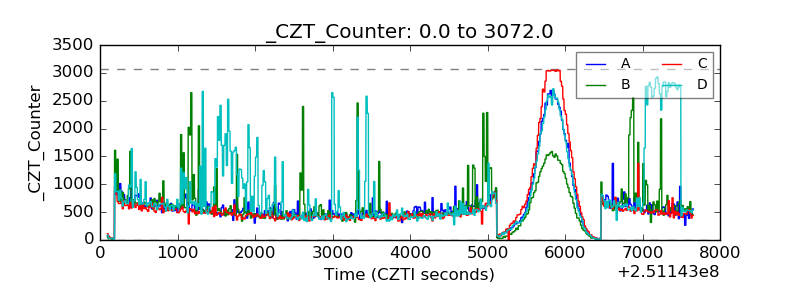 |
| +2.5 Volts monitor |  |
| +5 Volts monitor |  |
| _ROLL_ROT | 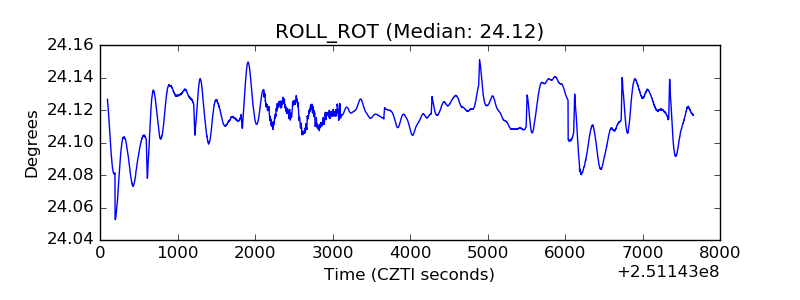 |
| _Roll_DEC | 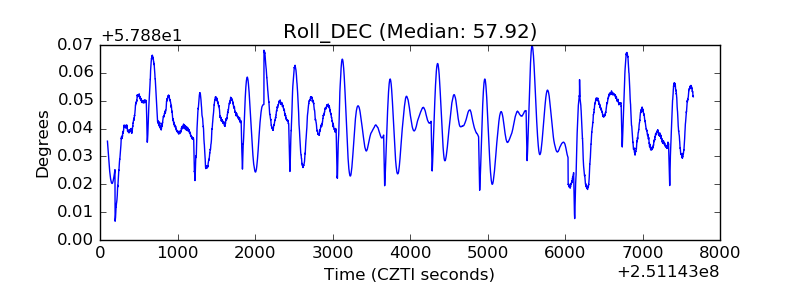 |
| _Roll_RA | 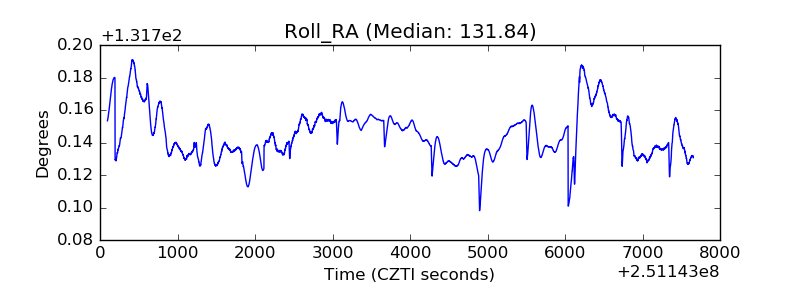 |
| Veto Counter | 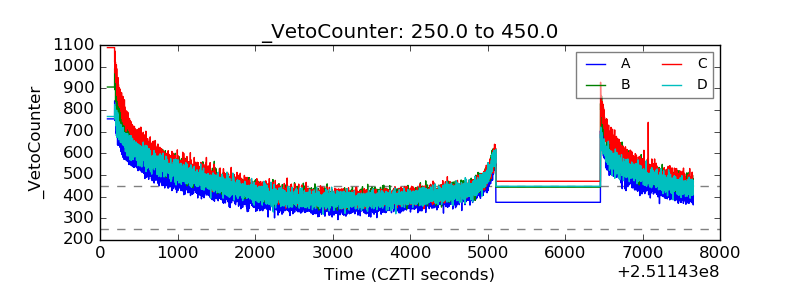 |