| Param | Original file | Final file |
|---|---|---|
| Filename | modeM0/AS1G08_024T03_9000001774_12000cztM0_level2.evt | modeM0/AS1G08_024T03_9000001774_12000cztM0_level2_quad_clean.evt |
| Size (bytes) | 528,554,880 | 103,812,480 |
| Size | 504.1 MB | 99.0 MB |
| Events in quadrant A | 3,434,740 | 695,275 |
| Events in quadrant B | 4,376,776 | 690,862 |
| Events in quadrant C | 3,136,609 | 694,189 |
| Events in quadrant D | 4,611,958 | 603,933 |
| Mode SS | |||
|---|---|---|---|
| Quadrant | BADHDUFLAG | Total packets | Discarded packets |
| A | 0 | 136 | 0 |
| B | 0 | 136 | 0 |
| C | 0 | 136 | 0 |
| D | 0 | 136 | 0 |
| Mode M9 | |||
|---|---|---|---|
| Quadrant | BADHDUFLAG | Total packets | Discarded packets |
| A | 0 | 26 | 0 |
| B | 0 | 26 | 0 |
| C | 0 | 26 | 0 |
| D | 0 | 26 | 0 |
| Mode M0 | |||
|---|---|---|---|
| Quadrant | BADHDUFLAG | Total packets | Discarded packets |
| A | 0 | 14749 | 3 |
| B | 0 | 17508 | 2 |
| C | 0 | 13788 | 2 |
| D | 0 | 18268 | 2 |
| Quadrant | Total seconds | Saturated seconds | Saturation percentage |
|---|---|---|---|
| A | 6587 | 91 | 1.381509% |
| B | 6587 | 463 | 7.028997% |
| C | 6587 | 58 | 0.880522% |
| D | 6587 | 607 | 9.215121% |
Noise dominated data is calculated using 1-second bins in cleaned event files. If a bin has >2000 counts, and if more than 50% of those come from <1% of pixels, then it is considered to be noise-dominated and hence unusable.
| Quadrant | # 1 sec bins | Bins with >0 counts | Bins with >2000 counts | High rate bins dominated by noise | Noise dominated (total time) | Noise dominated (detector-on time) | Marked lightcurve |
|---|---|---|---|---|---|---|---|
| A | 9198 | 6590 | 2 | 2 | 0.02% | 0.03% | 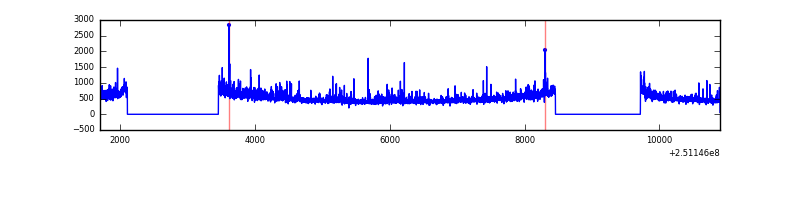 |
| B | 9198 | 6588 | 213 | 213 | 2.32% | 3.23% | 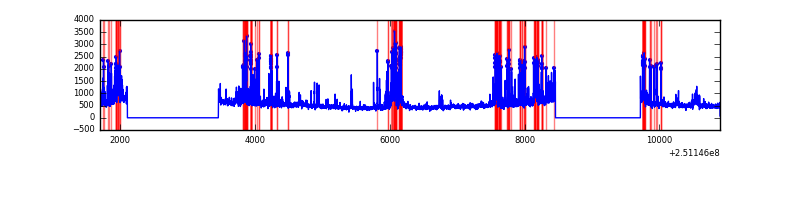 |
| C | 9198 | 6590 | 2 | 2 | 0.02% | 0.03% | 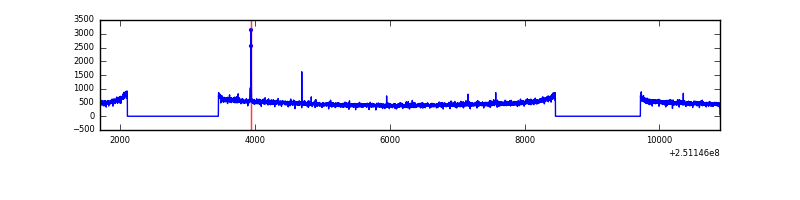 |
| D | 9198 | 6590 | 509 | 509 | 5.53% | 7.72% | 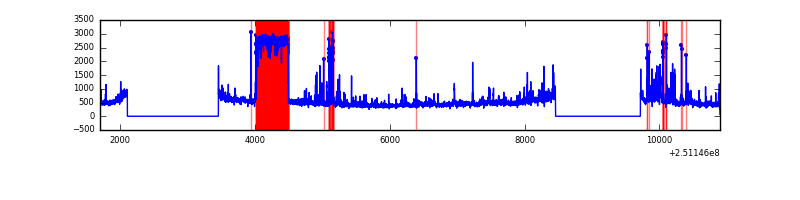 |
Top three noisy pixels from each quadrant. If the there are fewer than three noisy pixels in the level2.evt file, extra rows are filled as -1
| Pixel properties | Quadrant properties | ||||||
|---|---|---|---|---|---|---|---|
| Quadrant | DetID | PixID | Counts | Sigma | Mean | Median | Sigma |
| A | 1 | 162 | 130423 | 791.44 | 807 | 791 | 163.8 |
| A | 1 | 178 | 69972 | 422.37 | 807 | 791 | 163.8 |
| A | 1 | 161 | 61248 | 369.11 | 807 | 791 | 163.8 |
| B | 4 | 239 | 745451 | 4999.43 | 795 | 775 | 149.0 |
| B | 3 | 64 | 264800 | 1772.55 | 795 | 775 | 149.0 |
| B | 15 | 204 | 99594 | 663.42 | 795 | 775 | 149.0 |
| C | 14 | 234 | 15846 | 83.08 | 794 | 799 | 181.1 |
| C | 8 | 128 | 9315 | 47.02 | 794 | 799 | 181.1 |
| C | 13 | 61 | 5947 | 28.42 | 794 | 799 | 181.1 |
| D | 10 | 199 | 1318305 | 7451.51 | 736 | 715 | 176.8 |
| D | 13 | 104 | 188622 | 1062.69 | 736 | 715 | 176.8 |
| D | 8 | 195 | 101055 | 567.46 | 736 | 715 | 176.8 |
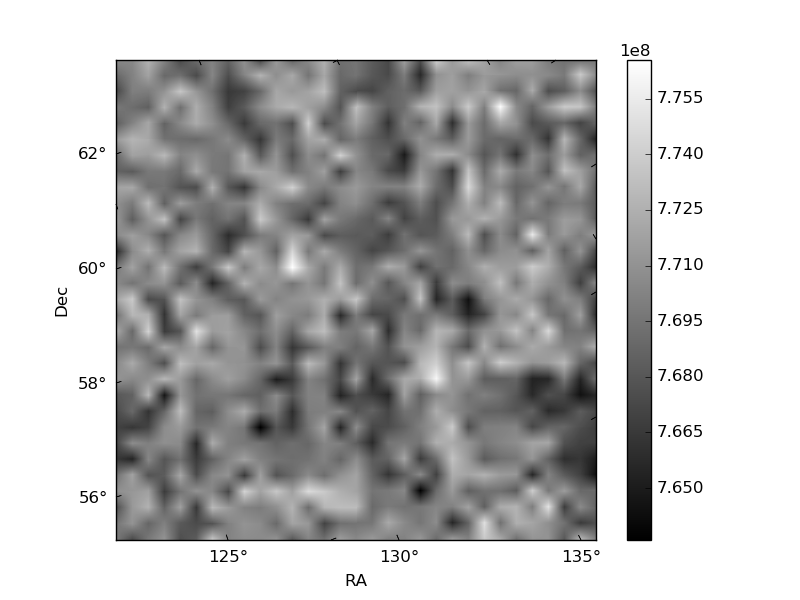
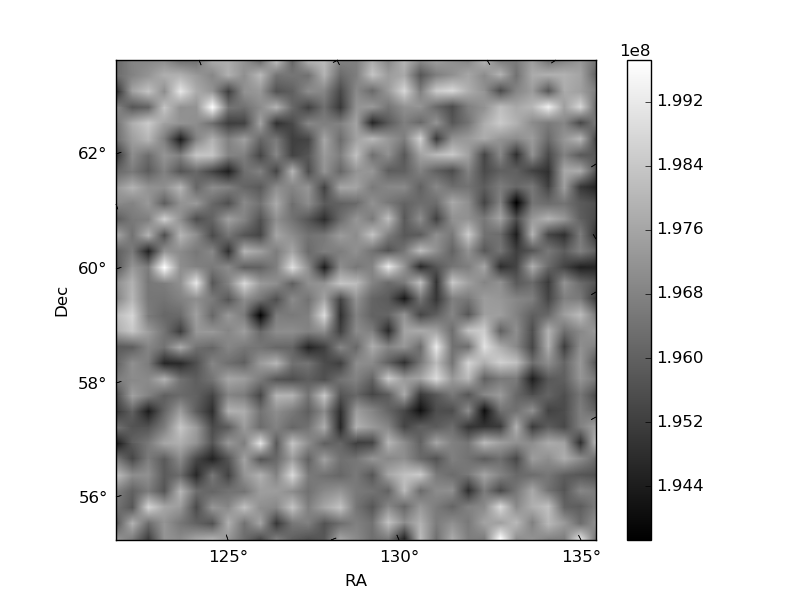
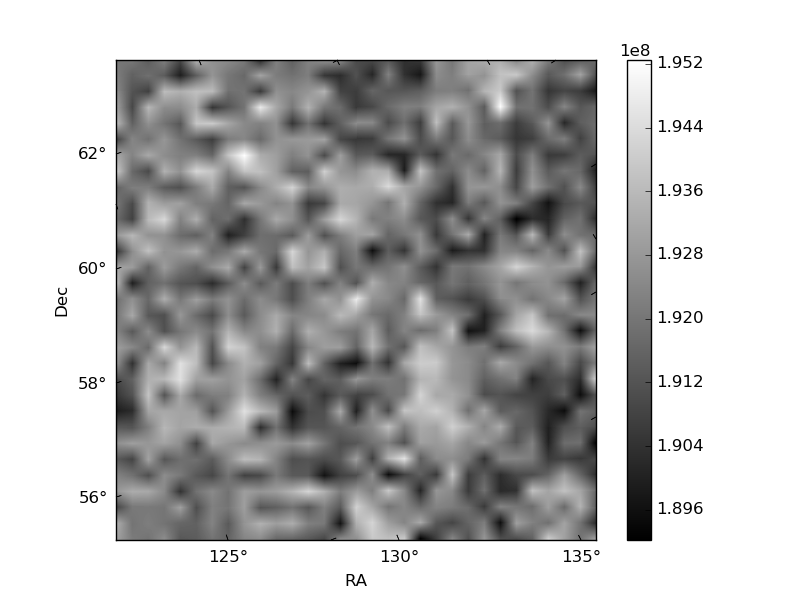
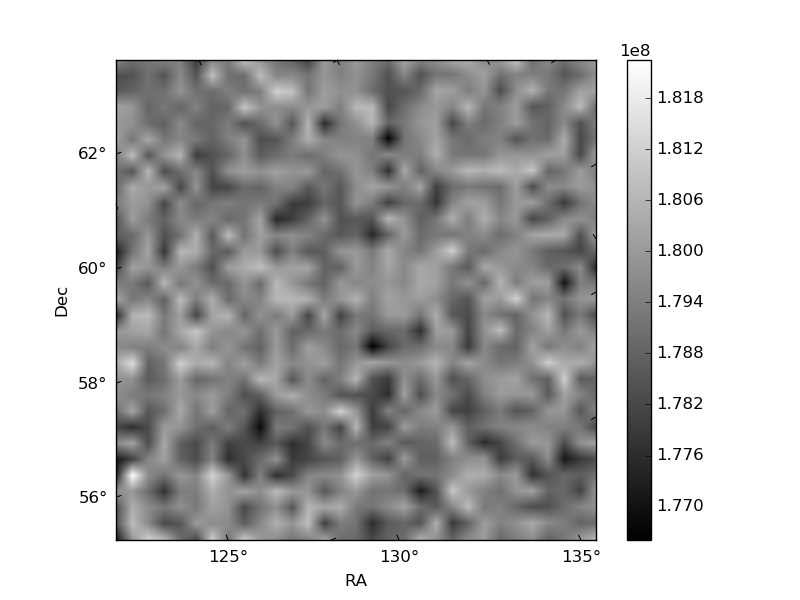
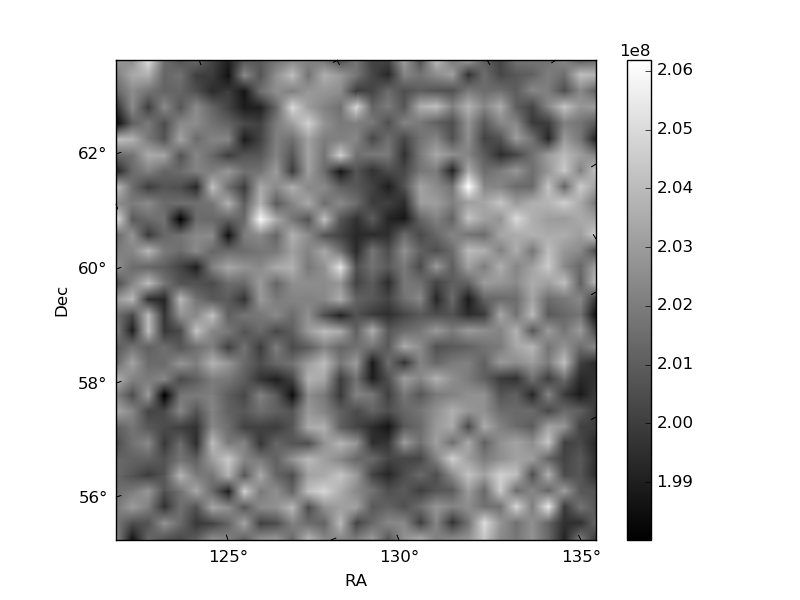
Histogram calculated using DETX and DETY for each event in the final _common_clean file
| Quadrant A | 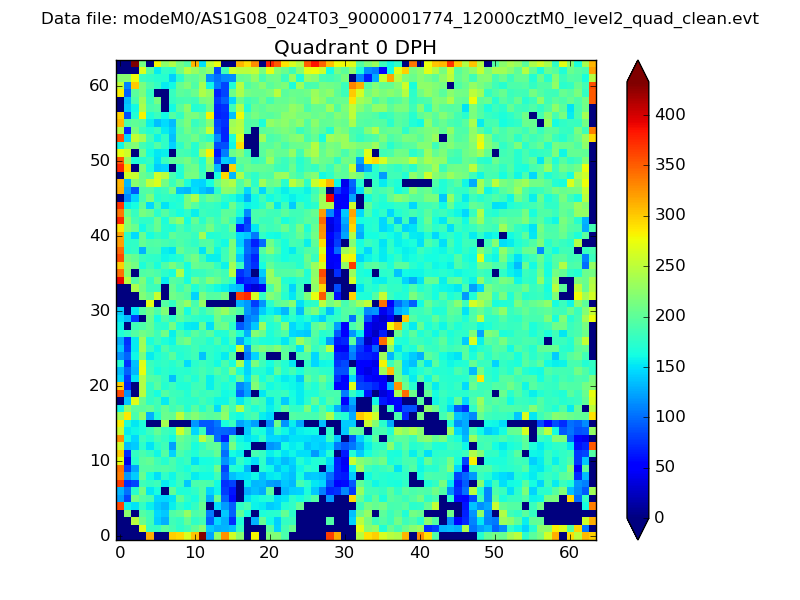 |
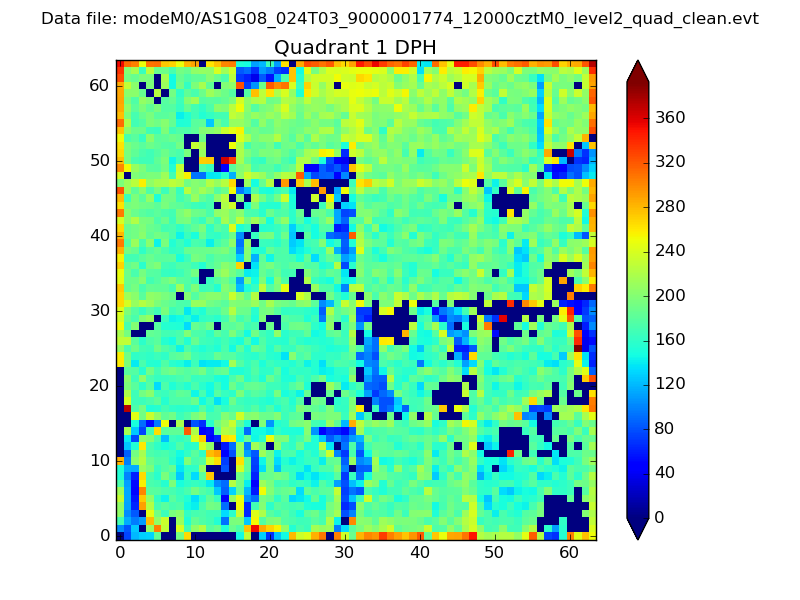 |
Quadrant B |
|---|---|---|---|
| Quadrant D | 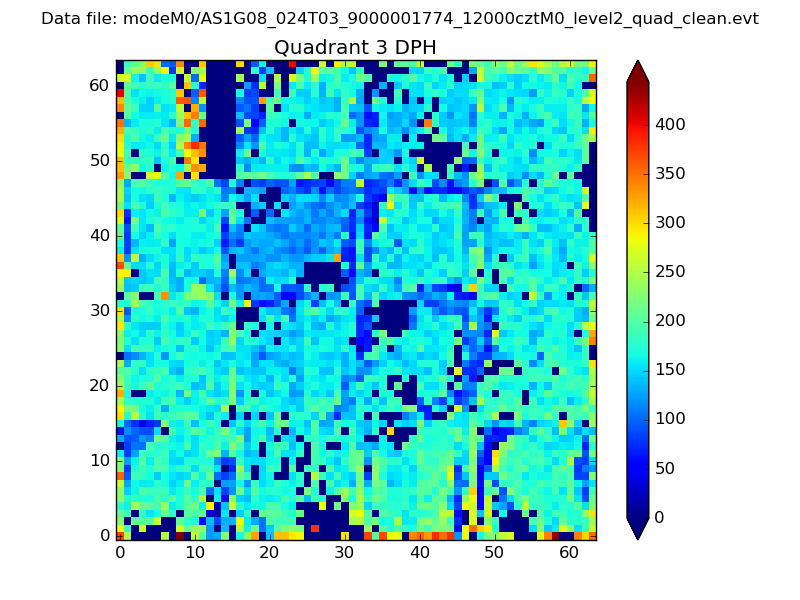 |
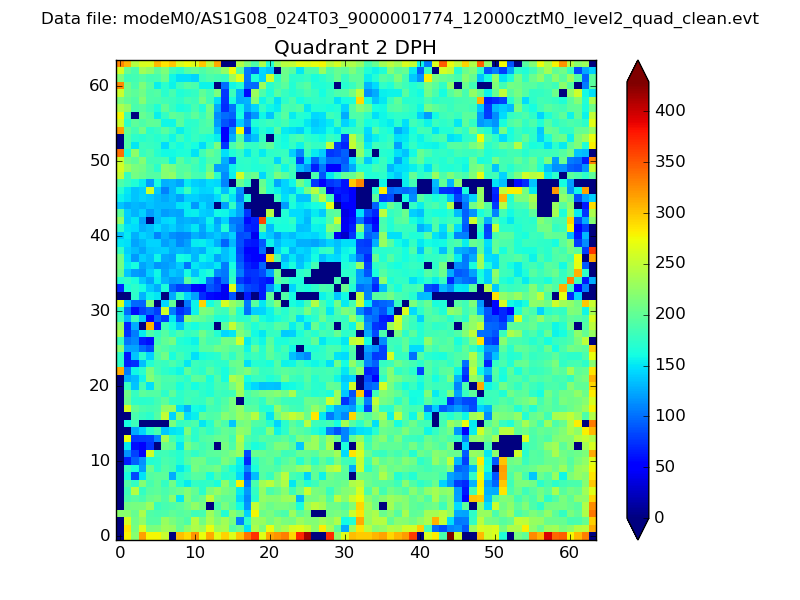 |
Quadrant C |
| Plot type | Count rate plots | Images |
|---|---|---|
| Comparison with Poisson distribution Blue bars denote a histogram of data divided into 1 sec bins. Red curve is a Poisson curve with rate = median count rate of data. |
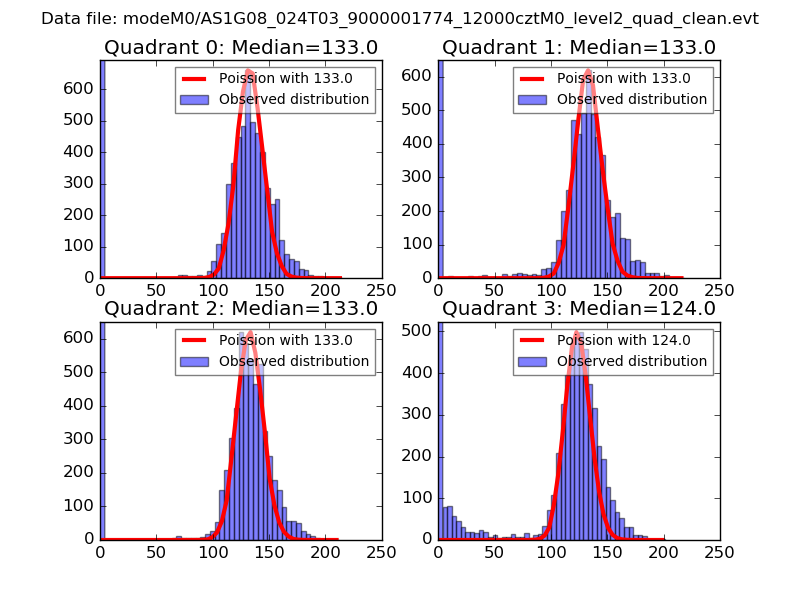 |
 |
| Quadrant-wise count rates Data is divided into 100 sec bins |
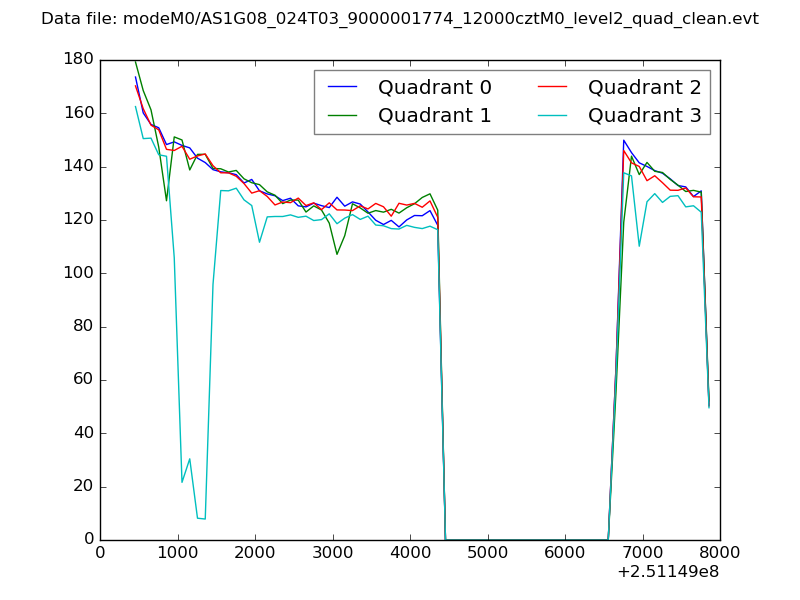 |
|
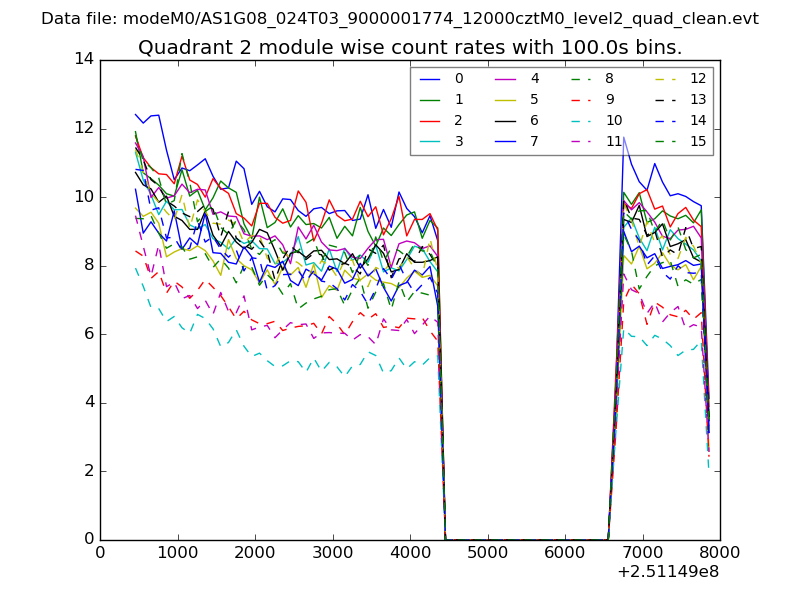
| Module-wise count rates for Quadrant A Data is divided into 100 sec bins |
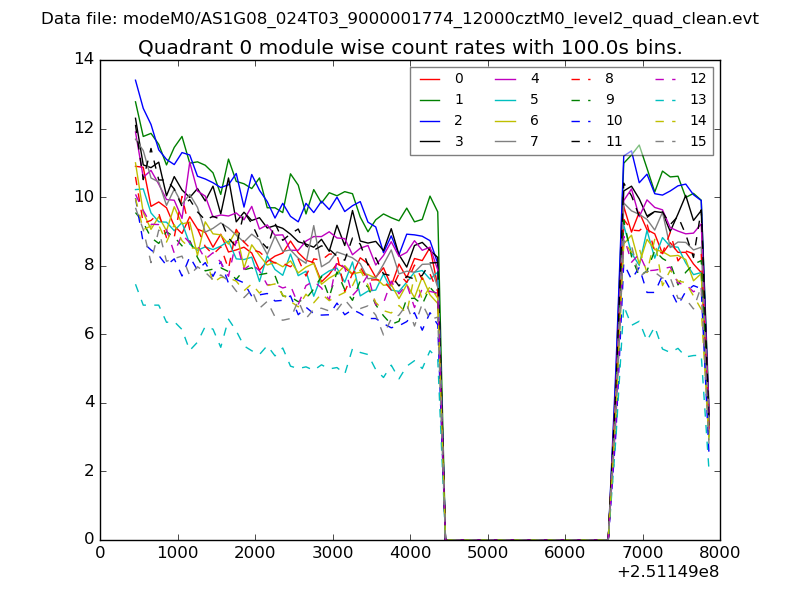 |
 |
| Module-wise count rates for Quadrant B Data is divided into 100 sec bins |
 |
 |
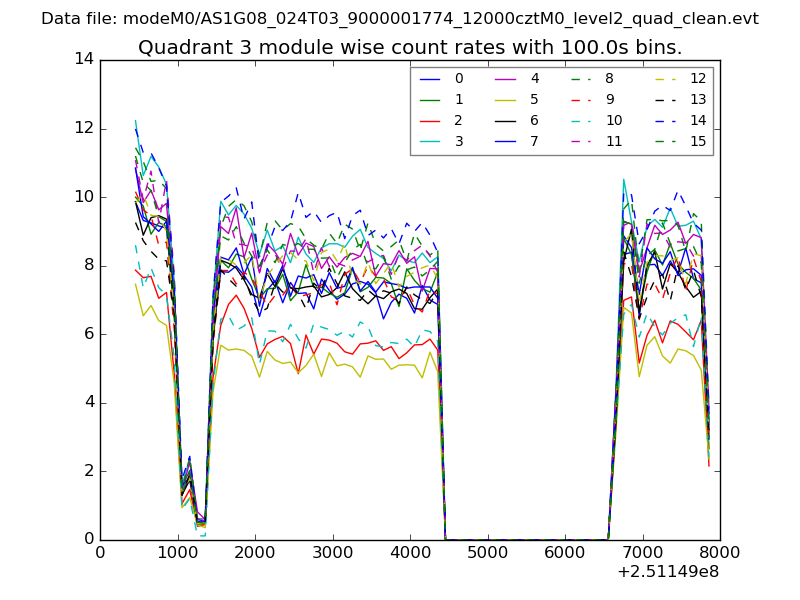
| Module-wise count rates for Quadrant C Data is divided into 100 sec bins |
 |
 |
| Module-wise count rates for Quadrant D Data is divided into 100 sec bins |
 |
 |
| Parameter | Plot |
|---|---|
| CZT HV Monitor | 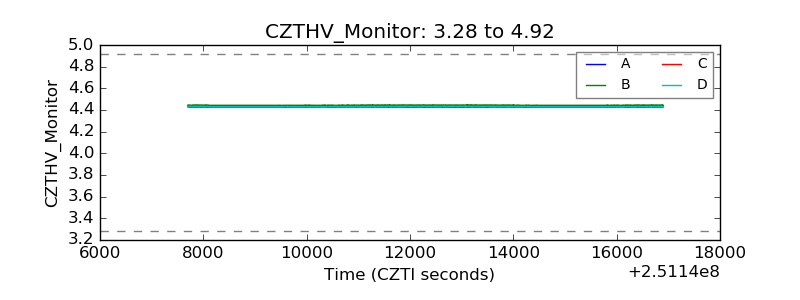 |
| D_VDD | 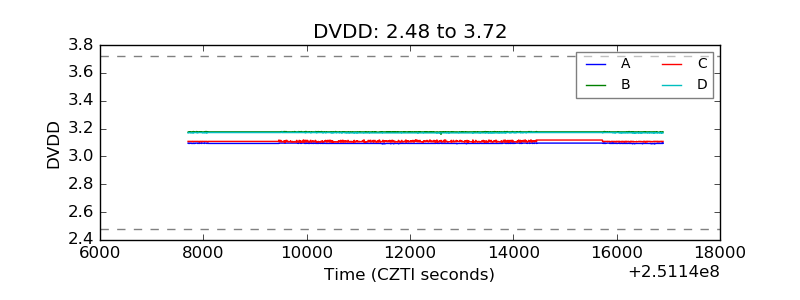 |
| Temperature 1 | 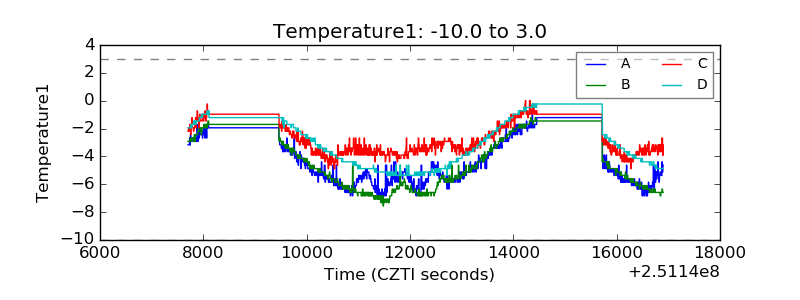 |
| Veto HV Monitor | 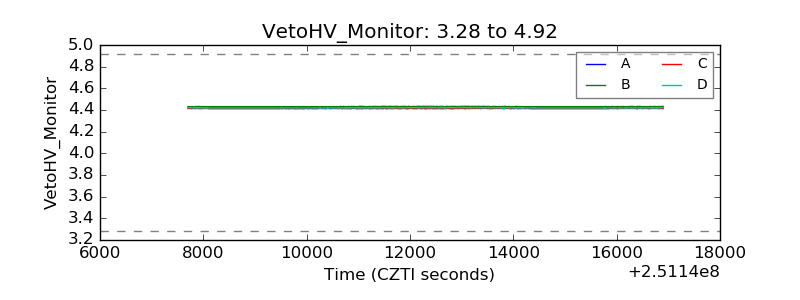 |
| Veto LLD | 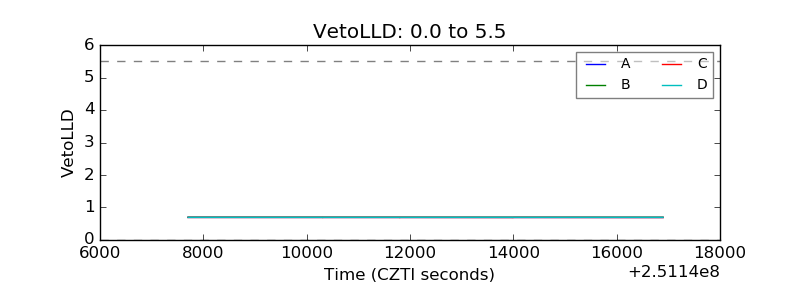 |
| Alpha Counter | 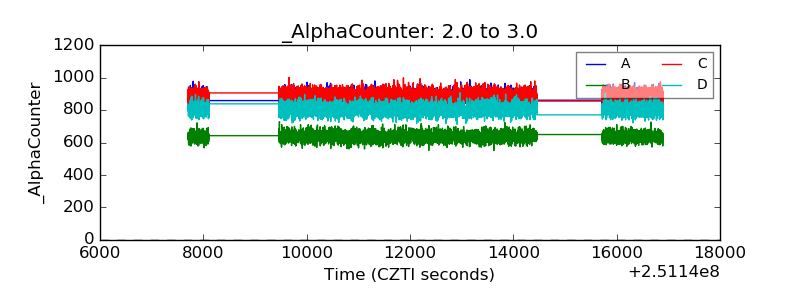 |
| _CPM_Rate | 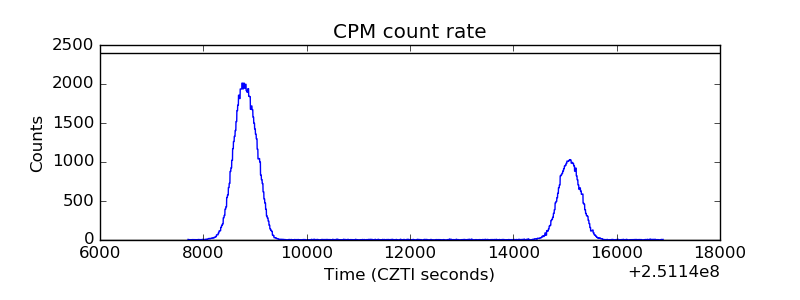 |
| CZT Counter | 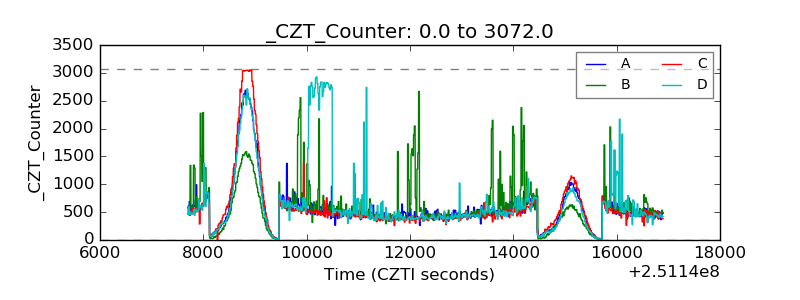 |
| +2.5 Volts monitor |  |
| +5 Volts monitor |  |
| _ROLL_ROT | 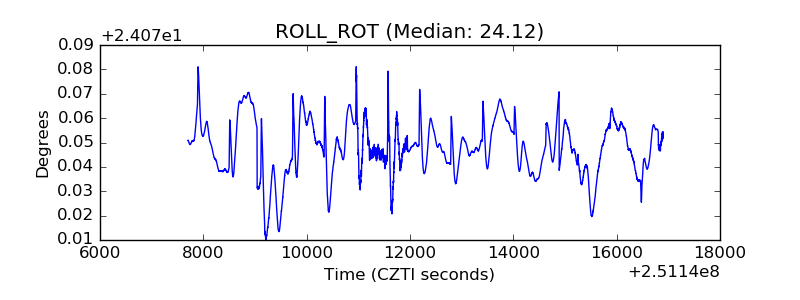 |
| _Roll_DEC | 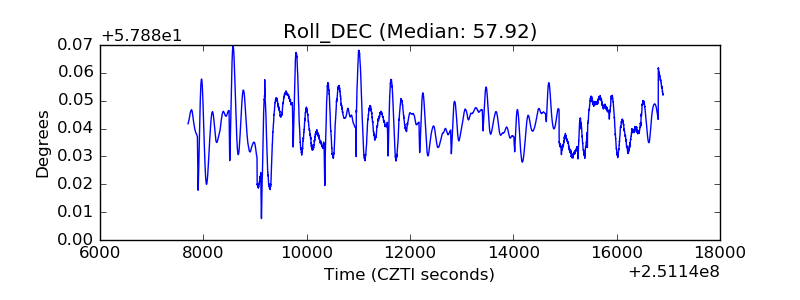 |
| _Roll_RA | 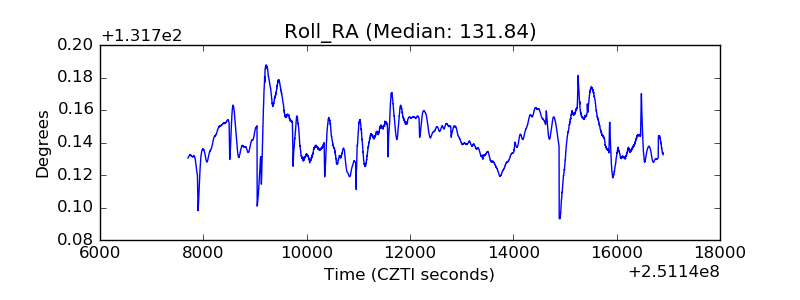 |
| Veto Counter | 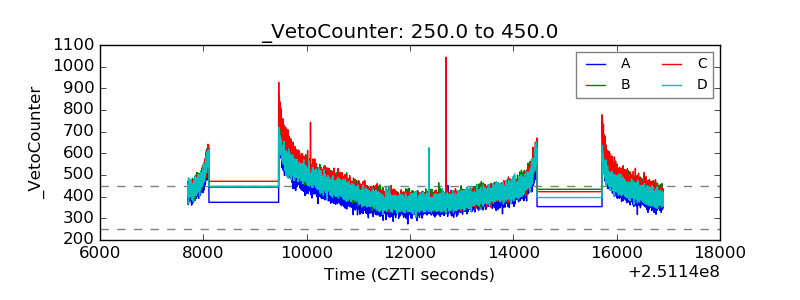 |