| Param | Original file | Final file |
|---|---|---|
| Filename | modeM0/AS1G08_024T03_9000001774_12002cztM0_level2.evt | modeM0/AS1G08_024T03_9000001774_12002cztM0_level2_quad_clean.evt |
| Size (bytes) | 614,580,480 | 102,208,320 |
| Size | 586.1 MB | 97.5 MB |
| Events in quadrant A | 4,086,645 | 652,069 |
| Events in quadrant B | 5,719,720 | 638,368 |
| Events in quadrant C | 3,559,318 | 644,036 |
| Events in quadrant D | 4,711,491 | 611,767 |
| Mode SS | |||
|---|---|---|---|
| Quadrant | BADHDUFLAG | Total packets | Discarded packets |
| A | 0 | 162 | 0 |
| B | 0 | 162 | 0 |
| C | 0 | 162 | 0 |
| D | 0 | 162 | 0 |
| Mode M9 | |||
|---|---|---|---|
| Quadrant | BADHDUFLAG | Total packets | Discarded packets |
| A | 0 | 16 | 0 |
| B | 0 | 16 | 0 |
| C | 0 | 16 | 0 |
| D | 0 | 16 | 0 |
| Mode M0 | |||
|---|---|---|---|
| Quadrant | BADHDUFLAG | Total packets | Discarded packets |
| A | 0 | 17608 | 3 |
| B | 0 | 22660 | 2 |
| C | 0 | 16286 | 2 |
| D | 0 | 19503 | 2 |
| Quadrant | Total seconds | Saturated seconds | Saturation percentage |
|---|---|---|---|
| A | 7895 | 112 | 1.418619% |
| B | 7895 | 878 | 11.120963% |
| C | 7895 | 38 | 0.481317% |
| D | 7895 | 259 | 3.280557% |
Noise dominated data is calculated using 1-second bins in cleaned event files. If a bin has >2000 counts, and if more than 50% of those come from <1% of pixels, then it is considered to be noise-dominated and hence unusable.
| Quadrant | # 1 sec bins | Bins with >0 counts | Bins with >2000 counts | High rate bins dominated by noise | Noise dominated (total time) | Noise dominated (detector-on time) | Marked lightcurve |
|---|---|---|---|---|---|---|---|
| A | 9496 | 7897 | 10 | 10 | 0.11% | 0.13% | 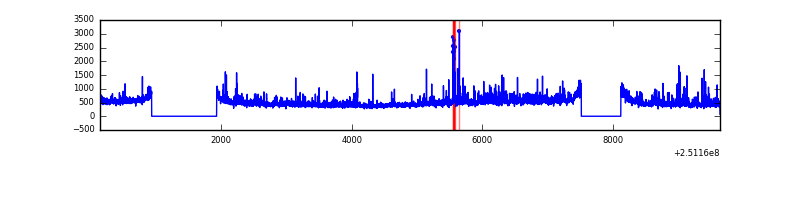 |
| B | 9496 | 7897 | 456 | 456 | 4.80% | 5.77% | 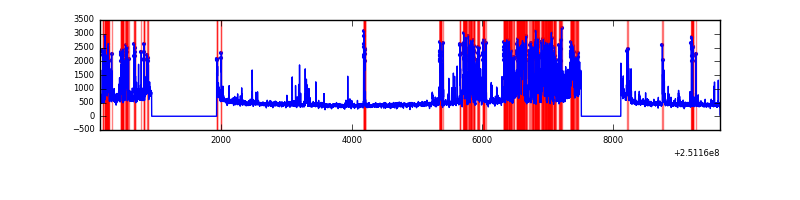 |
| C | 9496 | 7897 | 0 | 0 | 0.00% | 0.00% | 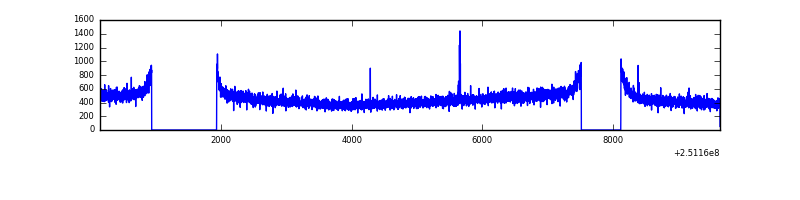 |
| D | 9496 | 7898 | 204 | 204 | 2.15% | 2.58% | 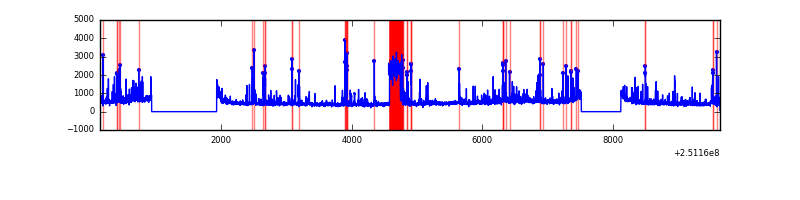 |
Top three noisy pixels from each quadrant. If the there are fewer than three noisy pixels in the level2.evt file, extra rows are filled as -1
| Pixel properties | Quadrant properties | ||||||
|---|---|---|---|---|---|---|---|
| Quadrant | DetID | PixID | Counts | Sigma | Mean | Median | Sigma |
| A | 1 | 162 | 170085 | 888.18 | 933 | 913 | 190.5 |
| A | 1 | 178 | 92978 | 483.35 | 933 | 913 | 190.5 |
| A | 1 | 161 | 80561 | 418.16 | 933 | 913 | 190.5 |
| B | 4 | 239 | 1028642 | 5941.2 | 900 | 876 | 173.0 |
| B | 3 | 64 | 829287 | 4788.79 | 900 | 876 | 173.0 |
| B | 0 | 85 | 143859 | 826.54 | 900 | 876 | 173.0 |
| C | 7 | 247 | 12373 | 54.28 | 909 | 908 | 211.2 |
| C | 13 | 61 | 6660 | 27.23 | 909 | 908 | 211.2 |
| C | 12 | 4 | 2608 | 8.05 | 909 | 908 | 211.2 |
| D | 1 | 52 | 580860 | 2714.35 | 891 | 865 | 213.7 |
| D | 13 | 104 | 198550 | 925.16 | 891 | 865 | 213.7 |
| D | 8 | 195 | 187582 | 873.83 | 891 | 865 | 213.7 |
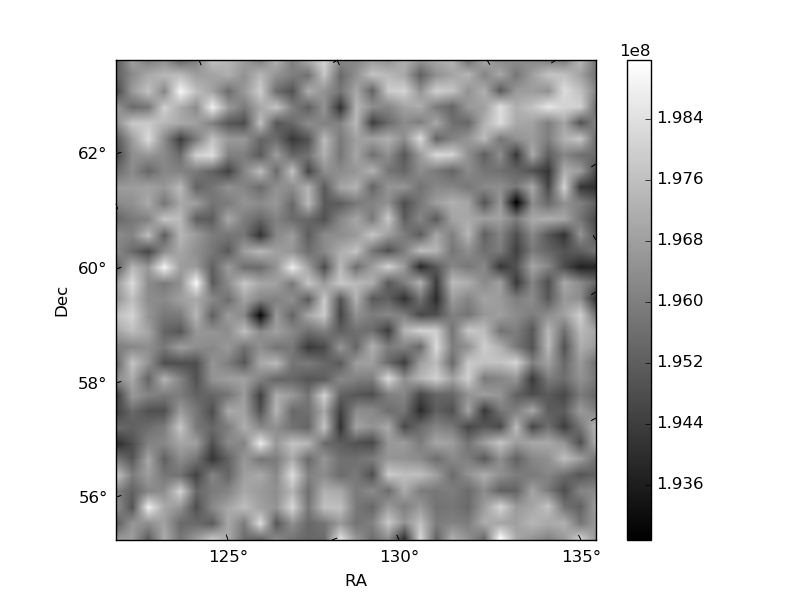
Histogram calculated using DETX and DETY for each event in the final _common_clean file
| Quadrant A |  |
 |
Quadrant B |
|---|---|---|---|
| Quadrant D |  |
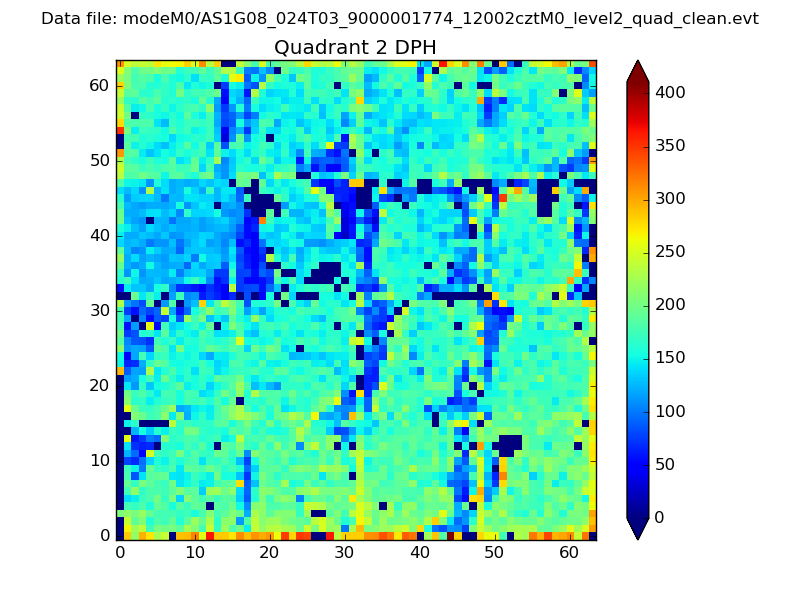 |
Quadrant C |
| Plot type | Count rate plots | Images |
|---|---|---|
| Comparison with Poisson distribution Blue bars denote a histogram of data divided into 1 sec bins. Red curve is a Poisson curve with rate = median count rate of data. |
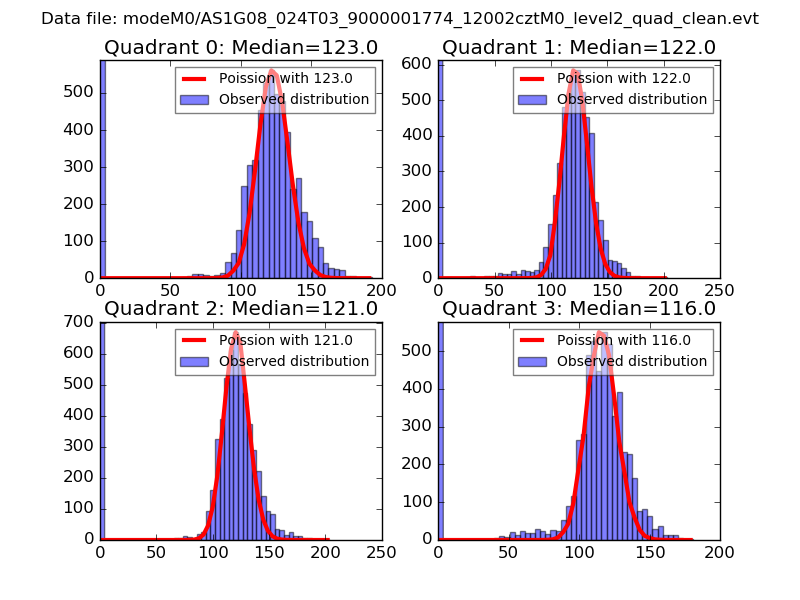 |
 |
| Quadrant-wise count rates Data is divided into 100 sec bins |
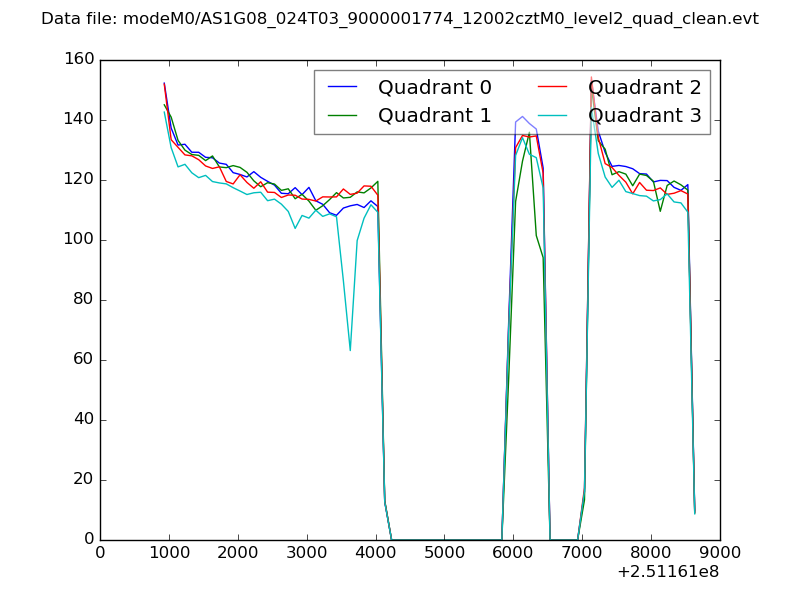 |
|
| Module-wise count rates for Quadrant A Data is divided into 100 sec bins |
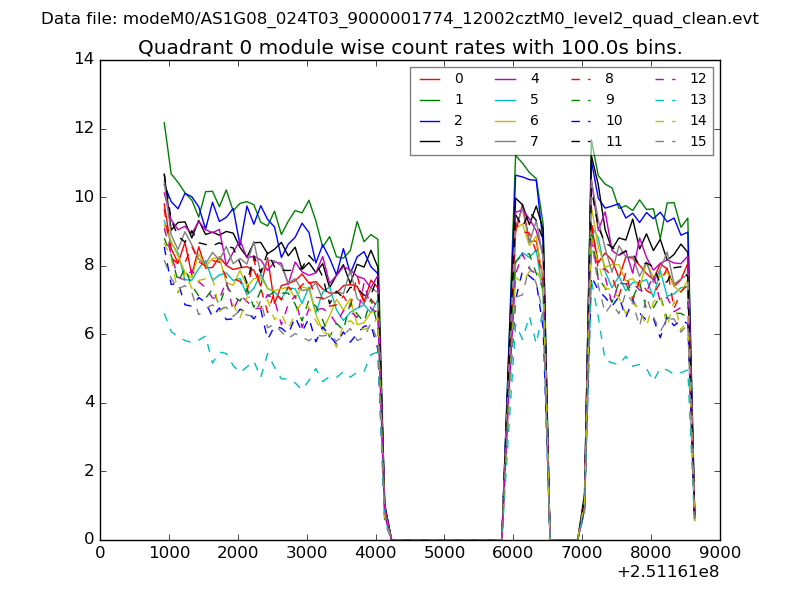 |
 |
| Module-wise count rates for Quadrant B Data is divided into 100 sec bins |
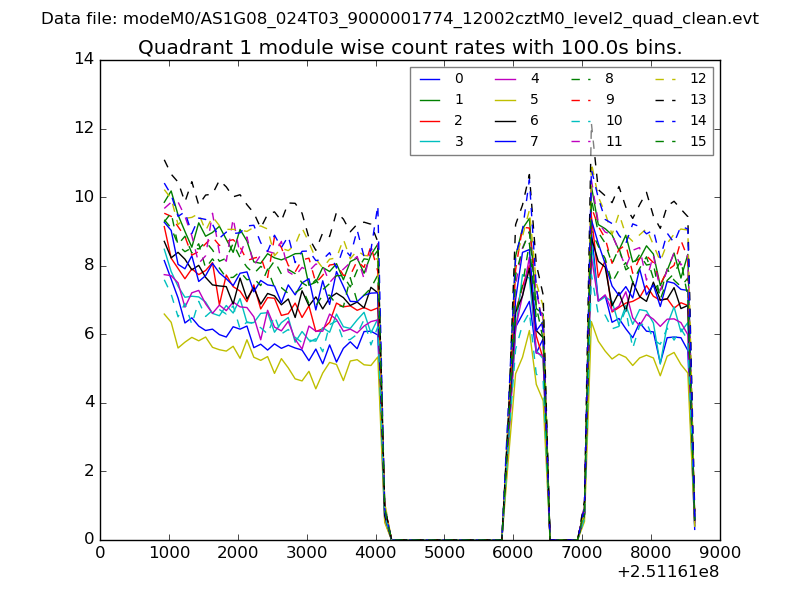 |
 |
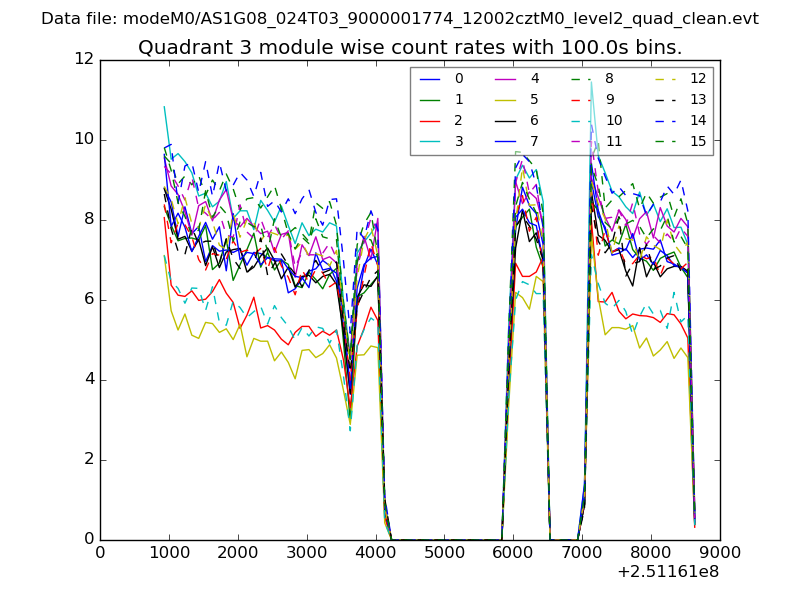
| Module-wise count rates for Quadrant C Data is divided into 100 sec bins |
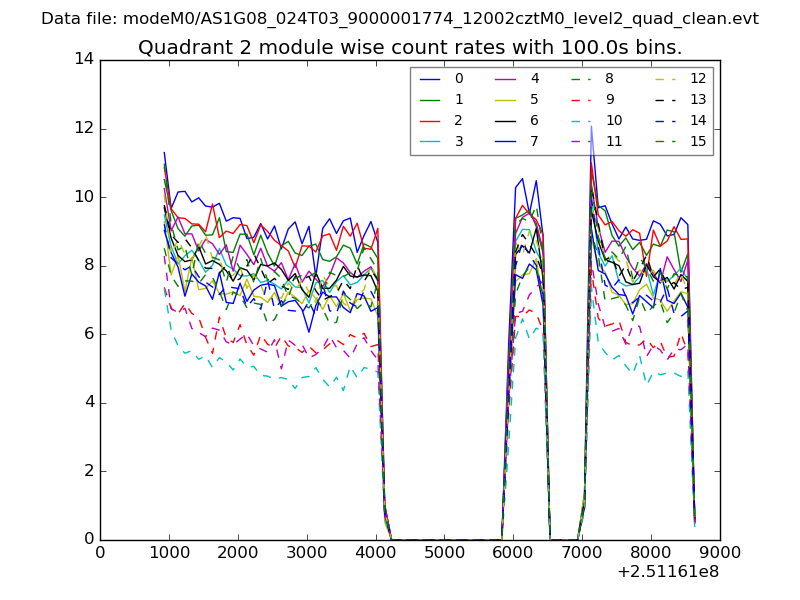 |
 |
| Module-wise count rates for Quadrant D Data is divided into 100 sec bins |
 |
 |
| Parameter | Plot |
|---|---|
| CZT HV Monitor | 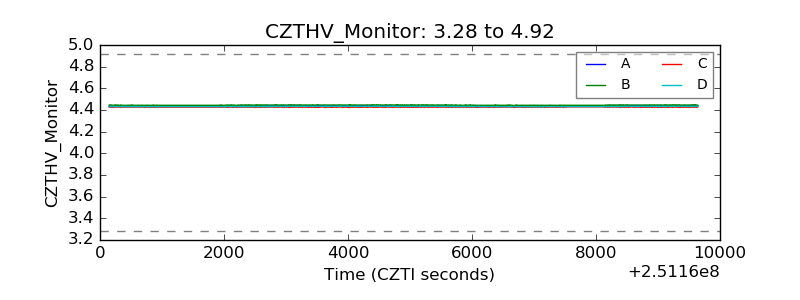 |
| D_VDD | 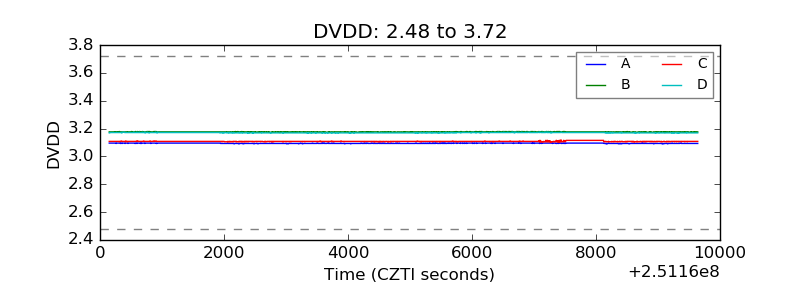 |
| Temperature 1 | 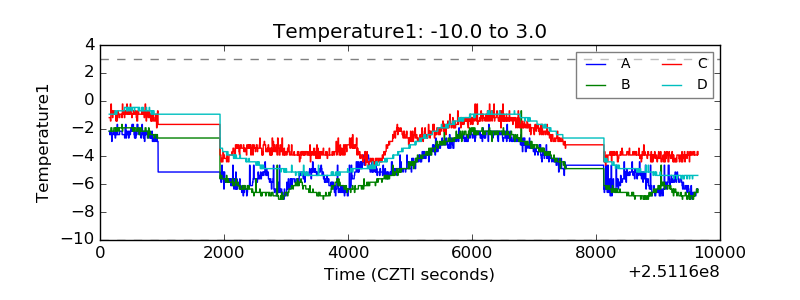 |
| Veto HV Monitor | 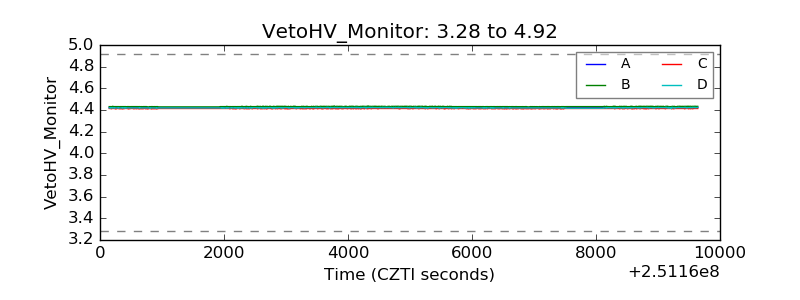 |
| Veto LLD | 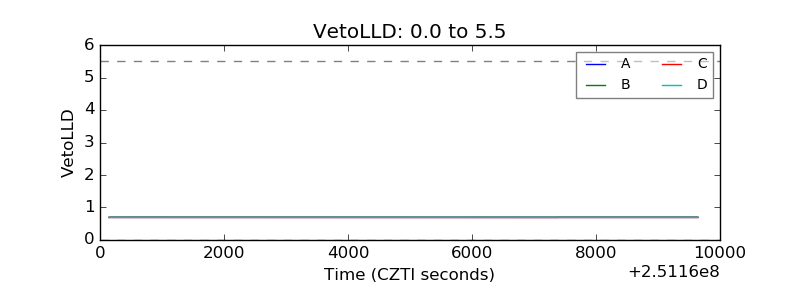 |
| Alpha Counter | 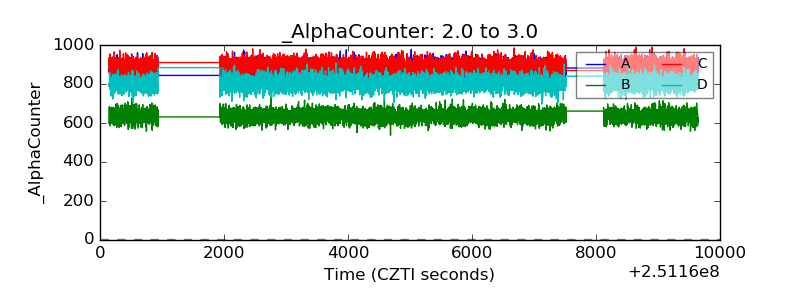 |
| _CPM_Rate | 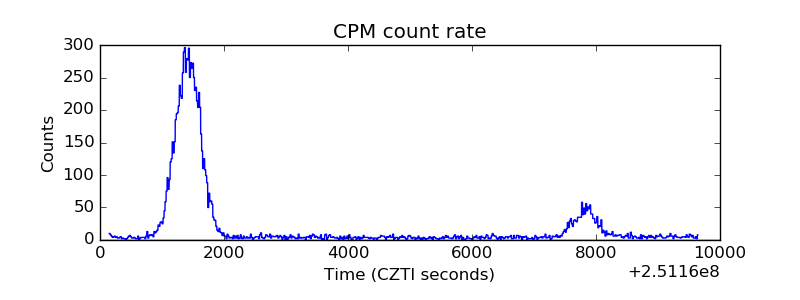 |
| CZT Counter | 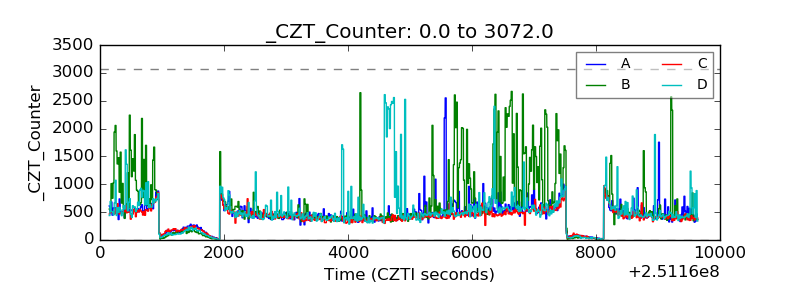 |
| +2.5 Volts monitor |  |
| +5 Volts monitor |  |
| _ROLL_ROT | 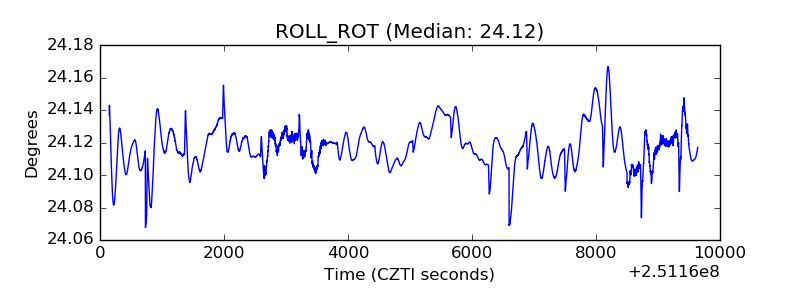 |
| _Roll_DEC | 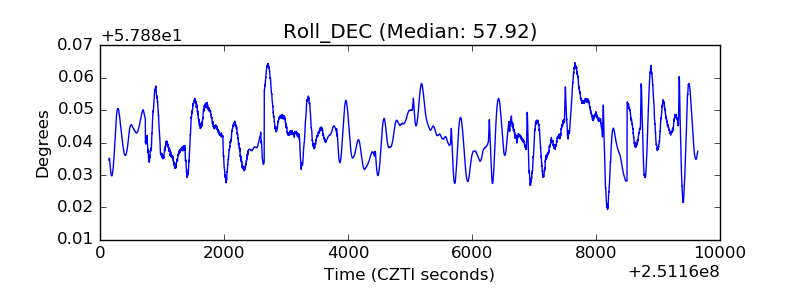 |
| _Roll_RA | 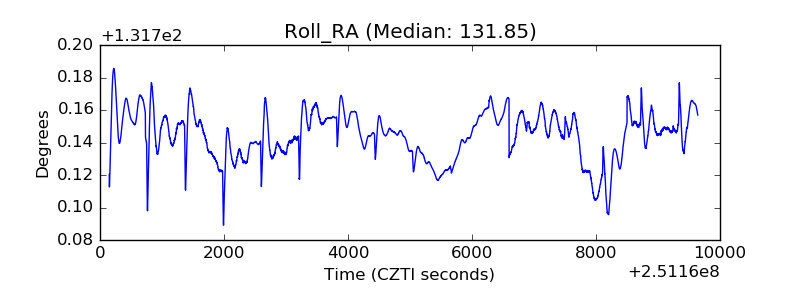 |
| Veto Counter | 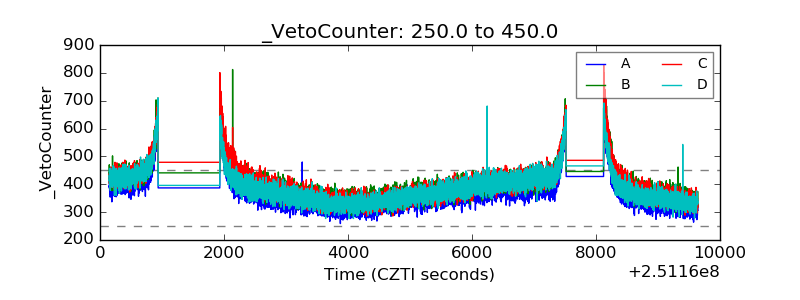 |