| Param | Original file | Final file |
|---|---|---|
| Filename | modeM0/AS1G08_024T03_9000001774_12003cztM0_level2.evt | modeM0/AS1G08_024T03_9000001774_12003cztM0_level2_quad_clean.evt |
| Size (bytes) | 633,058,560 | 122,644,800 |
| Size | 603.7 MB | 117.0 MB |
| Events in quadrant A | 4,383,047 | 799,001 |
| Events in quadrant B | 5,520,939 | 780,201 |
| Events in quadrant C | 3,829,983 | 789,647 |
| Events in quadrant D | 4,865,026 | 758,129 |
| Mode SS | |||
|---|---|---|---|
| Quadrant | BADHDUFLAG | Total packets | Discarded packets |
| A | 0 | 172 | 0 |
| B | 0 | 172 | 0 |
| C | 0 | 172 | 0 |
| D | 0 | 172 | 0 |
| Mode M9 | |||
|---|---|---|---|
| Quadrant | BADHDUFLAG | Total packets | Discarded packets |
| A | 0 | 8 | 0 |
| B | 0 | 8 | 0 |
| C | 0 | 8 | 0 |
| D | 0 | 8 | 0 |
| Mode M0 | |||
|---|---|---|---|
| Quadrant | BADHDUFLAG | Total packets | Discarded packets |
| A | 0 | 18844 | 3 |
| B | 0 | 22310 | 2 |
| C | 0 | 17568 | 2 |
| D | 0 | 20409 | 2 |
| Quadrant | Total seconds | Saturated seconds | Saturation percentage |
|---|---|---|---|
| A | 8457 | 181 | 2.140239% |
| B | 8457 | 638 | 7.544046% |
| C | 8457 | 54 | 0.638524% |
| D | 8457 | 179 | 2.116590% |
Noise dominated data is calculated using 1-second bins in cleaned event files. If a bin has >2000 counts, and if more than 50% of those come from <1% of pixels, then it is considered to be noise-dominated and hence unusable.
| Quadrant | # 1 sec bins | Bins with >0 counts | Bins with >2000 counts | High rate bins dominated by noise | Noise dominated (total time) | Noise dominated (detector-on time) | Marked lightcurve |
|---|---|---|---|---|---|---|---|
| A | 9263 | 8459 | 1 | 1 | 0.01% | 0.01% | 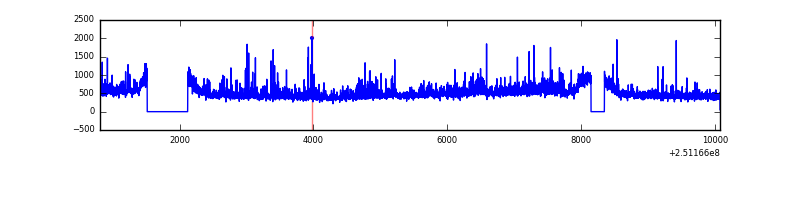 |
| B | 9263 | 8458 | 245 | 245 | 2.64% | 2.90% | 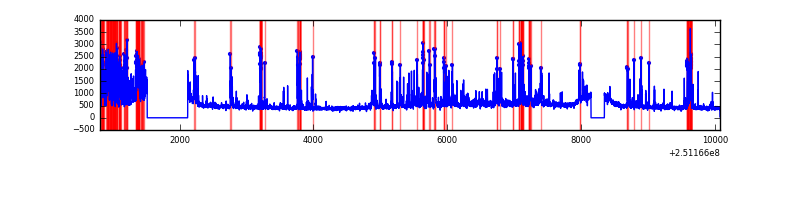 |
| C | 9263 | 8459 | 0 | 0 | 0.00% | 0.00% | 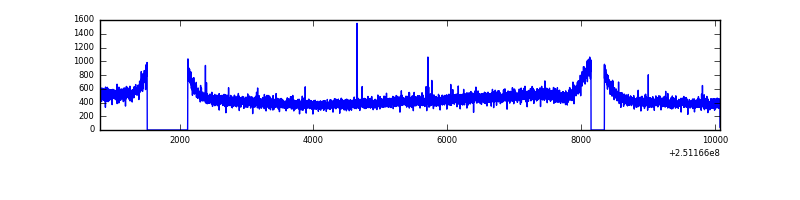 |
| D | 9263 | 8460 | 103 | 103 | 1.11% | 1.22% | 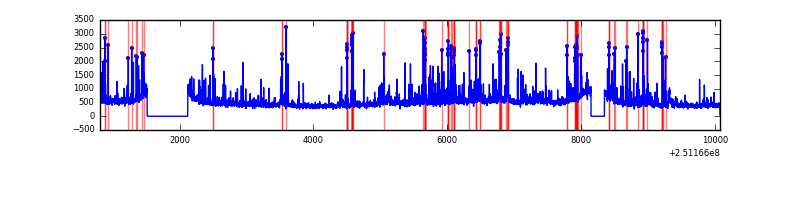 |
Top three noisy pixels from each quadrant. If the there are fewer than three noisy pixels in the level2.evt file, extra rows are filled as -1
| Pixel properties | Quadrant properties | ||||||
|---|---|---|---|---|---|---|---|
| Quadrant | DetID | PixID | Counts | Sigma | Mean | Median | Sigma |
| A | 1 | 162 | 200789 | 969.1 | 1005 | 982 | 206.2 |
| A | 1 | 178 | 108349 | 520.75 | 1005 | 982 | 206.2 |
| A | 1 | 161 | 95025 | 456.12 | 1005 | 982 | 206.2 |
| B | 4 | 239 | 910786 | 4799.98 | 989 | 964 | 189.5 |
| B | 3 | 64 | 469729 | 2473.08 | 989 | 964 | 189.5 |
| B | 15 | 204 | 116939 | 611.85 | 989 | 964 | 189.5 |
| C | 13 | 61 | 7076 | 26.62 | 979 | 979 | 229.0 |
| C | 14 | 234 | 6308 | 23.27 | 979 | 979 | 229.0 |
| C | 0 | 207 | 5834 | 21.2 | 979 | 979 | 229.0 |
| D | 1 | 52 | 615914 | 2630.11 | 965 | 937 | 233.8 |
| D | 8 | 195 | 219538 | 934.91 | 965 | 937 | 233.8 |
| D | 13 | 104 | 157898 | 671.29 | 965 | 937 | 233.8 |
Histogram calculated using DETX and DETY for each event in the final _common_clean file
| Quadrant A | 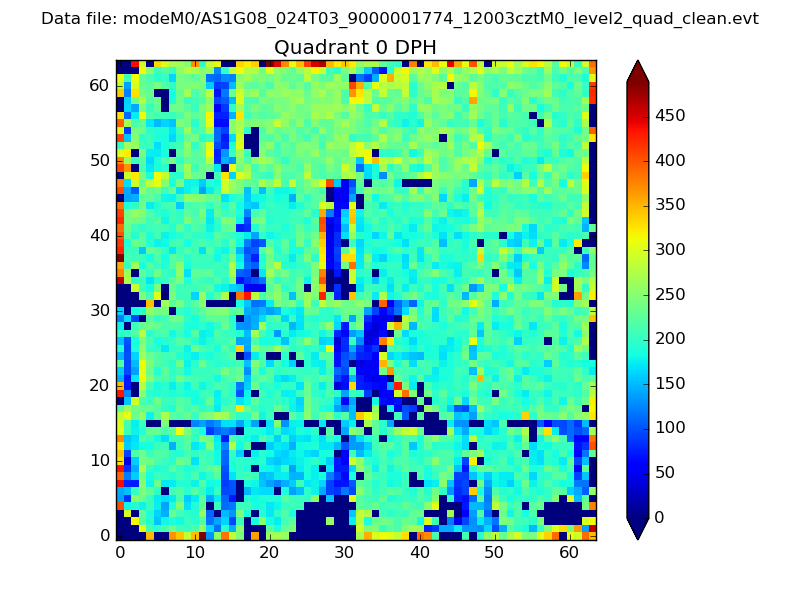 |
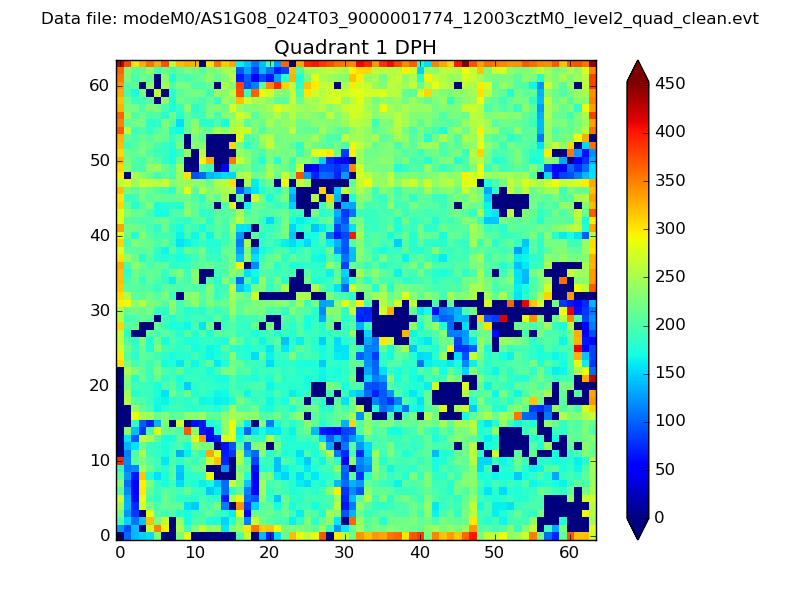 |
Quadrant B |
|---|---|---|---|
| Quadrant D | 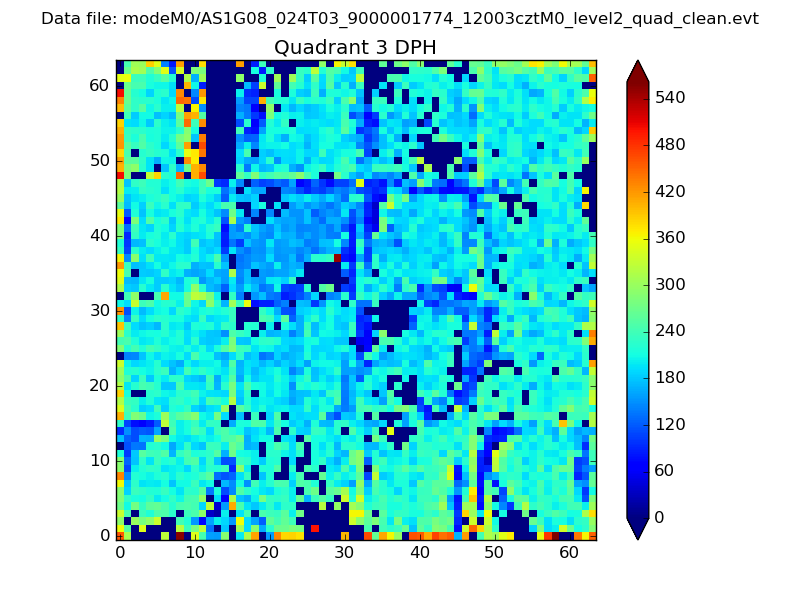 |
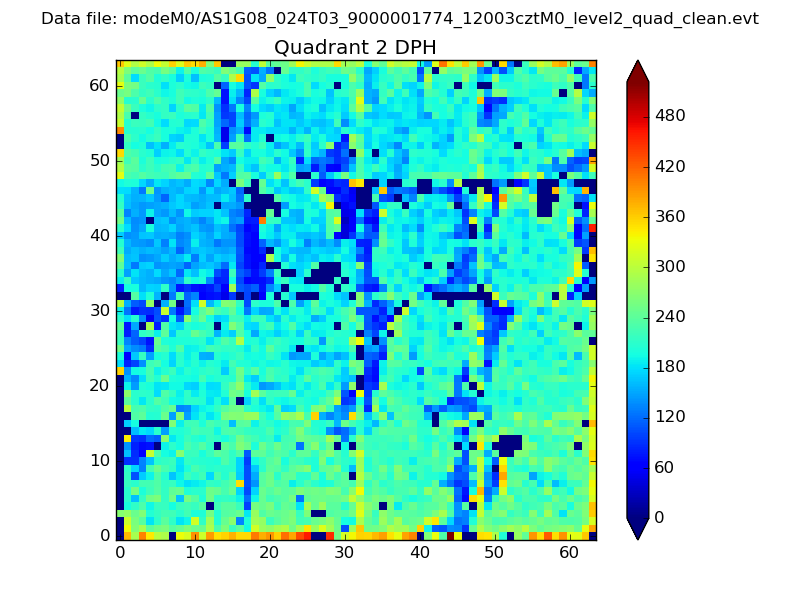 |
Quadrant C |
| Plot type | Count rate plots | Images |
|---|---|---|
| Comparison with Poisson distribution Blue bars denote a histogram of data divided into 1 sec bins. Red curve is a Poisson curve with rate = median count rate of data. |
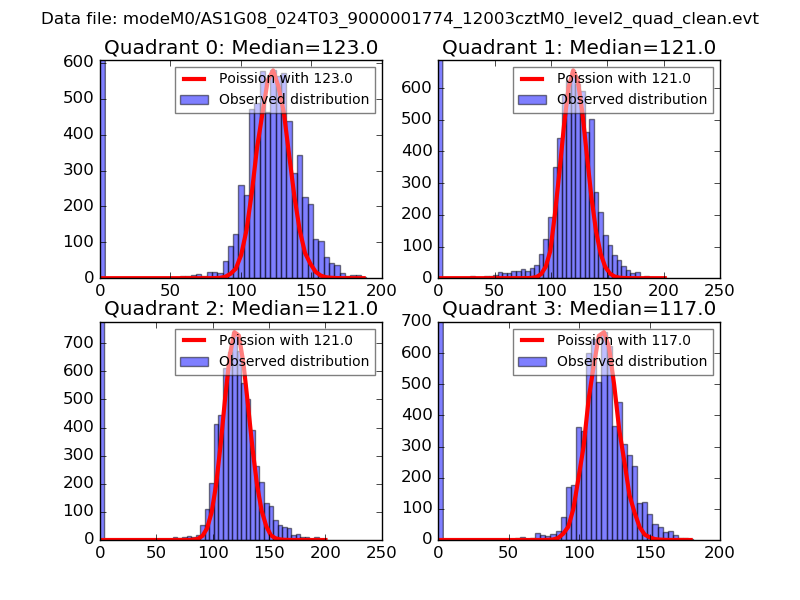 |
 |
| Quadrant-wise count rates Data is divided into 100 sec bins |
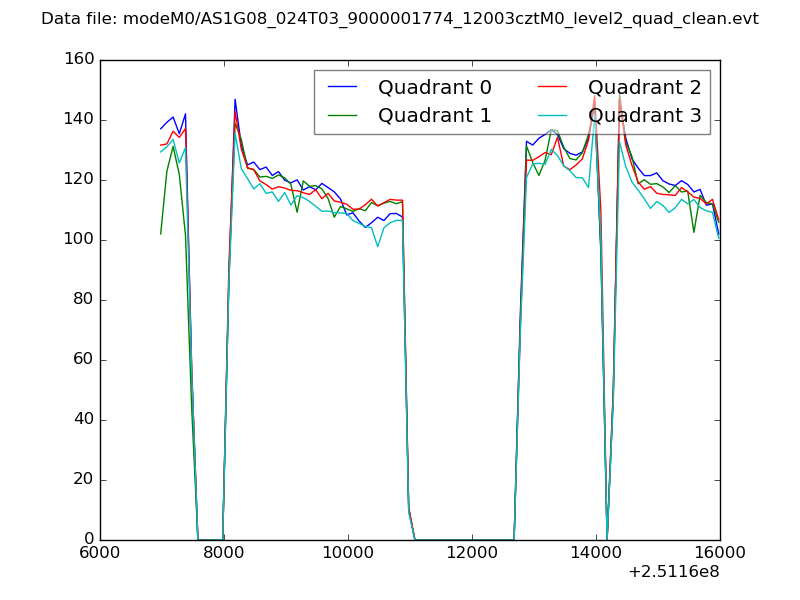 |
|
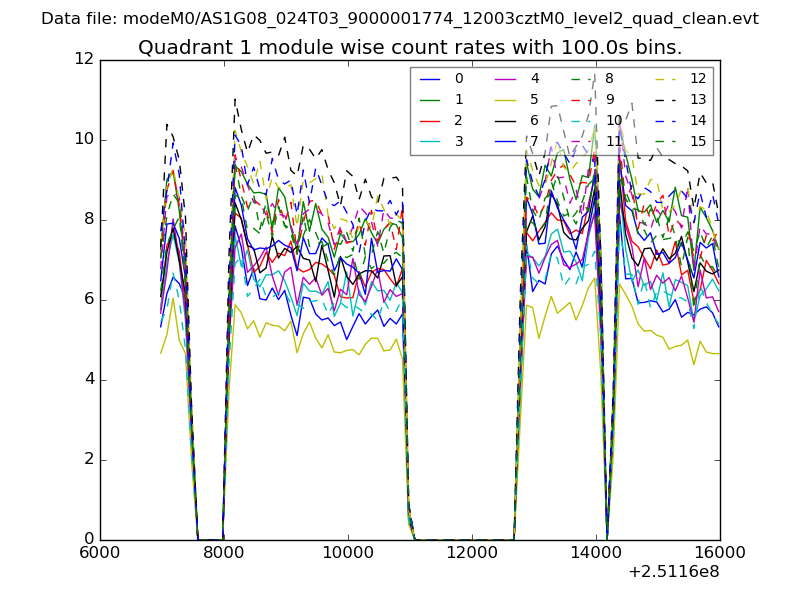
| Module-wise count rates for Quadrant A Data is divided into 100 sec bins |
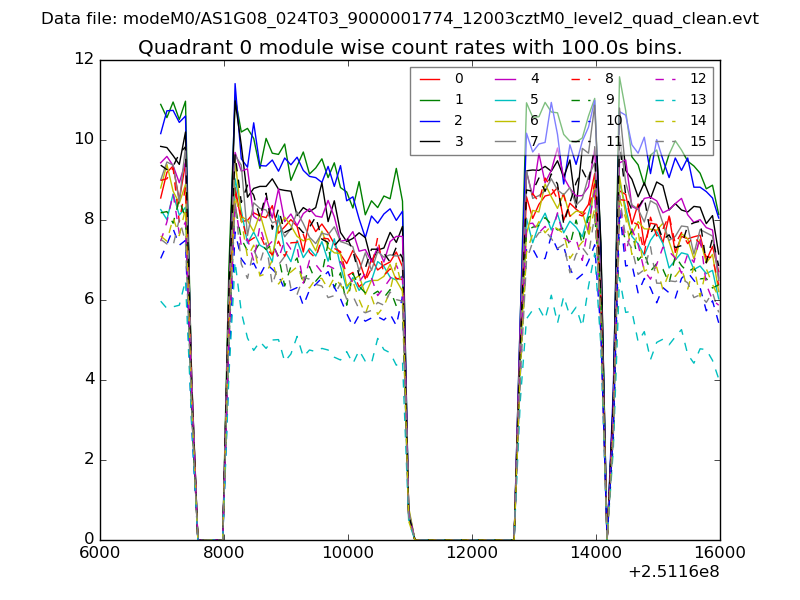 |
 |
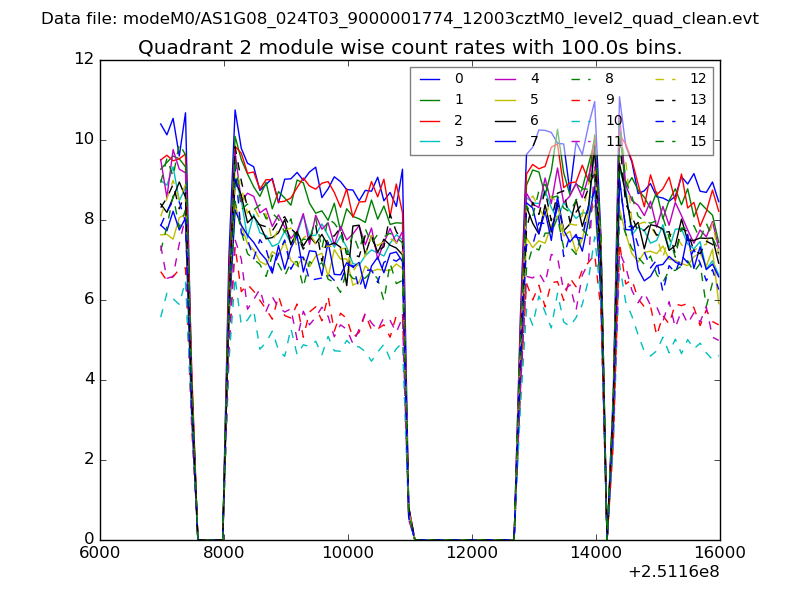
| Module-wise count rates for Quadrant B Data is divided into 100 sec bins |
 |
 |
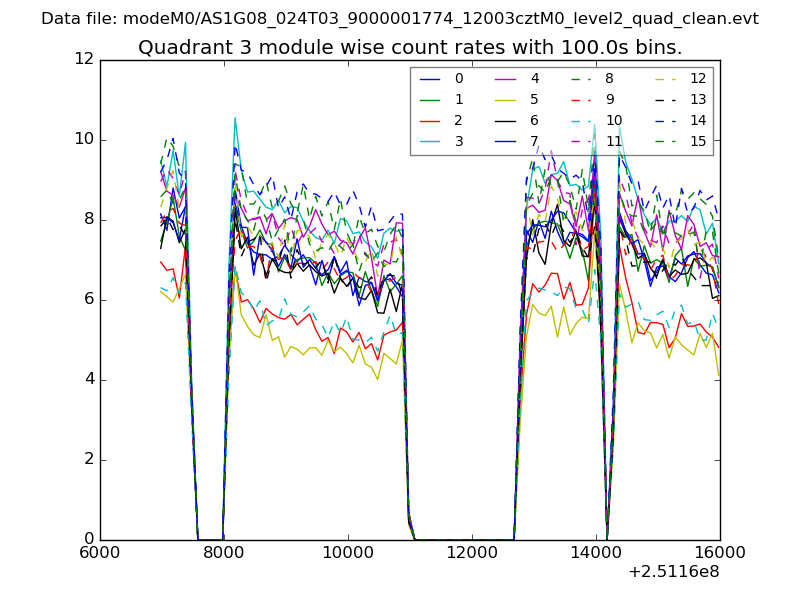
| Module-wise count rates for Quadrant C Data is divided into 100 sec bins |
 |
 |
| Module-wise count rates for Quadrant D Data is divided into 100 sec bins |
 |
 |
| Parameter | Plot |
|---|---|
| CZT HV Monitor | 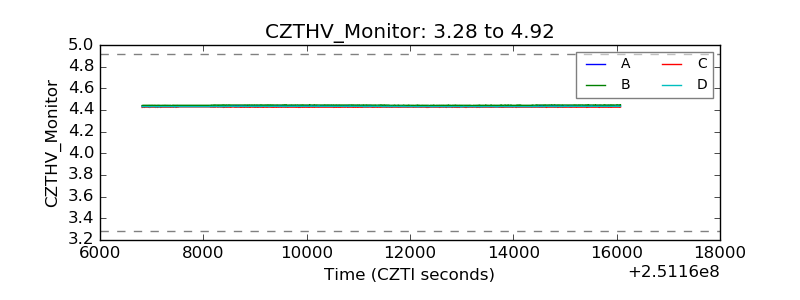 |
| D_VDD | 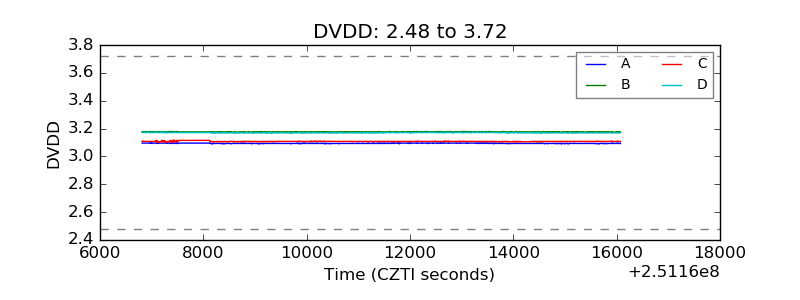 |
| Temperature 1 | 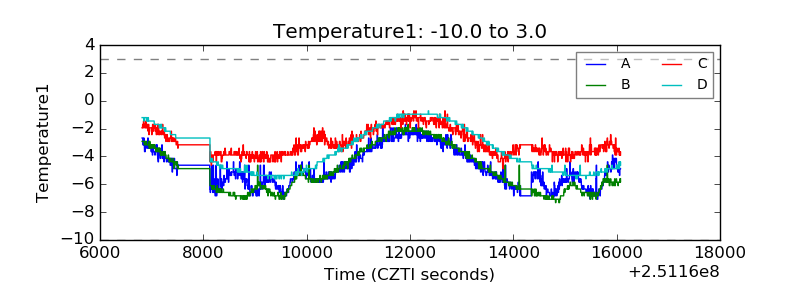 |
| Veto HV Monitor | 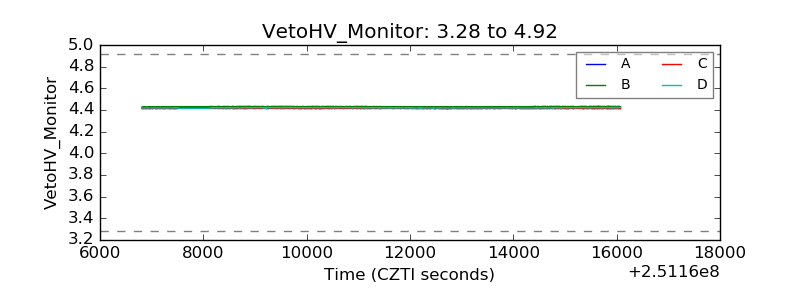 |
| Veto LLD | 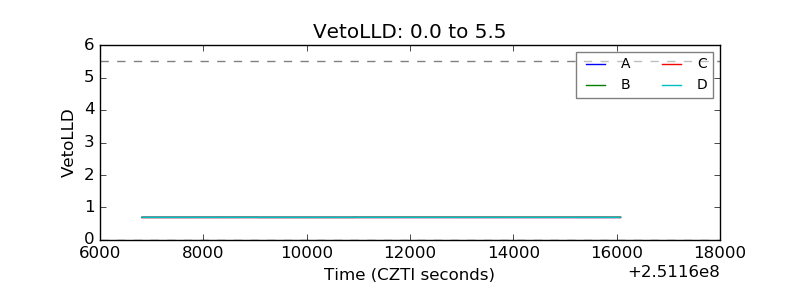 |
| Alpha Counter | 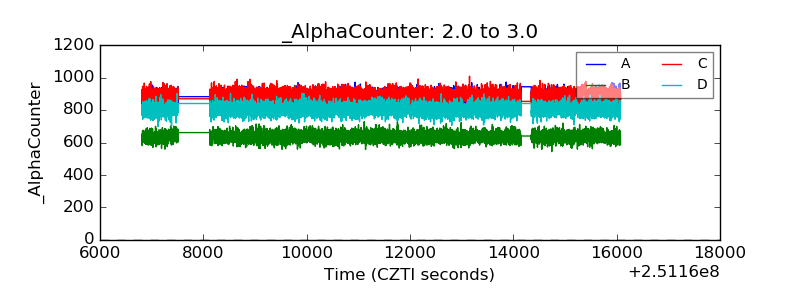 |
| _CPM_Rate | 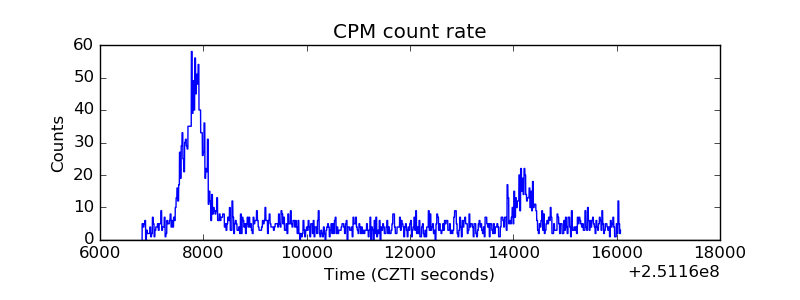 |
| CZT Counter | 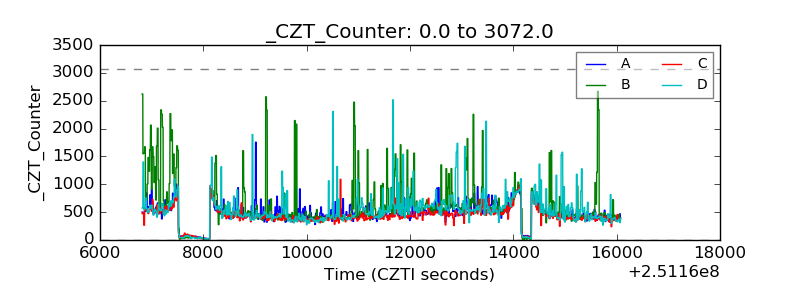 |
| +2.5 Volts monitor |  |
| +5 Volts monitor | 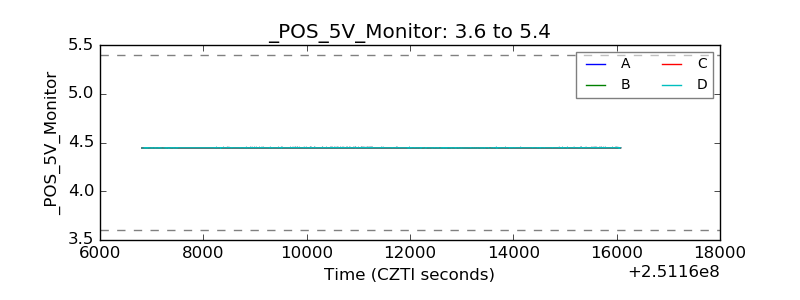 |
| _ROLL_ROT | 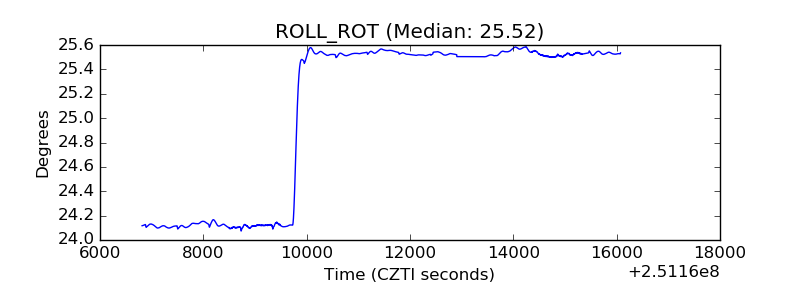 |
| _Roll_DEC | 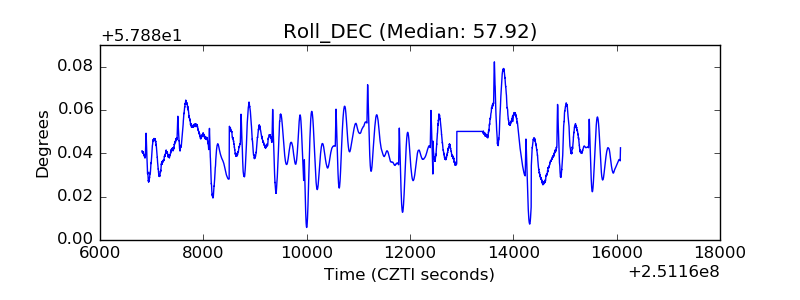 |
| _Roll_RA | 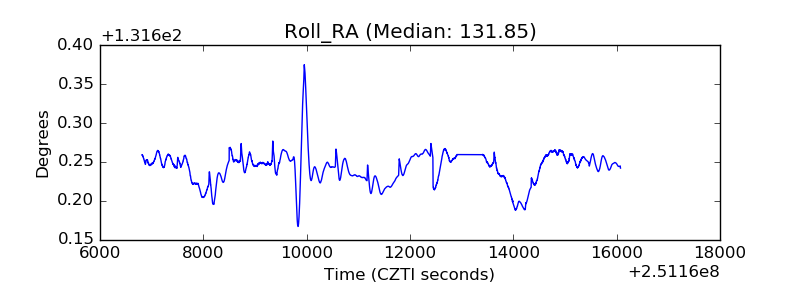 |
| Veto Counter | 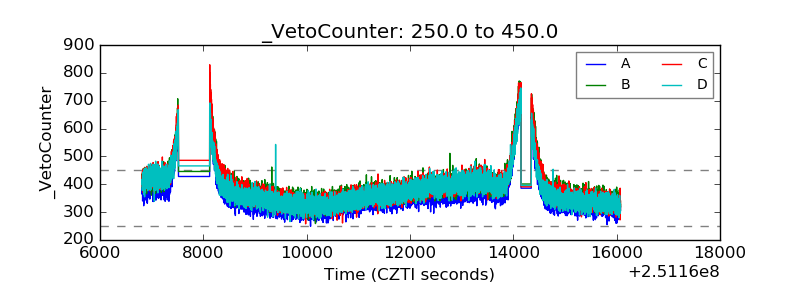 |