| Param | Original file | Final file |
|---|---|---|
| Filename | modeM0/AS1G08_024T03_9000001774_12008cztM0_level2.evt | modeM0/AS1G08_024T03_9000001774_12008cztM0_level2_quad_clean.evt |
| Size (bytes) | 120,597,120 | 24,647,040 |
| Size | 115.0 MB | 23.5 MB |
| Events in quadrant A | 833,460 | 163,504 |
| Events in quadrant B | 1,095,741 | 155,572 |
| Events in quadrant C | 745,965 | 156,560 |
| Events in quadrant D | 866,371 | 153,017 |
| Mode SS | |||
|---|---|---|---|
| Quadrant | BADHDUFLAG | Total packets | Discarded packets |
| A | 0 | 32 | 0 |
| B | 0 | 32 | 0 |
| C | 0 | 32 | 0 |
| D | 0 | 32 | 0 |
| Mode M0 | |||
|---|---|---|---|
| Quadrant | BADHDUFLAG | Total packets | Discarded packets |
| A | 0 | 3486 | 0 |
| B | 0 | 4268 | 0 |
| C | 0 | 3237 | 0 |
| D | 0 | 3605 | 0 |
| Quadrant | Total seconds | Saturated seconds | Saturation percentage |
|---|---|---|---|
| A | 1587 | 8 | 0.504096% |
| B | 1587 | 78 | 4.914934% |
| C | 1587 | 0 | 0.000000% |
| D | 1587 | 17 | 1.071204% |
Noise dominated data is calculated using 1-second bins in cleaned event files. If a bin has >2000 counts, and if more than 50% of those come from <1% of pixels, then it is considered to be noise-dominated and hence unusable.
| Quadrant | # 1 sec bins | Bins with >0 counts | Bins with >2000 counts | High rate bins dominated by noise | Noise dominated (total time) | Noise dominated (detector-on time) | Marked lightcurve |
|---|---|---|---|---|---|---|---|
| A | 1588 | 1588 | 0 | 0 | 0.00% | 0.00% | 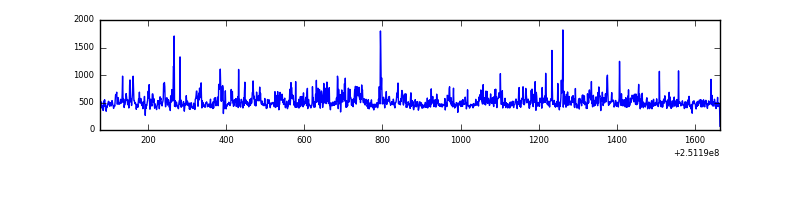 |
| B | 1588 | 1588 | 59 | 59 | 3.72% | 3.72% | 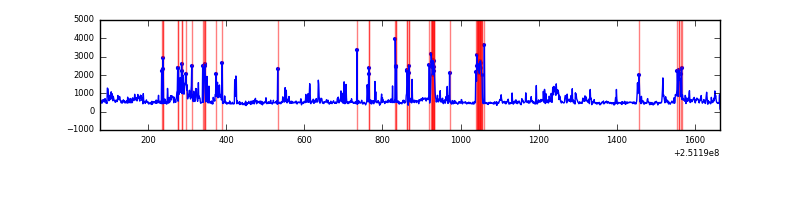 |
| C | 1588 | 1588 | 0 | 0 | 0.00% | 0.00% | 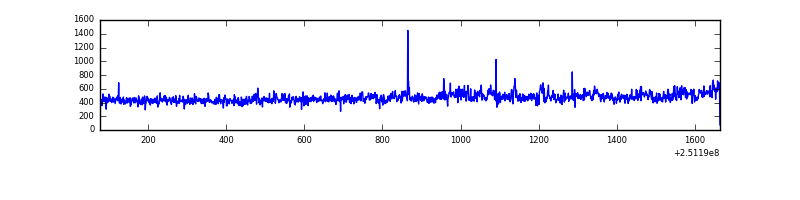 |
| D | 1588 | 1588 | 15 | 15 | 0.94% | 0.94% | 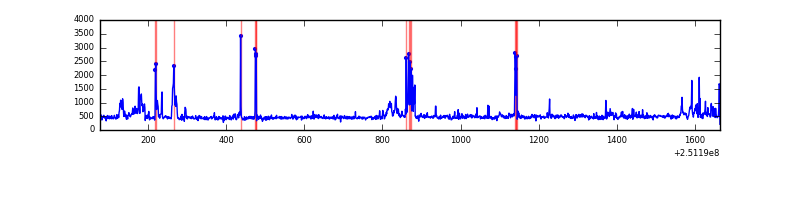 |
Top three noisy pixels from each quadrant. If the there are fewer than three noisy pixels in the level2.evt file, extra rows are filled as -1
| Pixel properties | Quadrant properties | ||||||
|---|---|---|---|---|---|---|---|
| Quadrant | DetID | PixID | Counts | Sigma | Mean | Median | Sigma |
| A | 1 | 162 | 48077 | 1232.34 | 181 | 177 | 38.9 |
| A | 1 | 178 | 26867 | 686.66 | 181 | 177 | 38.9 |
| A | 1 | 161 | 23305 | 595.02 | 181 | 177 | 38.9 |
| B | 4 | 239 | 242446 | 6842.83 | 178 | 173 | 35.4 |
| B | 0 | 231 | 57766 | 1626.67 | 178 | 173 | 35.4 |
| B | 0 | 85 | 29861 | 838.52 | 178 | 173 | 35.4 |
| C | 7 | 247 | 45283 | 1047.98 | 179 | 179 | 43.0 |
| C | 12 | 4 | 2241 | 47.91 | 179 | 179 | 43.0 |
| C | 13 | 61 | 1273 | 25.42 | 179 | 179 | 43.0 |
| D | 1 | 52 | 68539 | 1499.04 | 178 | 173 | 45.6 |
| D | 13 | 104 | 33268 | 725.66 | 178 | 173 | 45.6 |
| D | 8 | 195 | 29374 | 640.28 | 178 | 173 | 45.6 |
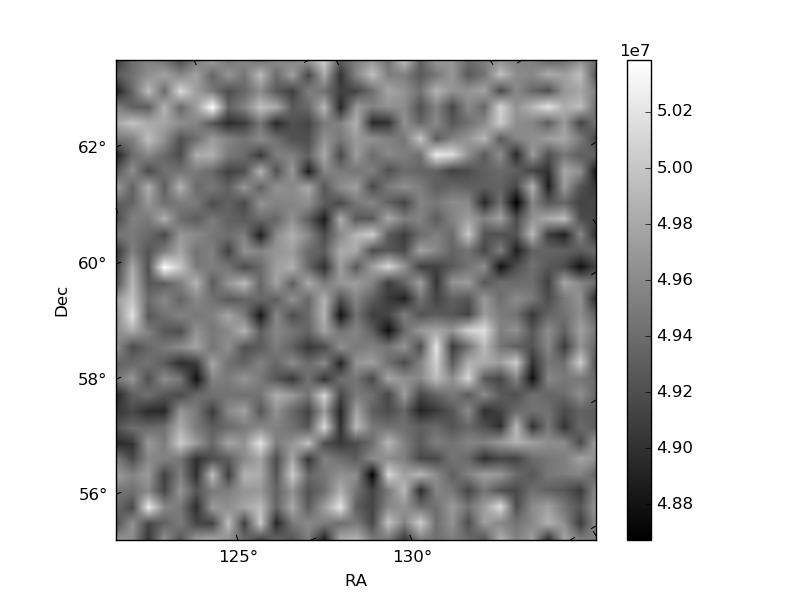
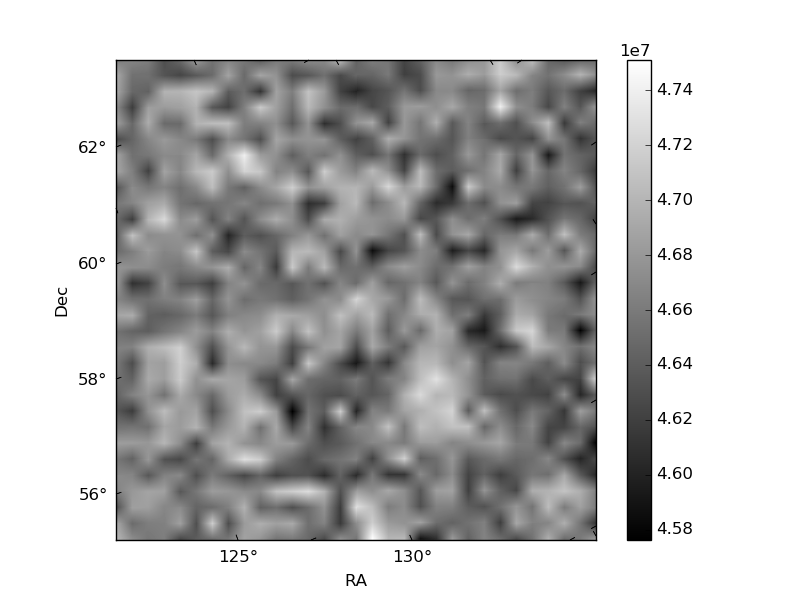
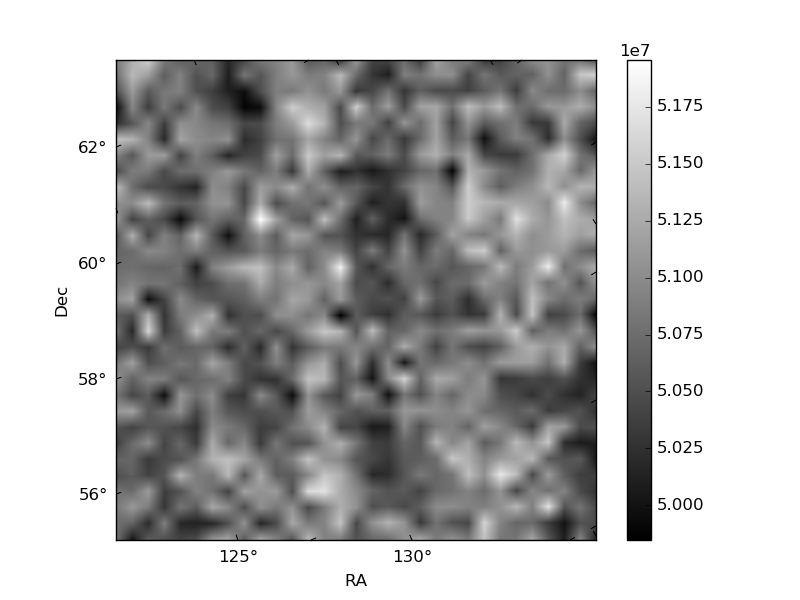
Histogram calculated using DETX and DETY for each event in the final _common_clean file
| Quadrant A | 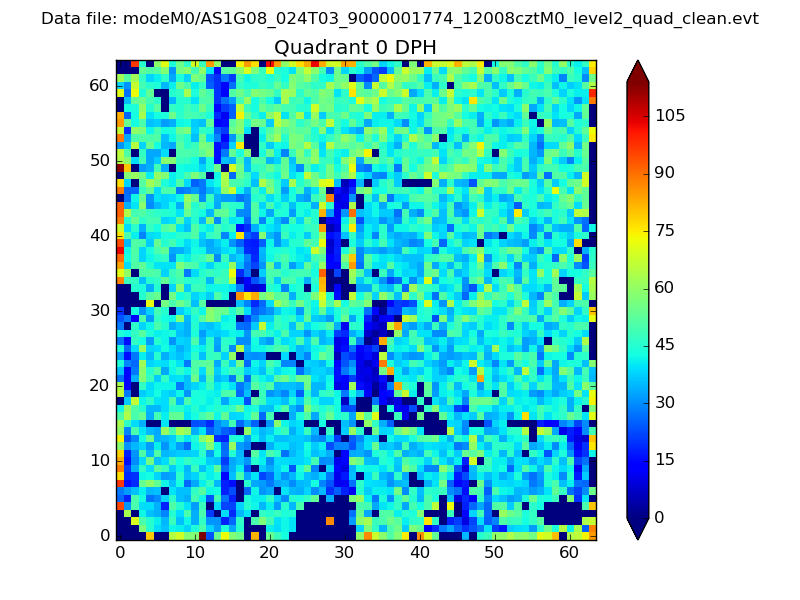 |
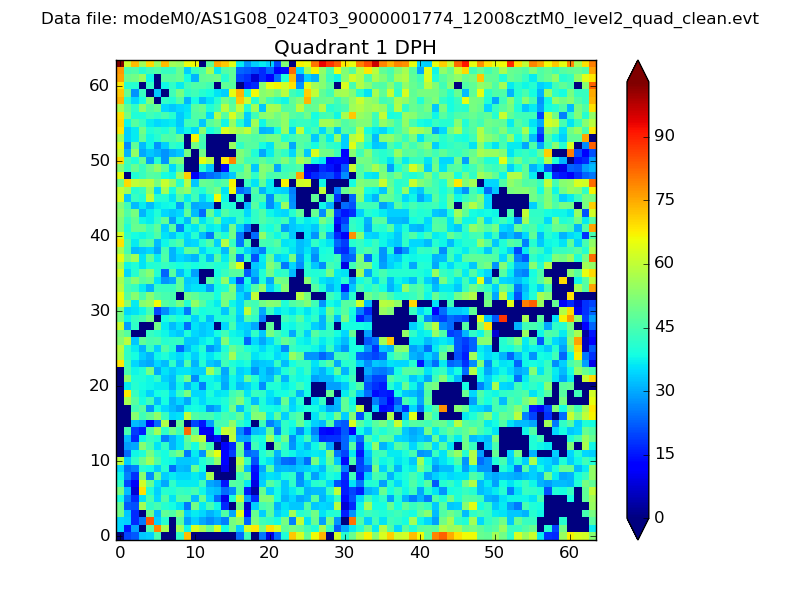 |
Quadrant B |
|---|---|---|---|
| Quadrant D | 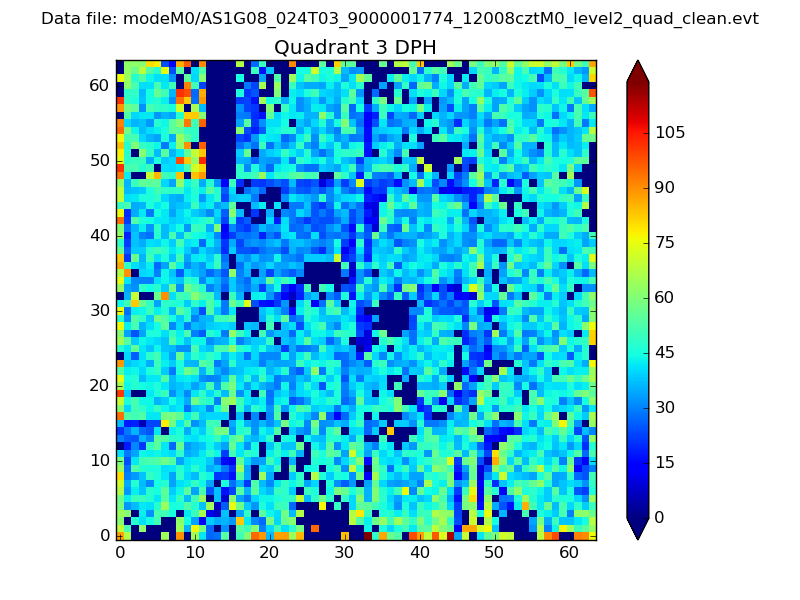 |
 |
Quadrant C |
| Plot type | Count rate plots | Images |
|---|---|---|
| Comparison with Poisson distribution Blue bars denote a histogram of data divided into 1 sec bins. Red curve is a Poisson curve with rate = median count rate of data. |
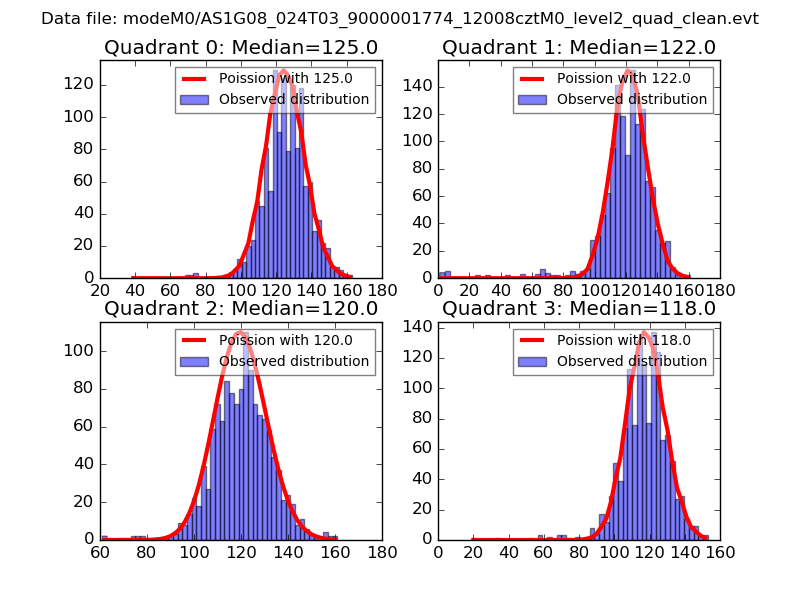 |
 |
| Quadrant-wise count rates Data is divided into 100 sec bins |
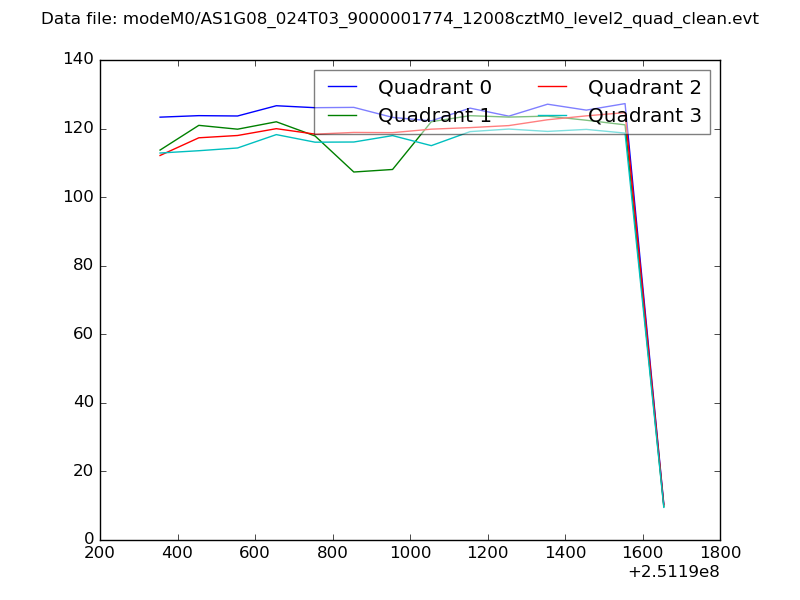 |
|
| Module-wise count rates for Quadrant A Data is divided into 100 sec bins |
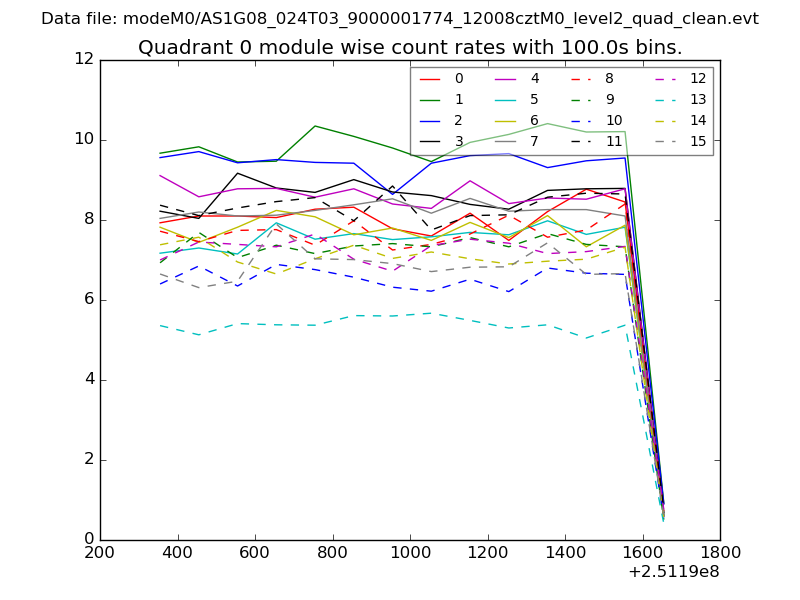 |
 |
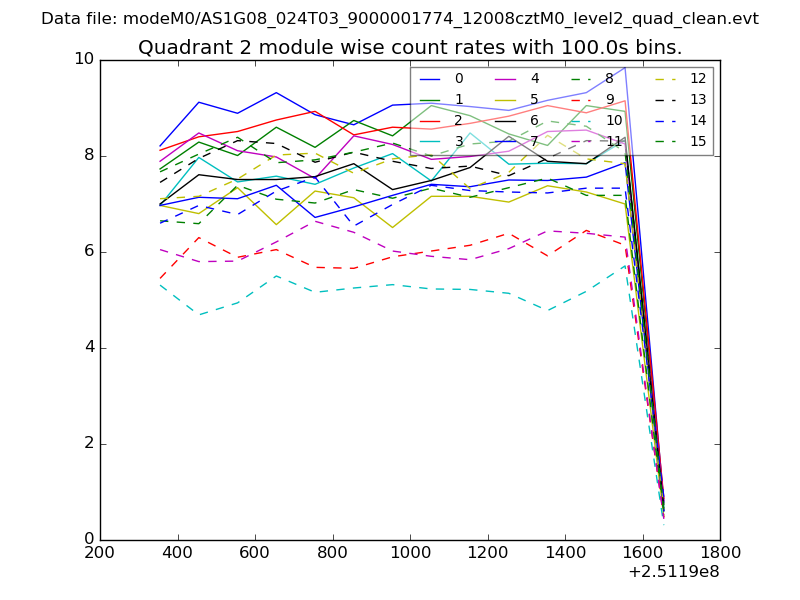
| Module-wise count rates for Quadrant B Data is divided into 100 sec bins |
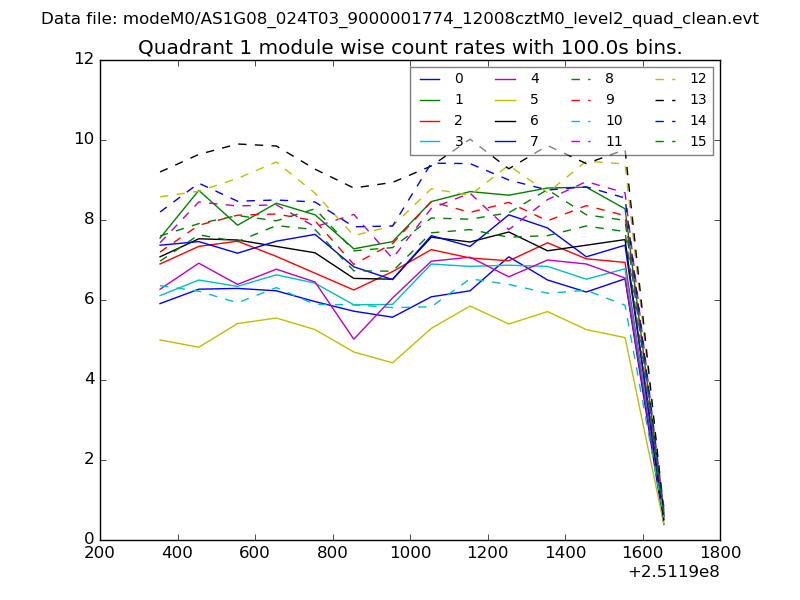 |
 |
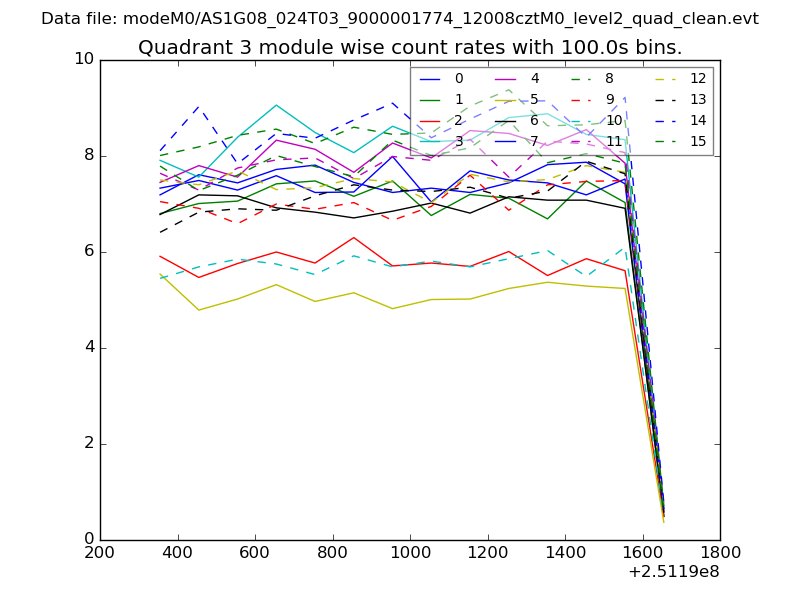
| Module-wise count rates for Quadrant C Data is divided into 100 sec bins |
 |
 |
| Module-wise count rates for Quadrant D Data is divided into 100 sec bins |
 |
 |
| Parameter | Plot |
|---|---|
| CZT HV Monitor | 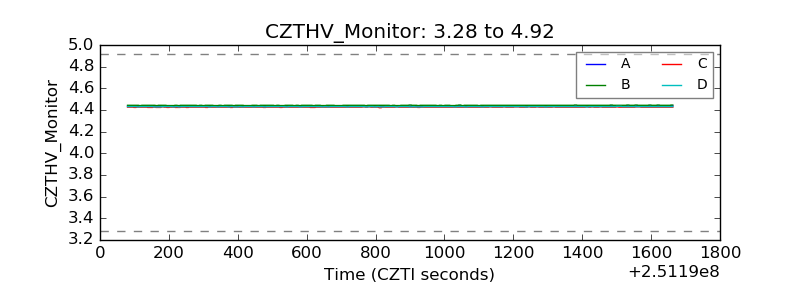 |
| D_VDD | 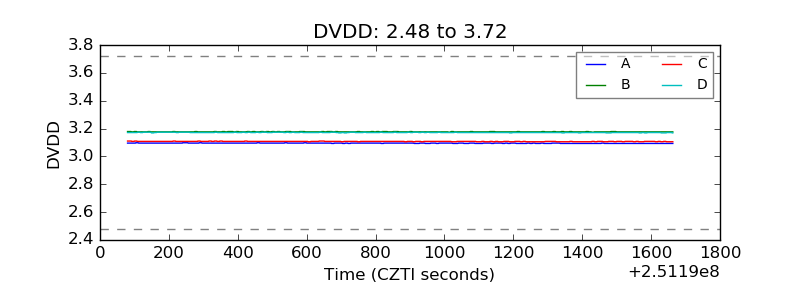 |
| Temperature 1 | 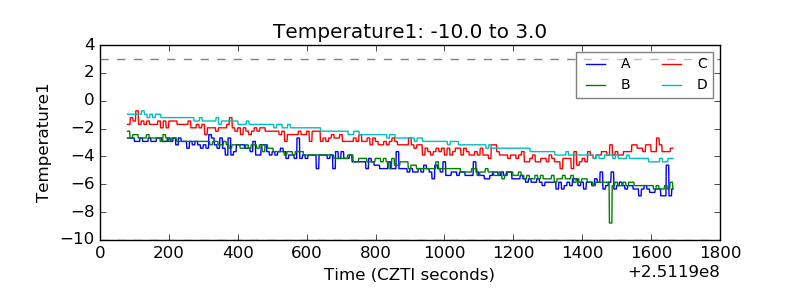 |
| Veto HV Monitor | 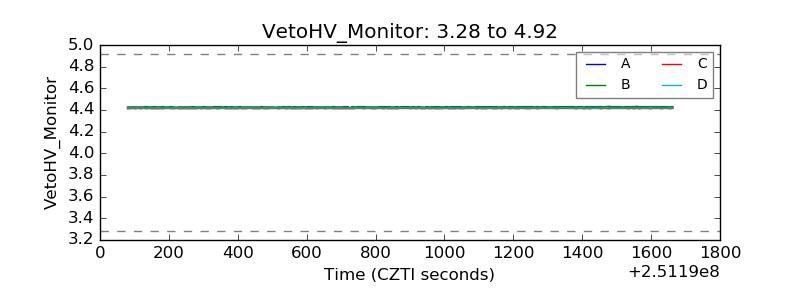 |
| Veto LLD | 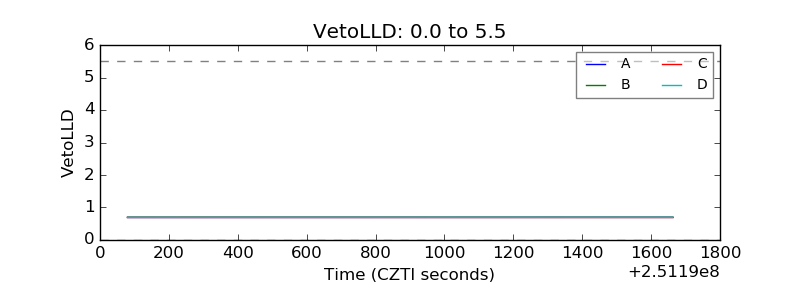 |
| Alpha Counter | 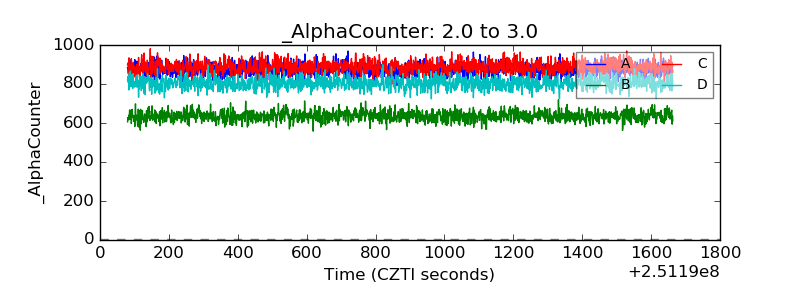 |
| _CPM_Rate | 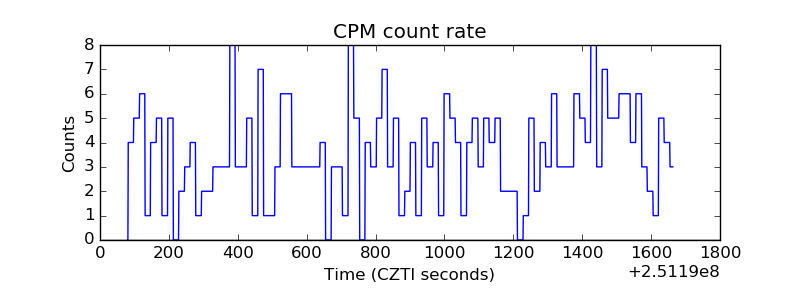 |
| CZT Counter | 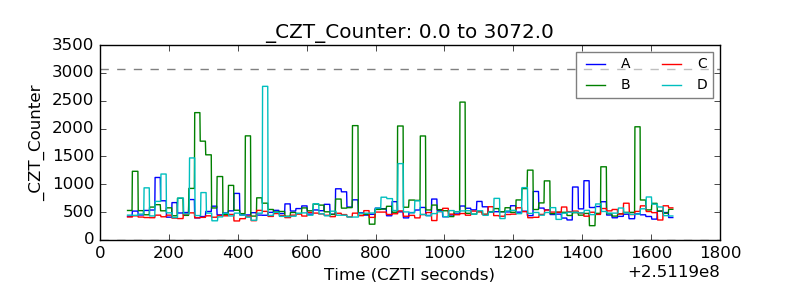 |
| +2.5 Volts monitor |  |
| +5 Volts monitor |  |
| _ROLL_ROT | 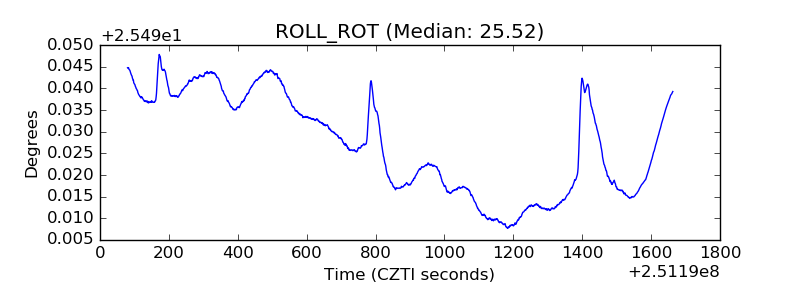 |
| _Roll_DEC | 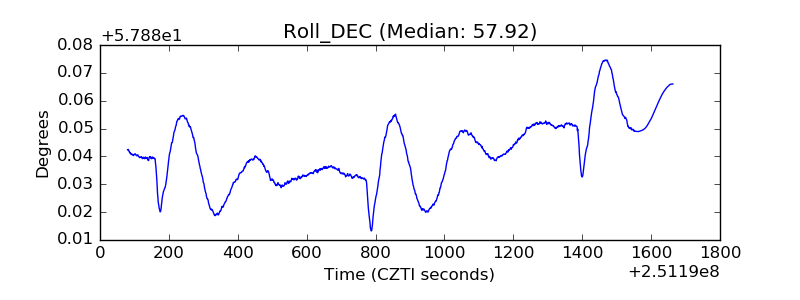 |
| _Roll_RA |  |
| Veto Counter | 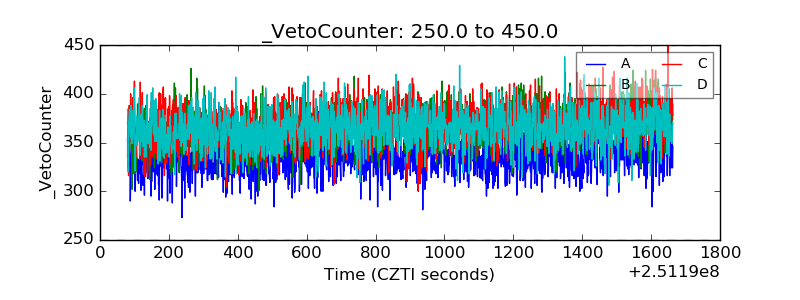 |