| Param | Original file | Final file |
|---|---|---|
| Filename | modeM0/AS1A04_112T01_9000001778cztM0_level2.fits | modeM0/AS1A04_112T01_9000001778cztM0_level2_quad_clean.evt |
| Size (bytes) | 495,489,600 | 675,887,040 |
| Size | 472.5 MB | 644.6 MB |
| Events in quadrant A | 2,979,234 | 4,442,515 |
| Events in quadrant B | 2,754,156 | 4,158,528 |
| Events in quadrant C | 2,986,658 | 4,294,308 |
| Events in quadrant D | 2,500,108 | 3,794,386 |
| Mode M0 | |||
|---|---|---|---|
| Quadrant | BADHDUFLAG | Total packets | Discarded packets |
| A | 0 | 121956 | 0 |
| B | 0 | 176868 | 0 |
| C | 0 | 112430 | 0 |
| D | 0 | 146941 | 0 |
| Mode SS | |||
|---|---|---|---|
| Quadrant | BADHDUFLAG | Total packets | Discarded packets |
| A | 0 | 1122 | 0 |
| B | 0 | 1122 | 0 |
| C | 0 | 1122 | 0 |
| D | 0 | 1122 | 0 |
| Mode M9 | |||
|---|---|---|---|
| Quadrant | BADHDUFLAG | Total packets | Discarded packets |
| A | 0 | 72 | 0 |
| B | 0 | 72 | 0 |
| C | 0 | 72 | 0 |
| D | 0 | 72 | 0 |
| Quadrant | Total seconds | Saturated seconds | Saturation percentage |
|---|---|---|---|
| A | 55122 | 1166 | 2.115308% |
| B | 55122 | 5720 | 10.376982% |
| C | 55122 | 469 | 0.850840% |
| D | 55122 | 3038 | 5.511411% |
Noise dominated data is calculated using 1-second bins in cleaned event files. If a bin has >2000 counts, and if more than 50% of those come from <1% of pixels, then it is considered to be noise-dominated and hence unusable.
| Quadrant | # 1 sec bins | Bins with >0 counts | Bins with >2000 counts | High rate bins dominated by noise | Noise dominated (total time) | Noise dominated (detector-on time) | Marked lightcurve |
|---|---|---|---|---|---|---|---|
| A | 62317 | 55106 | 0 | 0 | 0.00% | 0.00% |  |
| B | 62317 | 55028 | 0 | 0 | 0.00% | 0.00% |  |
| C | 62317 | 55115 | 0 | 0 | 0.00% | 0.00% |  |
| D | 62317 | 55049 | 0 | 0 | 0.00% | 0.00% |  |
Top three noisy pixels from each quadrant. If the there are fewer than three noisy pixels in the level2.evt file, extra rows are filled as -1
| Pixel properties | Quadrant properties | ||||||
|---|---|---|---|---|---|---|---|
| Quadrant | DetID | PixID | Counts | Sigma | Mean | Median | Sigma |
| A | 0 | 29 | 2963 | 11.28 | 776 | 727 | 198.3 |
| A | 7 | 110 | 2510 | 8.99 | 776 | 727 | 198.3 |
| A | 9 | 19 | 2289 | 7.88 | 776 | 727 | 198.3 |
| B | 2 | 9 | 2550 | 12.86 | 728 | 695 | 144.2 |
| B | 2 | 8 | 1889 | 8.28 | 728 | 695 | 144.2 |
| B | 3 | 17 | 1861 | 8.09 | 728 | 695 | 144.2 |
| C | 12 | 241 | 2135 | 6.92 | 787 | 731 | 203.0 |
| C | 2 | 191 | 2052 | 6.51 | 787 | 731 | 203.0 |
| C | 3 | 158 | 2036 | 6.43 | 787 | 731 | 203.0 |
| D | 3 | 14 | 1920 | 6.73 | 711 | 646 | 189.2 |
| D | 6 | 231 | 1808 | 6.14 | 711 | 646 | 189.2 |
| D | 7 | 3 | 1777 | 5.98 | 711 | 646 | 189.2 |
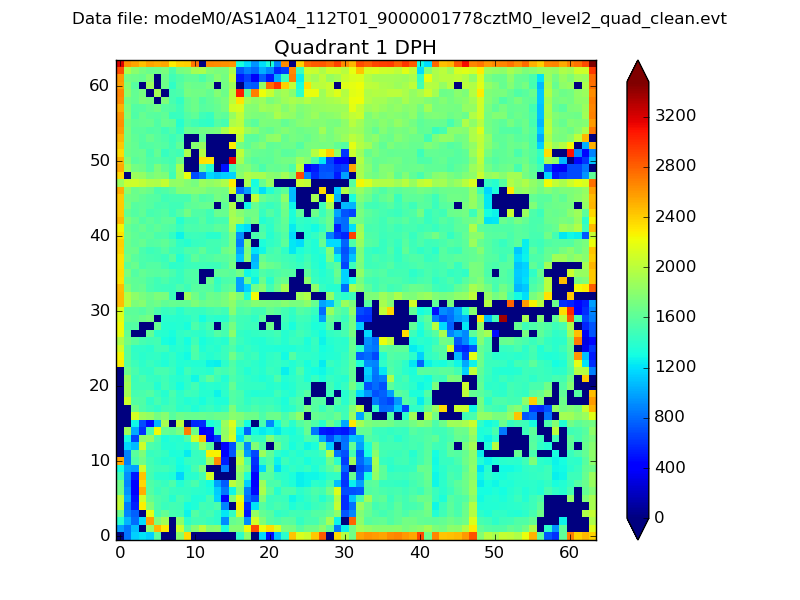
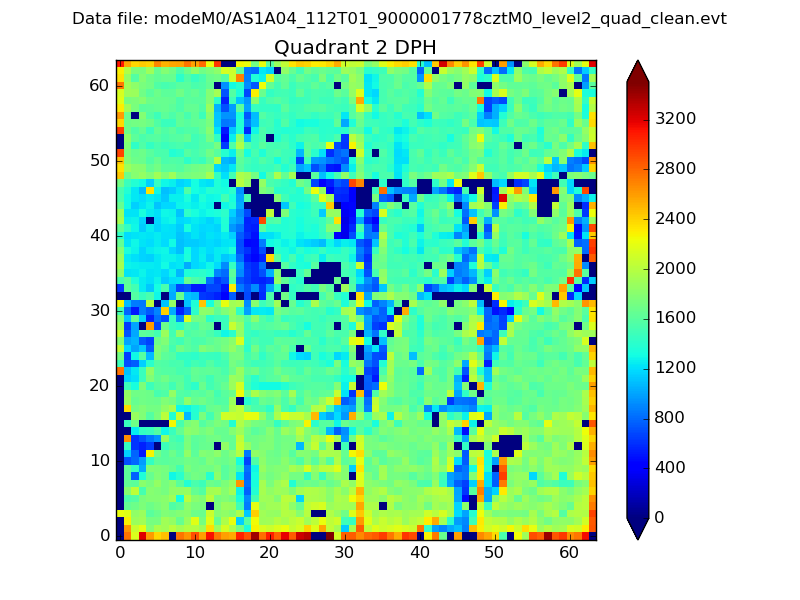
Histogram calculated using DETX and DETY for each event in the final _common_clean file
| Quadrant A |  |
 |
Quadrant B |
|---|---|---|---|
| Quadrant D |  |
 |
Quadrant C |
| Plot type | Count rate plots | Images |
|---|---|---|
| Comparison with Poisson distribution Blue bars denote a histogram of data divided into 1 sec bins. Red curve is a Poisson curve with rate = median count rate of data. |
 |
 |
| Quadrant-wise count rates Data is divided into 100 sec bins |
 |
|
| Module-wise count rates for Quadrant A Data is divided into 100 sec bins |
 |
 |
| Module-wise count rates for Quadrant B Data is divided into 100 sec bins |
 |
 |
| Module-wise count rates for Quadrant C Data is divided into 100 sec bins |
 |
 |
| Module-wise count rates for Quadrant D Data is divided into 100 sec bins |
 |
 |
| Parameter | Plot |
|---|---|
| CZT HV Monitor |  |
| D_VDD |  |
| Temperature 1 | 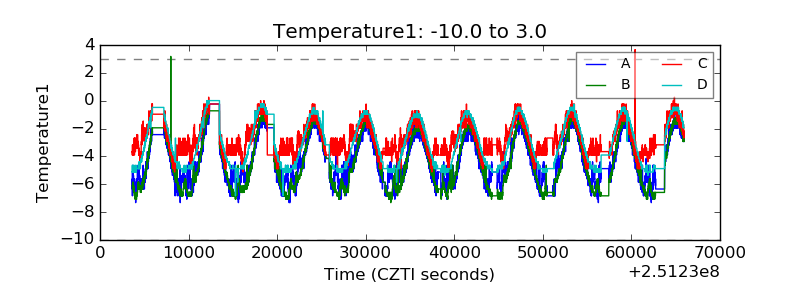 |
| Veto HV Monitor |  |
| Veto LLD | 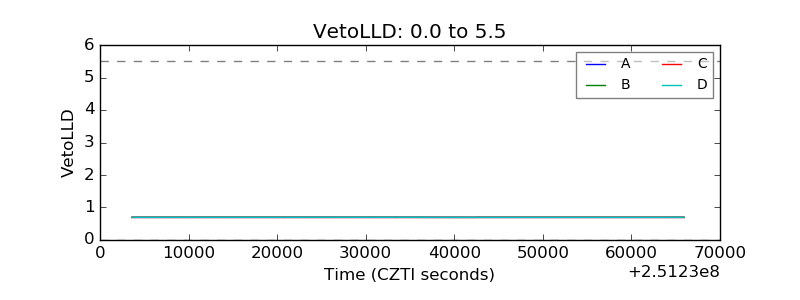 |
| Alpha Counter |  |
| _CPM_Rate | 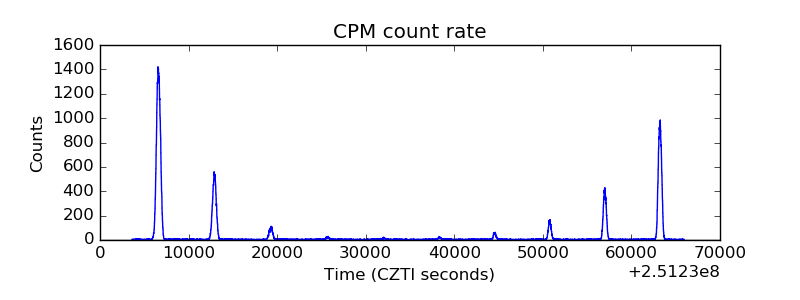 |
| CZT Counter |  |
| +2.5 Volts monitor |  |
| +5 Volts monitor |  |
| _ROLL_ROT |  |
| _Roll_DEC |  |
| _Roll_RA |  |
| Veto Counter |  |