| Param | Original file | Final file |
|---|---|---|
| Filename | modeM0/AS1A04_112T01_9000001778_12014cztM0_level2.evt | modeM0/AS1A04_112T01_9000001778_12014cztM0_level2_quad_clean.evt |
| Size (bytes) | 350,467,200 | 62,818,560 |
| Size | 334.2 MB | 59.9 MB |
| Events in quadrant A | 1,904,751 | 425,361 |
| Events in quadrant B | 3,721,726 | 401,394 |
| Events in quadrant C | 1,717,717 | 432,477 |
| Events in quadrant D | 3,021,283 | 384,769 |
| Mode M0 | |||
|---|---|---|---|
| Quadrant | BADHDUFLAG | Total packets | Discarded packets |
| A | 0 | 8090 | 2 |
| B | 0 | 13484 | 1 |
| C | 0 | 7554 | 1 |
| D | 0 | 11396 | 1 |
| Mode SS | |||
|---|---|---|---|
| Quadrant | BADHDUFLAG | Total packets | Discarded packets |
| A | 0 | 74 | 0 |
| B | 0 | 74 | 0 |
| C | 0 | 74 | 0 |
| D | 0 | 74 | 0 |
| Mode M9 | |||
|---|---|---|---|
| Quadrant | BADHDUFLAG | Total packets | Discarded packets |
| A | 0 | 13 | 0 |
| B | 0 | 13 | 0 |
| C | 0 | 13 | 0 |
| D | 0 | 13 | 0 |
| Quadrant | Total seconds | Saturated seconds | Saturation percentage |
|---|---|---|---|
| A | 3644 | 62 | 1.701427% |
| B | 3644 | 792 | 21.734358% |
| C | 3644 | 15 | 0.411636% |
| D | 3644 | 398 | 10.922064% |
Noise dominated data is calculated using 1-second bins in cleaned event files. If a bin has >2000 counts, and if more than 50% of those come from <1% of pixels, then it is considered to be noise-dominated and hence unusable.
| Quadrant | # 1 sec bins | Bins with >0 counts | Bins with >2000 counts | High rate bins dominated by noise | Noise dominated (total time) | Noise dominated (detector-on time) | Marked lightcurve |
|---|---|---|---|---|---|---|---|
| A | 4930 | 3645 | 22 | 22 | 0.45% | 0.60% | 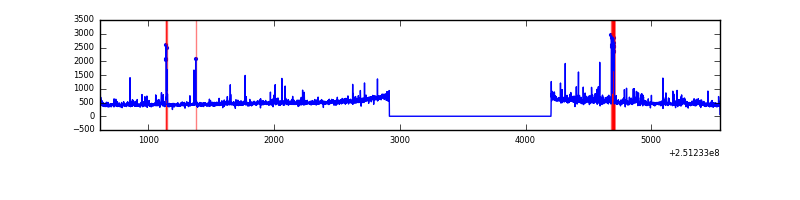 |
| B | 4930 | 3645 | 596 | 596 | 12.09% | 16.35% |  |
| C | 4930 | 3646 | 1 | 1 | 0.02% | 0.03% | 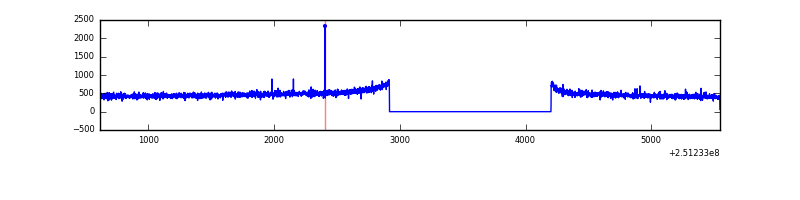 |
| D | 4930 | 3646 | 357 | 357 | 7.24% | 9.79% |  |
Top three noisy pixels from each quadrant. If the there are fewer than three noisy pixels in the level2.evt file, extra rows are filled as -1
| Pixel properties | Quadrant properties | ||||||
|---|---|---|---|---|---|---|---|
| Quadrant | DetID | PixID | Counts | Sigma | Mean | Median | Sigma |
| A | 13 | 248 | 58488 | 644.45 | 442 | 433 | 90.1 |
| A | 1 | 162 | 57271 | 630.94 | 442 | 433 | 90.1 |
| A | 1 | 178 | 27947 | 305.43 | 442 | 433 | 90.1 |
| B | 4 | 206 | 1678461 | 20768.61 | 424 | 413 | 80.8 |
| B | 3 | 64 | 215797 | 2665.73 | 424 | 413 | 80.8 |
| B | 4 | 239 | 89619 | 1104.07 | 424 | 413 | 80.8 |
| C | 14 | 234 | 3635 | 31.5 | 439 | 441 | 101.4 |
| C | 13 | 61 | 3338 | 28.57 | 439 | 441 | 101.4 |
| C | 0 | 207 | 1601 | 11.44 | 439 | 441 | 101.4 |
| D | 1 | 52 | 1111520 | 11170.87 | 412 | 401 | 99.5 |
| D | 13 | 122 | 80833 | 808.64 | 412 | 401 | 99.5 |
| D | 8 | 195 | 71214 | 711.93 | 412 | 401 | 99.5 |
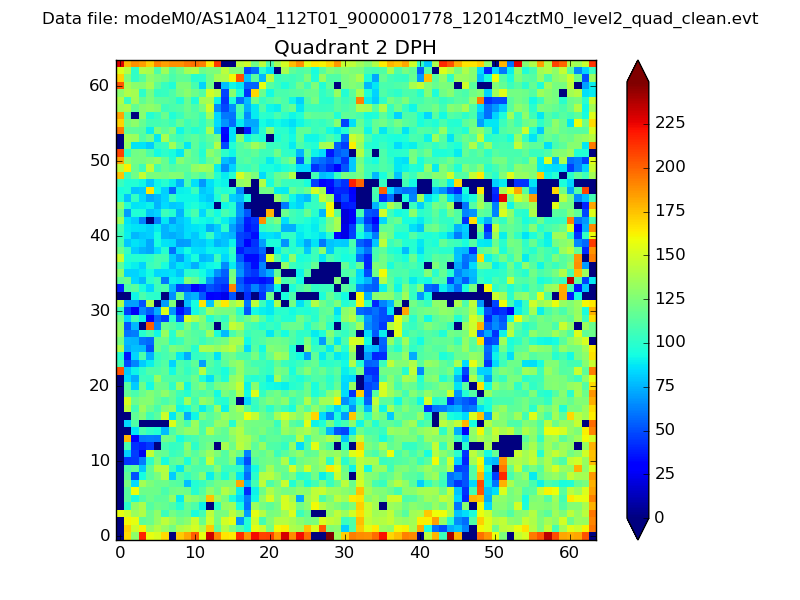
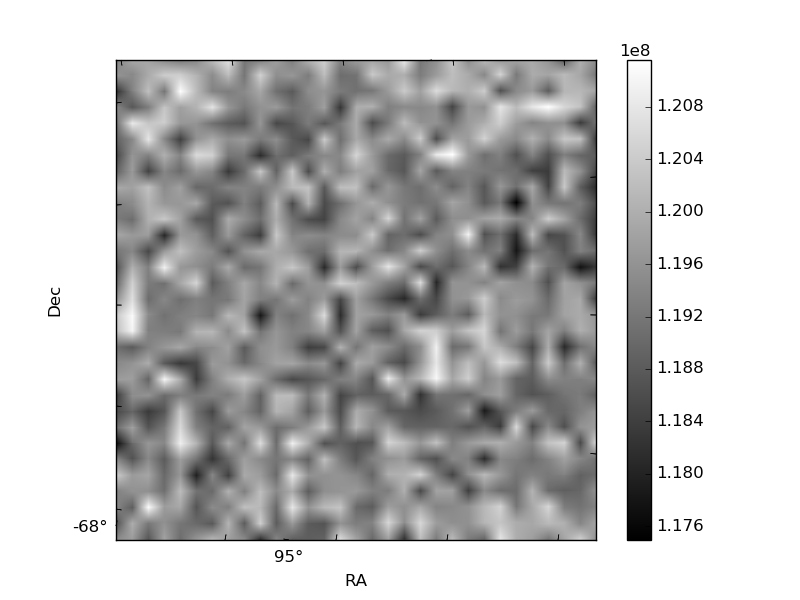
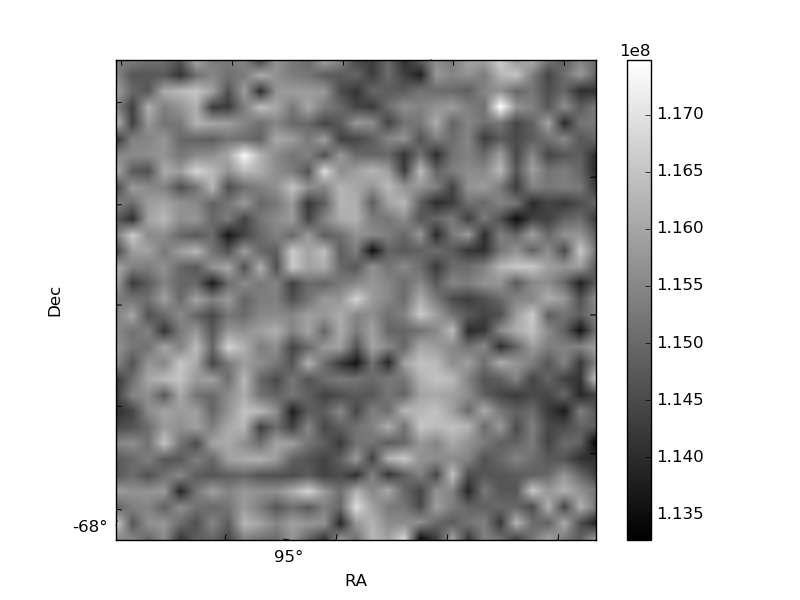
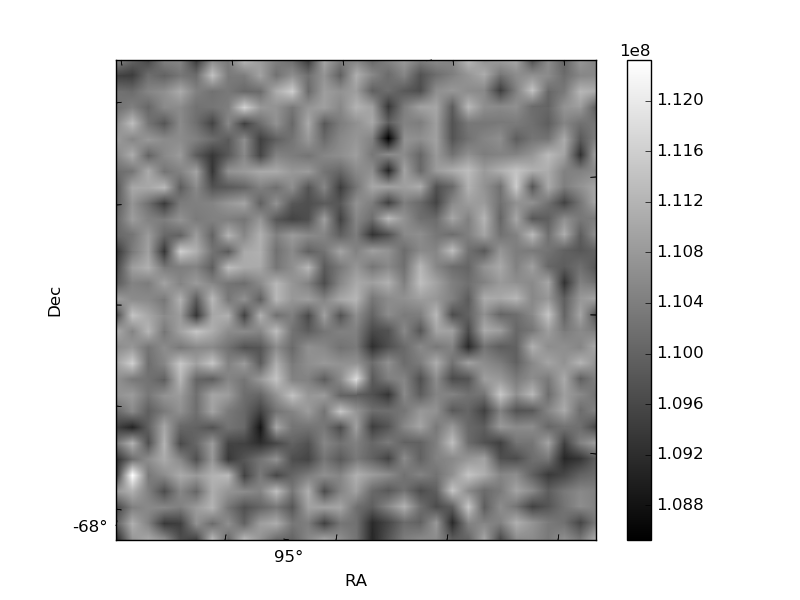
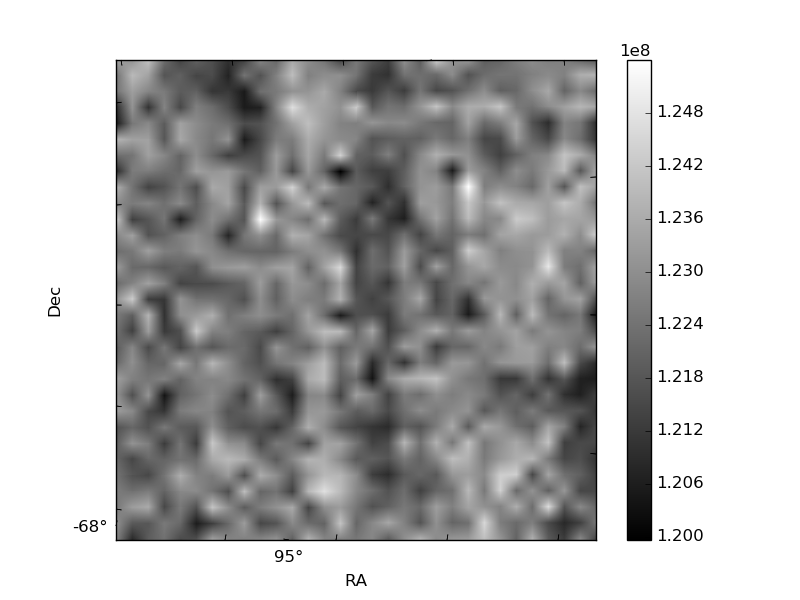
Histogram calculated using DETX and DETY for each event in the final _common_clean file
| Quadrant A | 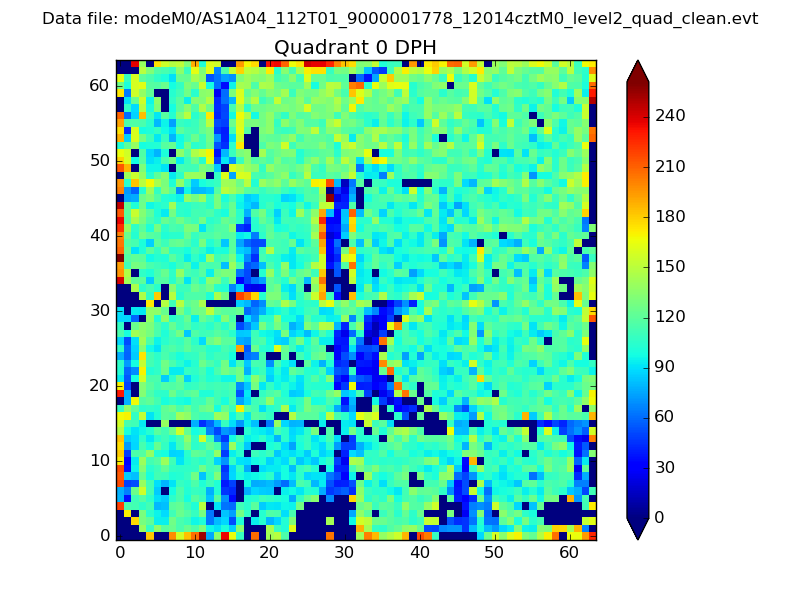 |
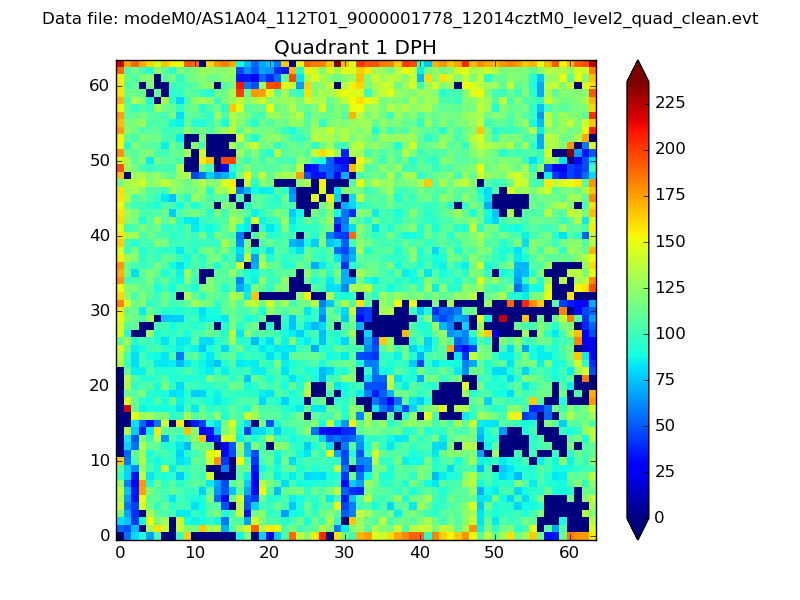 |
Quadrant B |
|---|---|---|---|
| Quadrant D | 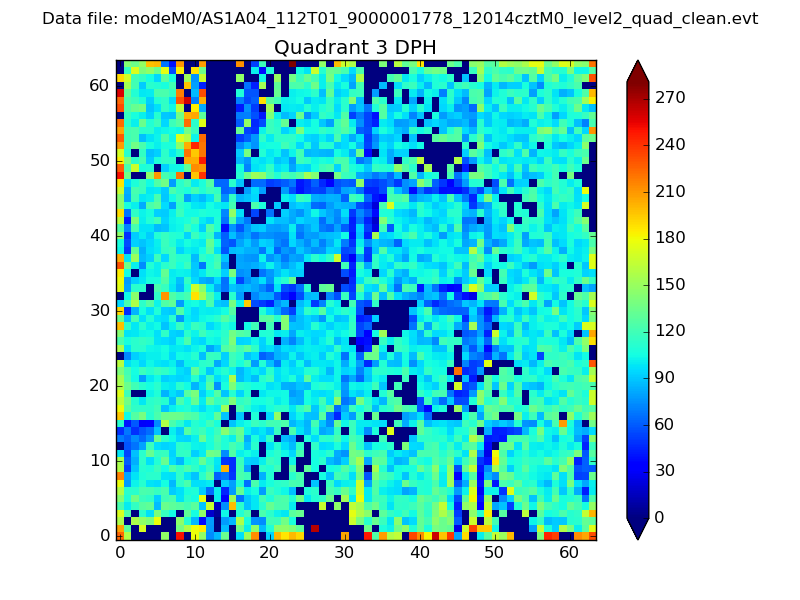 |
 |
Quadrant C |
| Plot type | Count rate plots | Images |
|---|---|---|
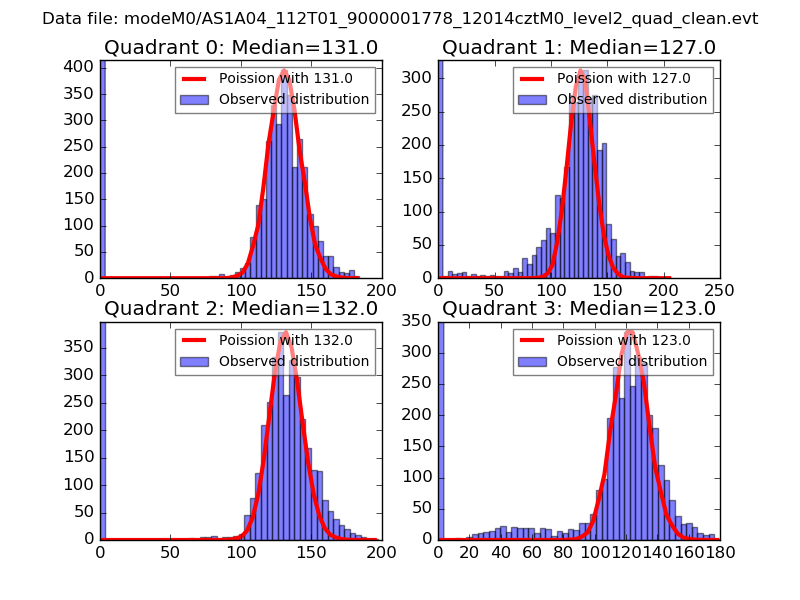
| Comparison with Poisson distribution Blue bars denote a histogram of data divided into 1 sec bins. Red curve is a Poisson curve with rate = median count rate of data. |
 |
 |
| Quadrant-wise count rates Data is divided into 100 sec bins |
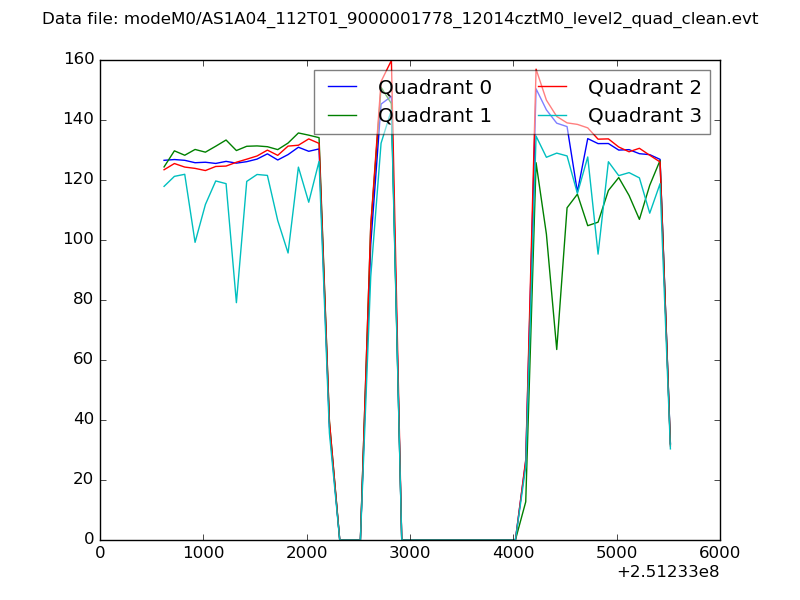 |
|
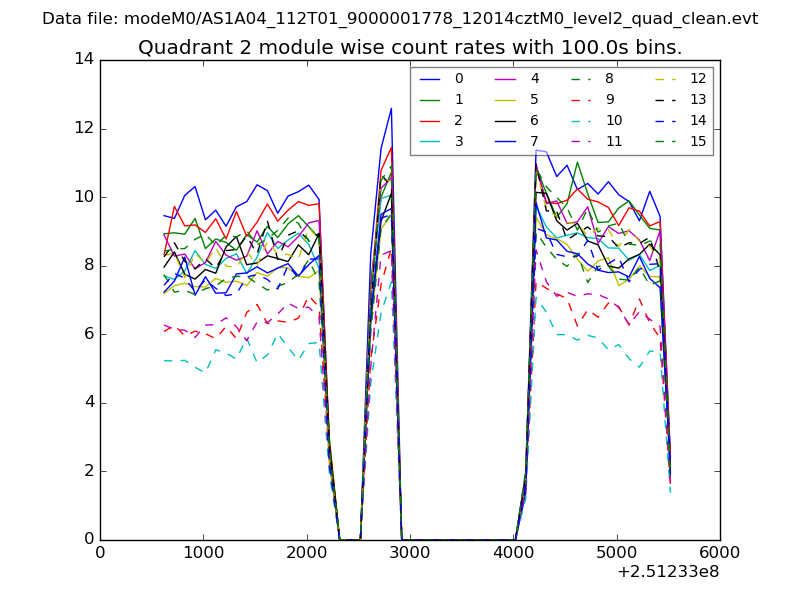
| Module-wise count rates for Quadrant A Data is divided into 100 sec bins |
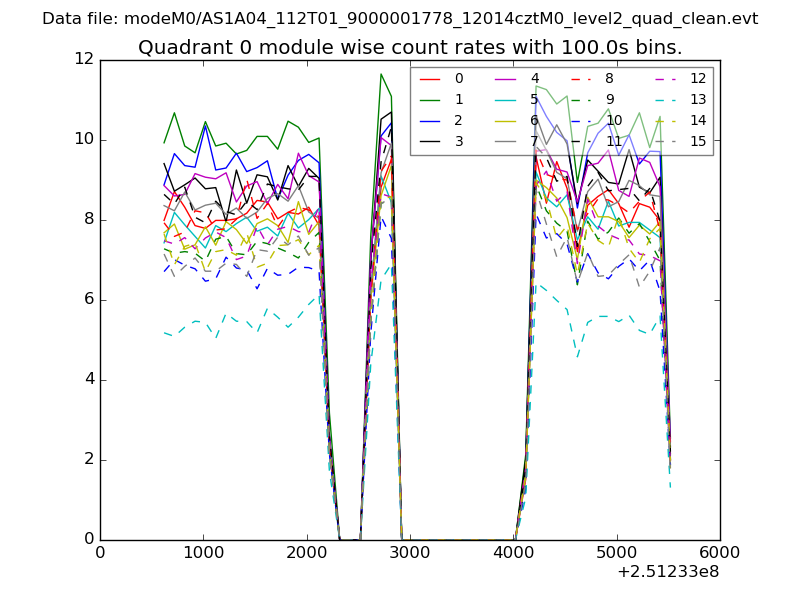 |
 |
| Module-wise count rates for Quadrant B Data is divided into 100 sec bins |
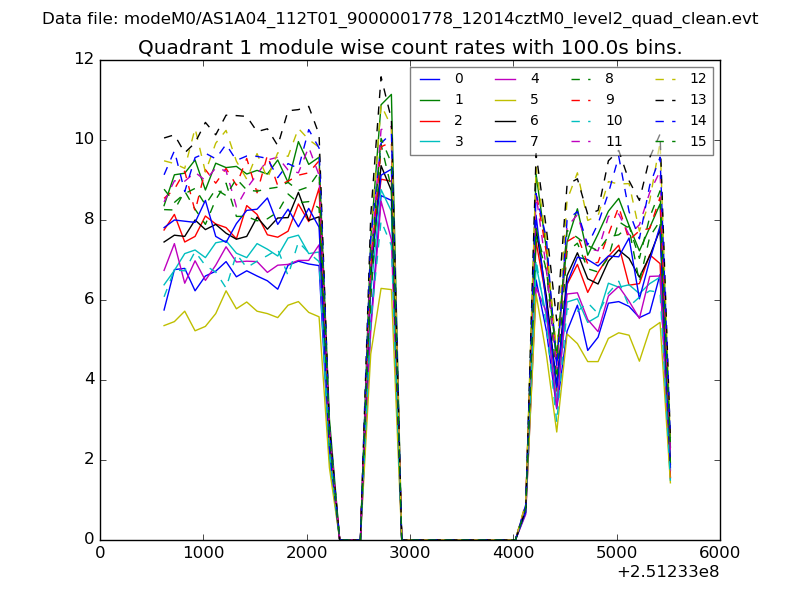 |
 |
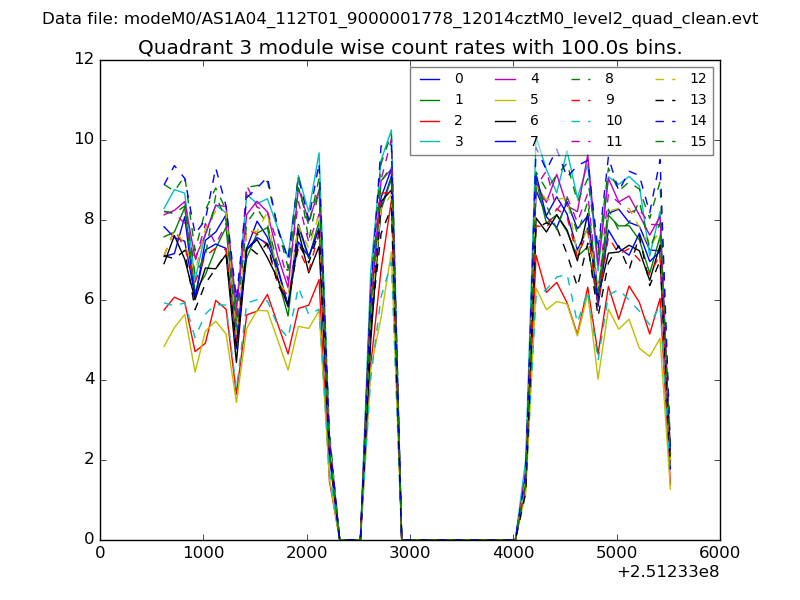
| Module-wise count rates for Quadrant C Data is divided into 100 sec bins |
 |
 |
| Module-wise count rates for Quadrant D Data is divided into 100 sec bins |
 |
 |
| Parameter | Plot |
|---|---|
| CZT HV Monitor | 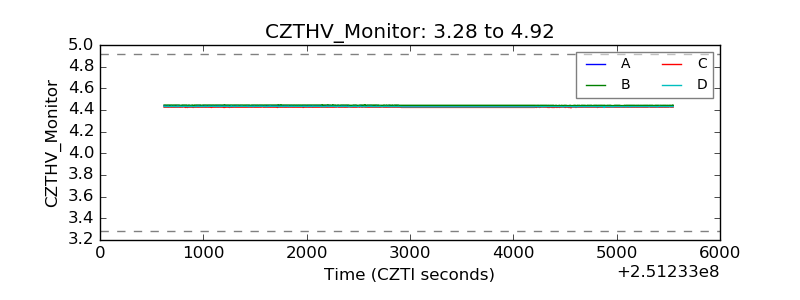 |
| D_VDD | 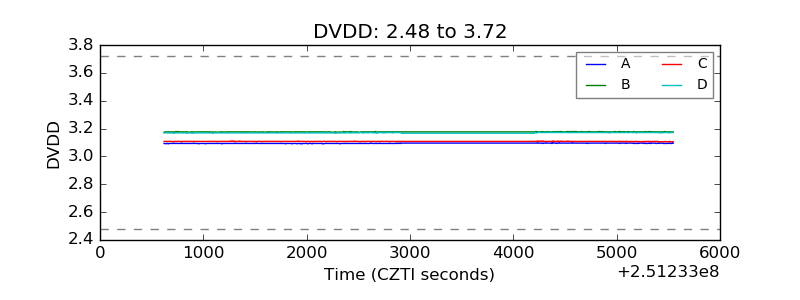 |
| Temperature 1 | 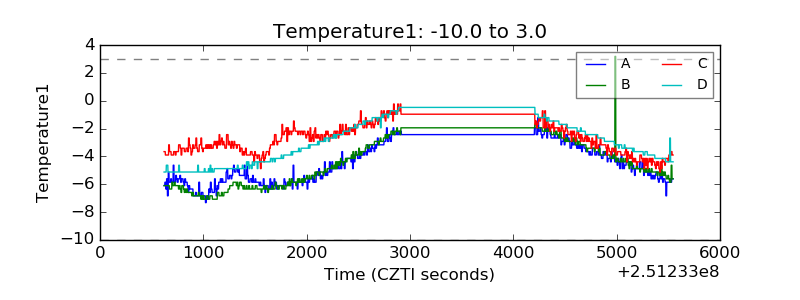 |
| Veto HV Monitor | 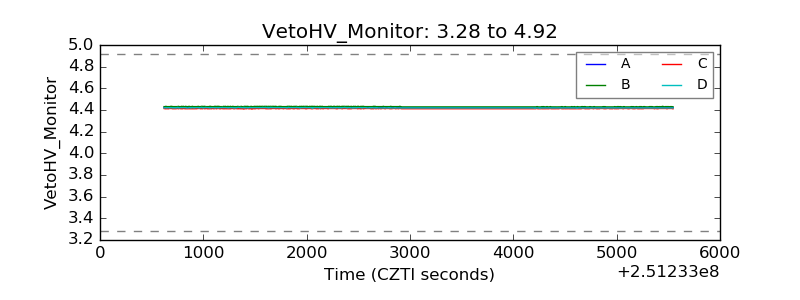 |
| Veto LLD | 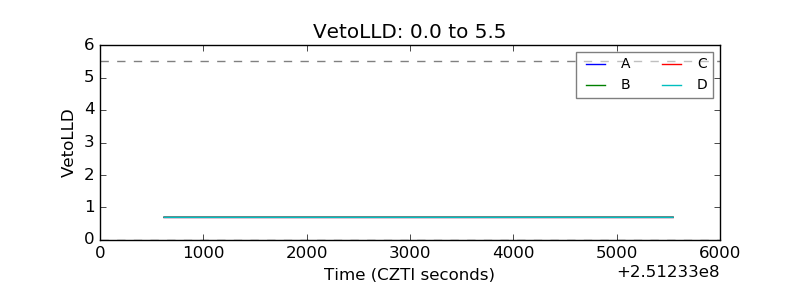 |
| Alpha Counter | 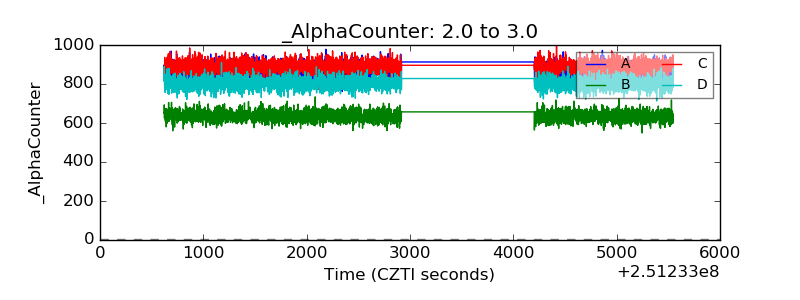 |
| _CPM_Rate |  |
| CZT Counter | 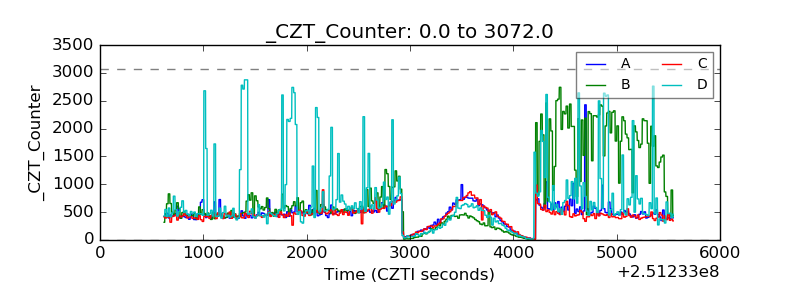 |
| +2.5 Volts monitor |  |
| +5 Volts monitor |  |
| _ROLL_ROT | 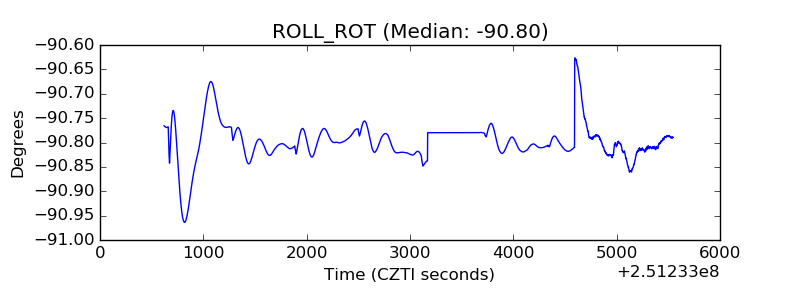 |
| _Roll_DEC | 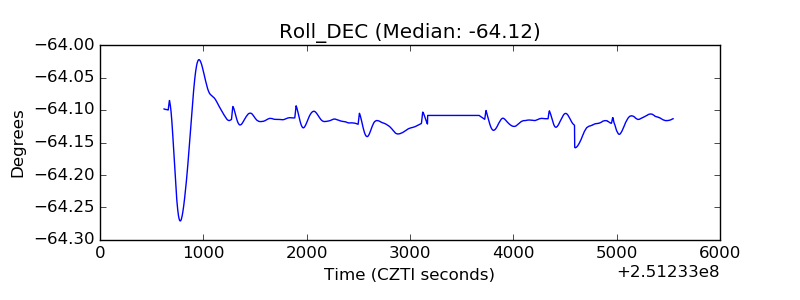 |
| _Roll_RA | 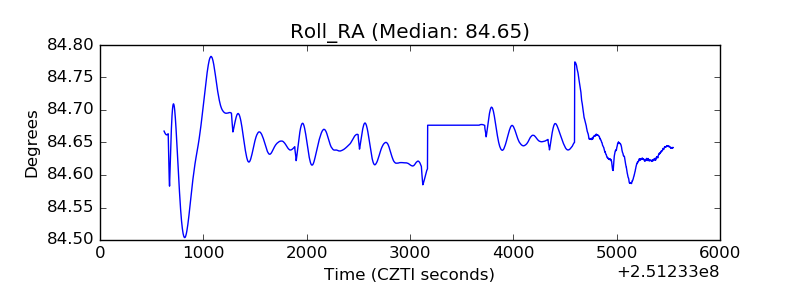 |
| Veto Counter | 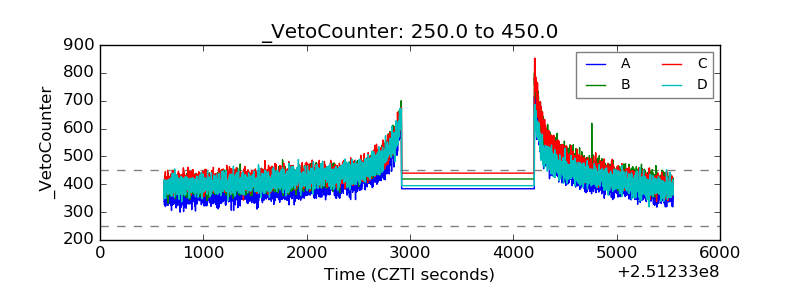 |