| Param | Original file | Final file |
|---|---|---|
| Filename | modeM0/AS1A04_112T01_9000001778_12017cztM0_level2.evt | modeM0/AS1A04_112T01_9000001778_12017cztM0_level2_quad_clean.evt |
| Size (bytes) | 1,000,825,920 | 219,173,760 |
| Size | 954.5 MB | 209.0 MB |
| Events in quadrant A | 6,548,124 | 1,467,888 |
| Events in quadrant B | 9,919,444 | 1,431,295 |
| Events in quadrant C | 5,597,364 | 1,463,751 |
| Events in quadrant D | 7,376,008 | 1,386,858 |
| Mode M0 | |||
|---|---|---|---|
| Quadrant | BADHDUFLAG | Total packets | Discarded packets |
| A | 0 | 28369 | 4 |
| B | 0 | 38360 | 3 |
| C | 0 | 26077 | 3 |
| D | 0 | 30840 | 3 |
| Mode SS | |||
|---|---|---|---|
| Quadrant | BADHDUFLAG | Total packets | Discarded packets |
| A | 0 | 262 | 0 |
| B | 0 | 262 | 0 |
| C | 0 | 262 | 0 |
| D | 0 | 262 | 0 |
| Mode M9 | |||
|---|---|---|---|
| Quadrant | BADHDUFLAG | Total packets | Discarded packets |
| A | 0 | 18 | 0 |
| B | 0 | 18 | 0 |
| C | 0 | 18 | 0 |
| D | 0 | 19 | 0 |
| Quadrant | Total seconds | Saturated seconds | Saturation percentage |
|---|---|---|---|
| A | 12850 | 174 | 1.354086% |
| B | 12850 | 1192 | 9.276265% |
| C | 12850 | 45 | 0.350195% |
| D | 12850 | 345 | 2.684825% |
Noise dominated data is calculated using 1-second bins in cleaned event files. If a bin has >2000 counts, and if more than 50% of those come from <1% of pixels, then it is considered to be noise-dominated and hence unusable.
| Quadrant | # 1 sec bins | Bins with >0 counts | Bins with >2000 counts | High rate bins dominated by noise | Noise dominated (total time) | Noise dominated (detector-on time) | Marked lightcurve |
|---|---|---|---|---|---|---|---|
| A | 14021 | 12853 | 46 | 46 | 0.33% | 0.36% | 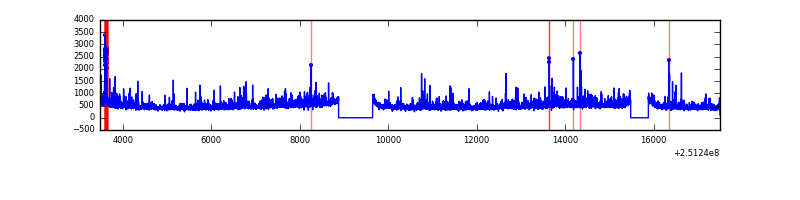 |
| B | 14021 | 12852 | 587 | 587 | 4.19% | 4.57% | 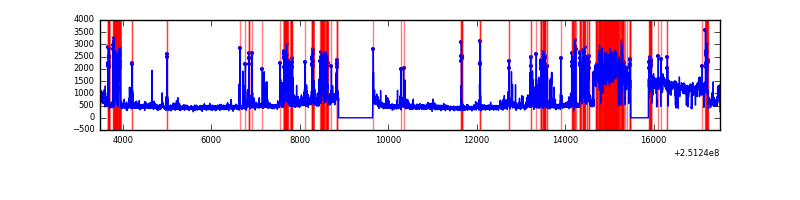 |
| C | 14021 | 12853 | 2 | 2 | 0.01% | 0.02% | 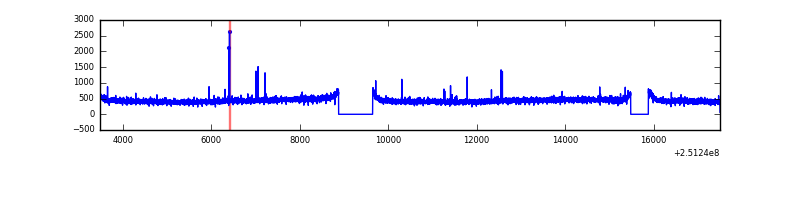 |
| D | 14021 | 12852 | 287 | 287 | 2.05% | 2.23% | 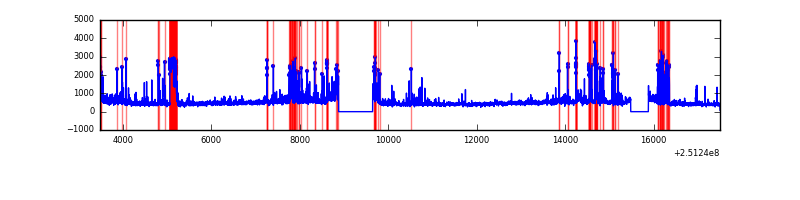 |
Top three noisy pixels from each quadrant. If the there are fewer than three noisy pixels in the level2.evt file, extra rows are filled as -1
| Pixel properties | Quadrant properties | ||||||
|---|---|---|---|---|---|---|---|
| Quadrant | DetID | PixID | Counts | Sigma | Mean | Median | Sigma |
| A | 1 | 162 | 297875 | 1003.08 | 1457 | 1425 | 295.5 |
| A | 1 | 178 | 163423 | 548.14 | 1457 | 1425 | 295.5 |
| A | 13 | 248 | 162017 | 543.39 | 1457 | 1425 | 295.5 |
| B | 4 | 206 | 1997281 | 7465.36 | 1430 | 1393 | 267.4 |
| B | 4 | 239 | 1203192 | 4495.17 | 1430 | 1393 | 267.4 |
| B | 3 | 64 | 620239 | 2314.71 | 1430 | 1393 | 267.4 |
| C | 14 | 234 | 24370 | 69.87 | 1428 | 1430 | 328.3 |
| C | 13 | 61 | 10480 | 27.56 | 1428 | 1430 | 328.3 |
| C | 12 | 4 | 5743 | 13.14 | 1428 | 1430 | 328.3 |
| D | 7 | 80 | 795097 | 2369.75 | 1401 | 1359 | 334.9 |
| D | 8 | 195 | 426775 | 1270.1 | 1401 | 1359 | 334.9 |
| D | 1 | 52 | 216672 | 642.83 | 1401 | 1359 | 334.9 |
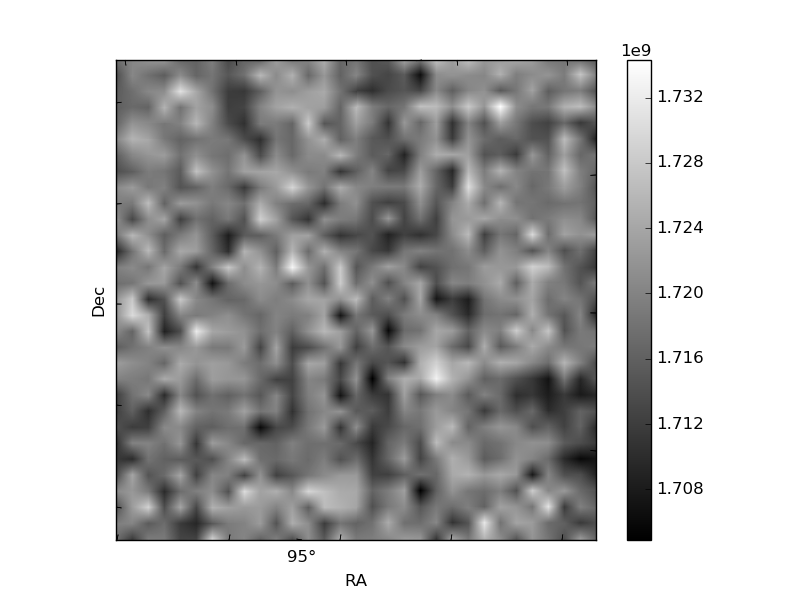
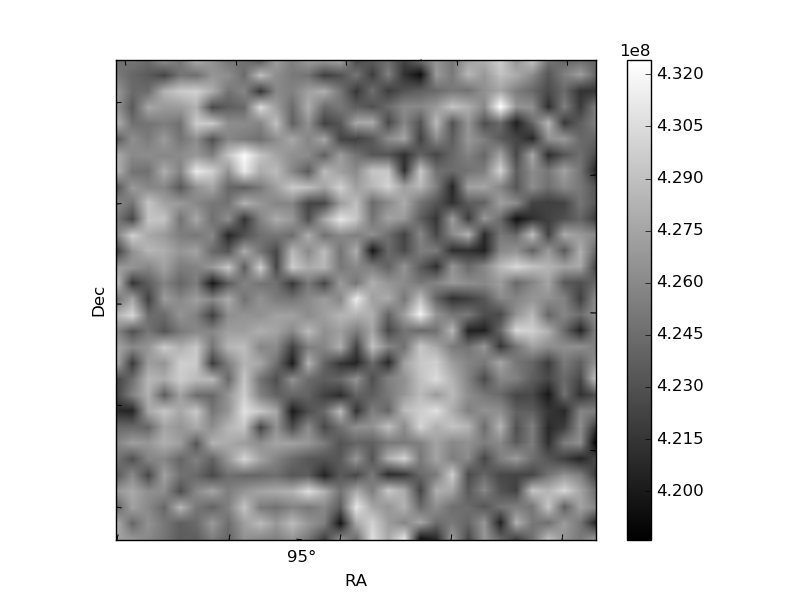
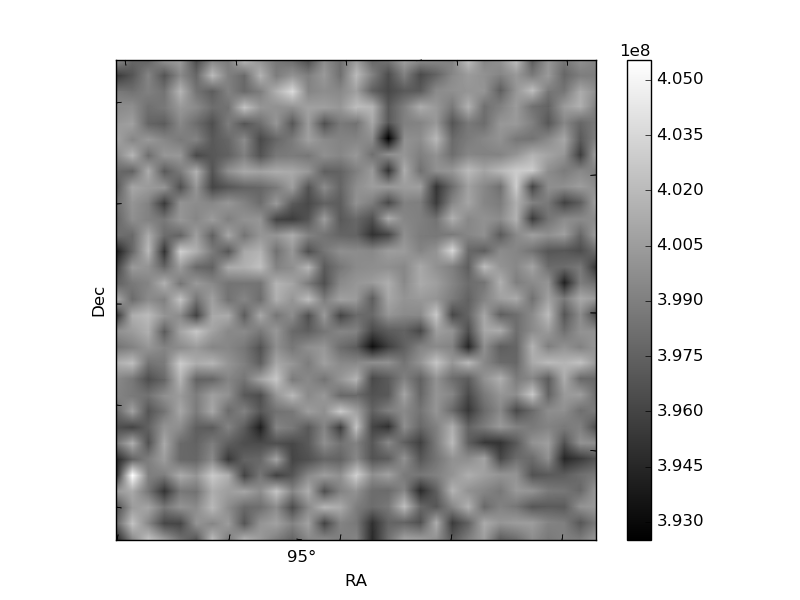
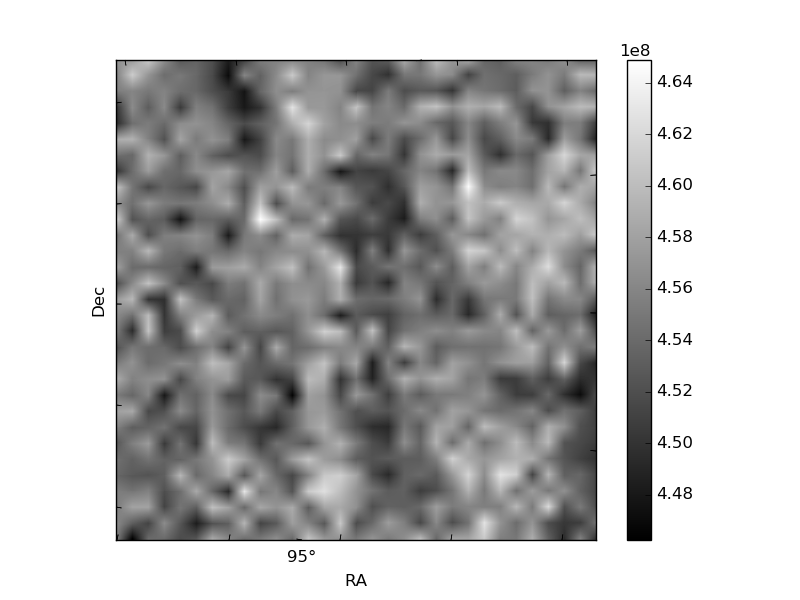
Histogram calculated using DETX and DETY for each event in the final _common_clean file
| Quadrant A | 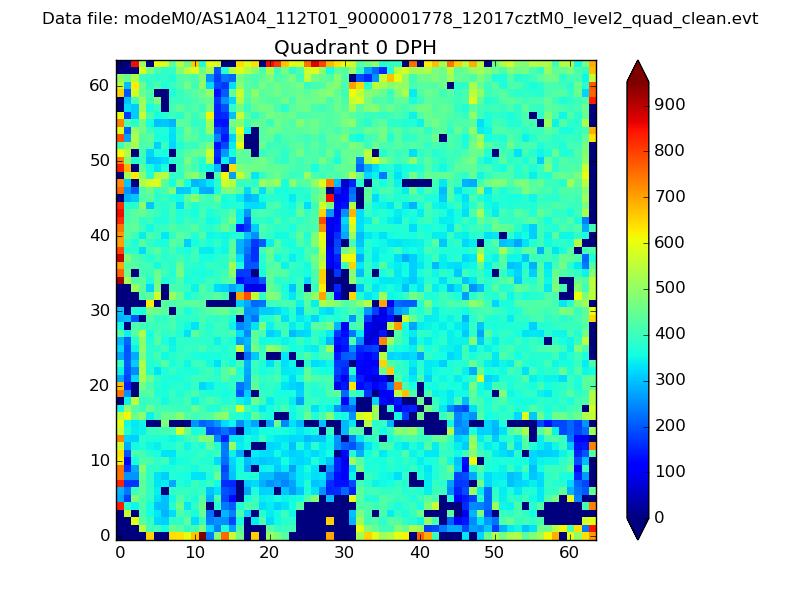 |
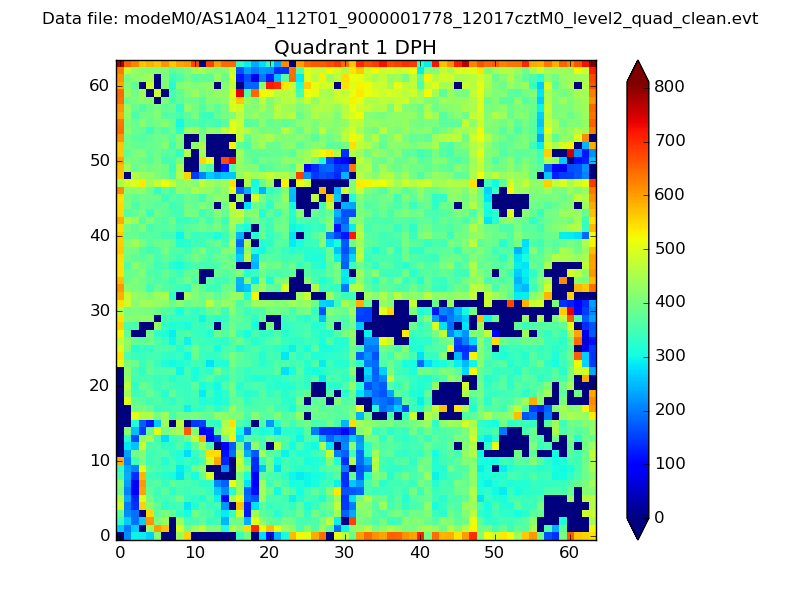 |
Quadrant B |
|---|---|---|---|
| Quadrant D | 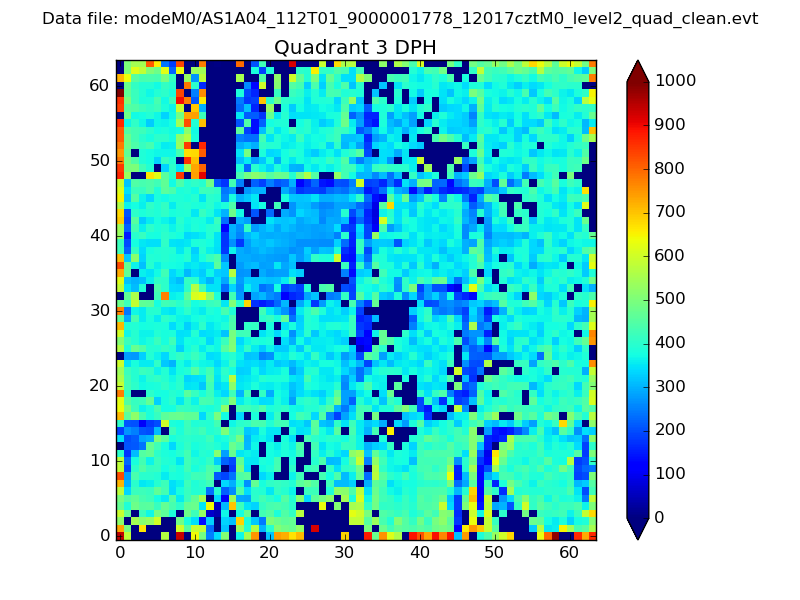 |
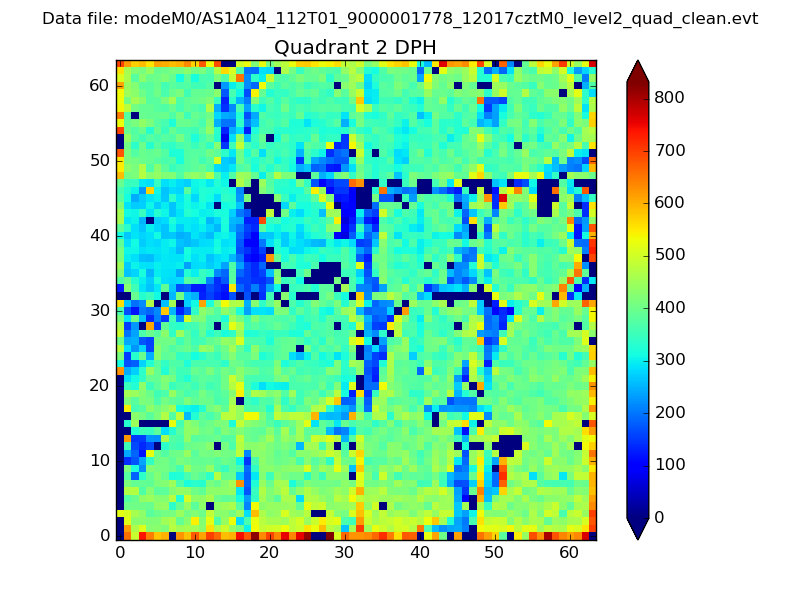 |
Quadrant C |
| Plot type | Count rate plots | Images |
|---|---|---|
| Comparison with Poisson distribution Blue bars denote a histogram of data divided into 1 sec bins. Red curve is a Poisson curve with rate = median count rate of data. |
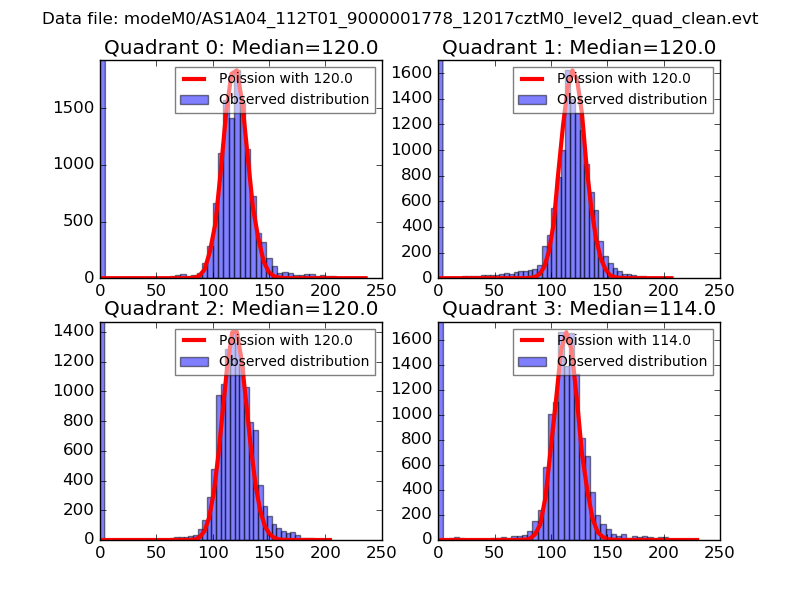 |
 |
| Quadrant-wise count rates Data is divided into 100 sec bins |
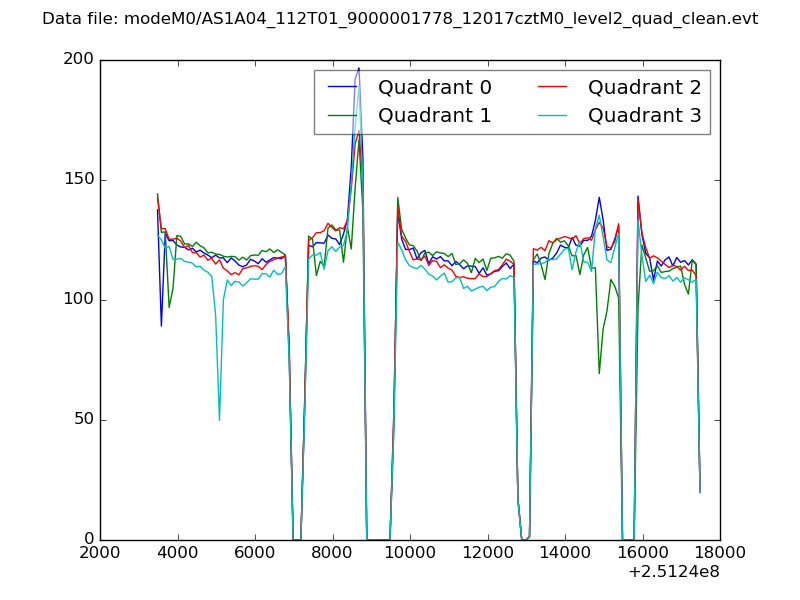 |
|
| Module-wise count rates for Quadrant A Data is divided into 100 sec bins |
 |
 |
| Module-wise count rates for Quadrant B Data is divided into 100 sec bins |
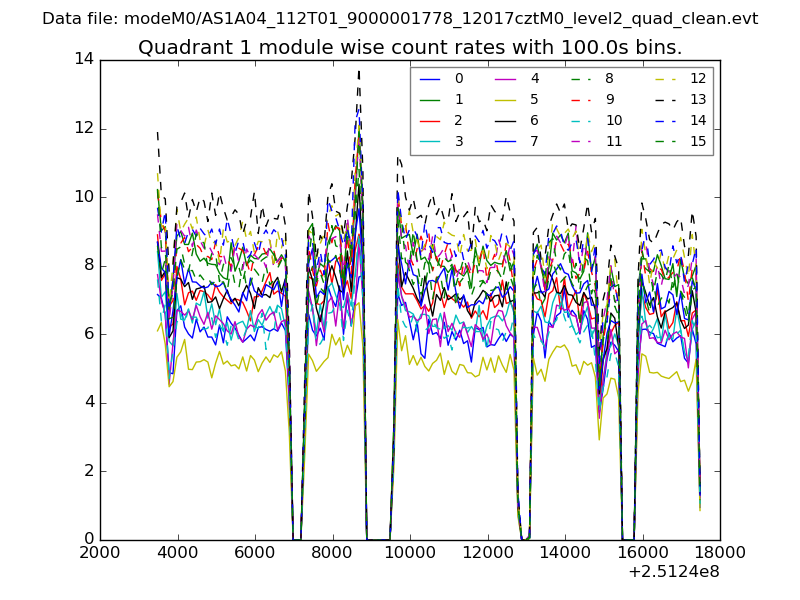 |
 |
| Module-wise count rates for Quadrant C Data is divided into 100 sec bins |
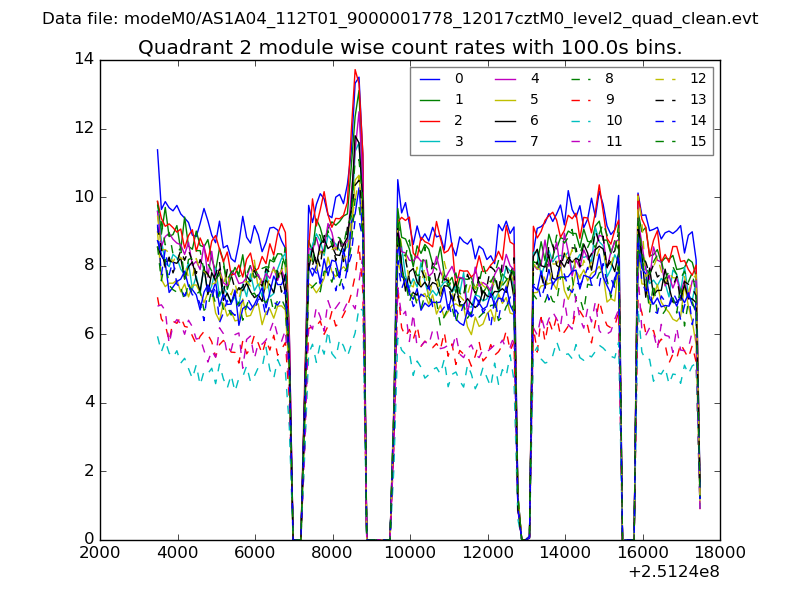 |
 |
| Module-wise count rates for Quadrant D Data is divided into 100 sec bins |
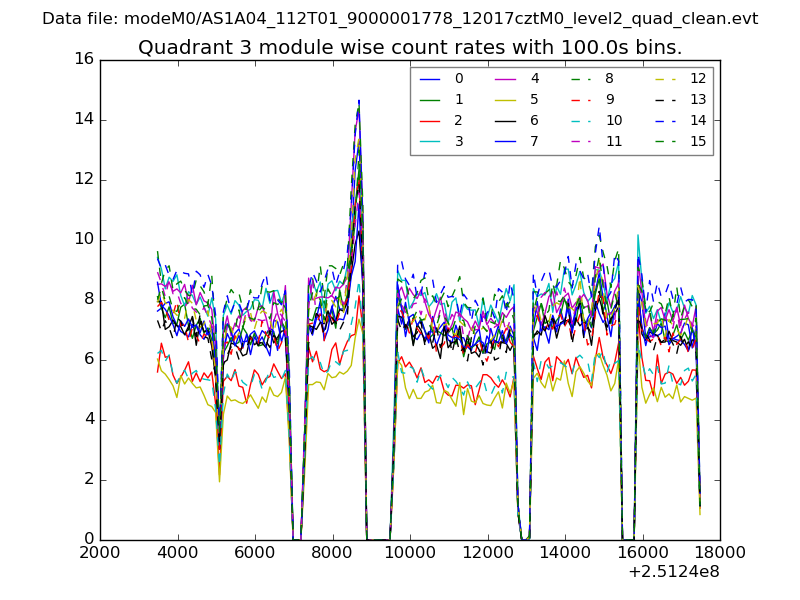 |
 |
| Parameter | Plot |
|---|---|
| CZT HV Monitor | 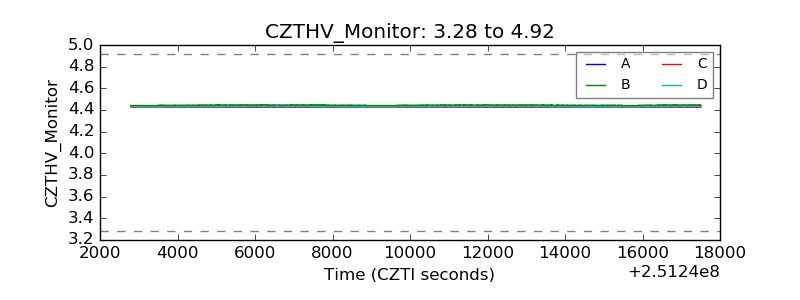 |
| D_VDD | 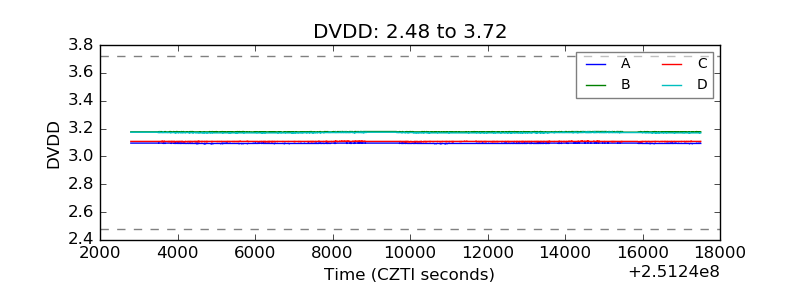 |
| Temperature 1 | 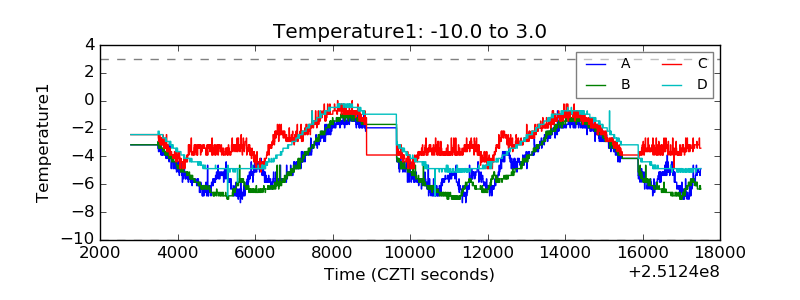 |
| Veto HV Monitor | 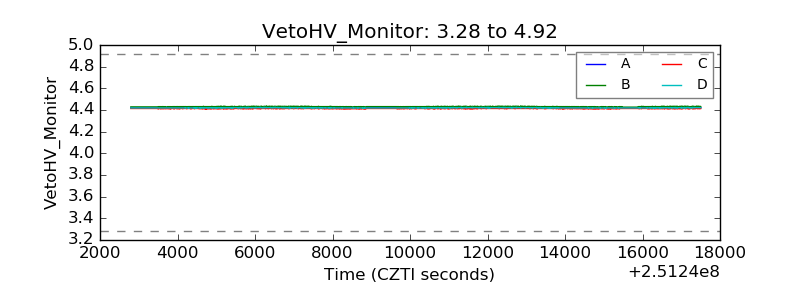 |
| Veto LLD | 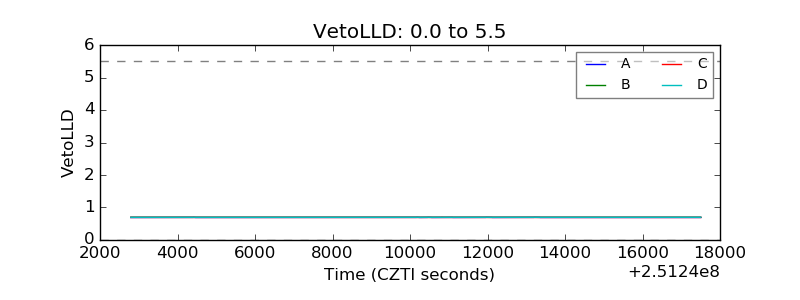 |
| Alpha Counter | 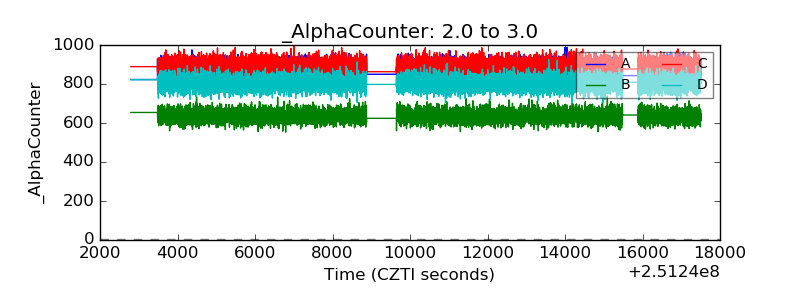 |
| _CPM_Rate | 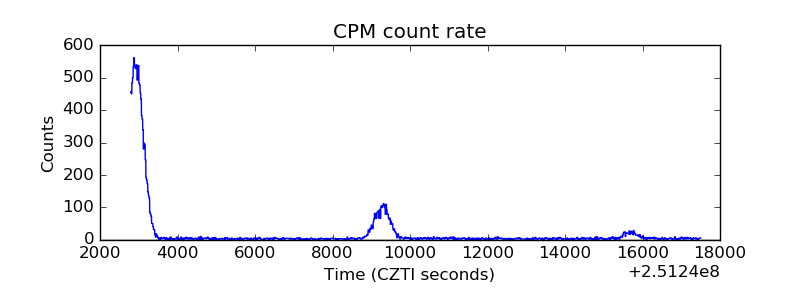 |
| CZT Counter | 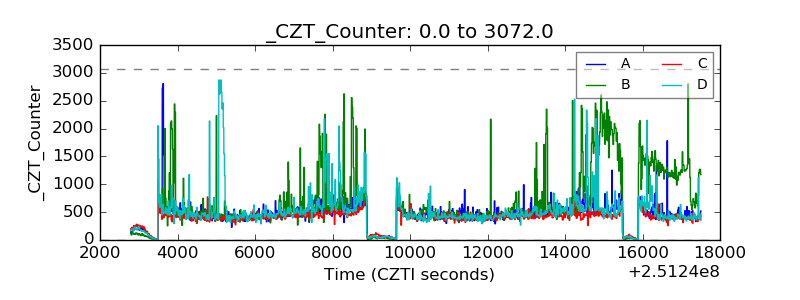 |
| +2.5 Volts monitor |  |
| +5 Volts monitor |  |
| _ROLL_ROT | 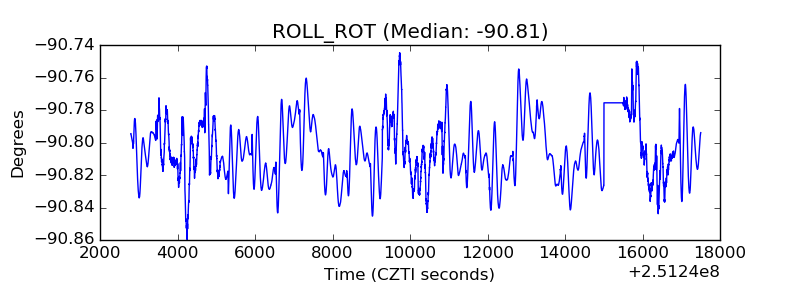 |
| _Roll_DEC |  |
| _Roll_RA | 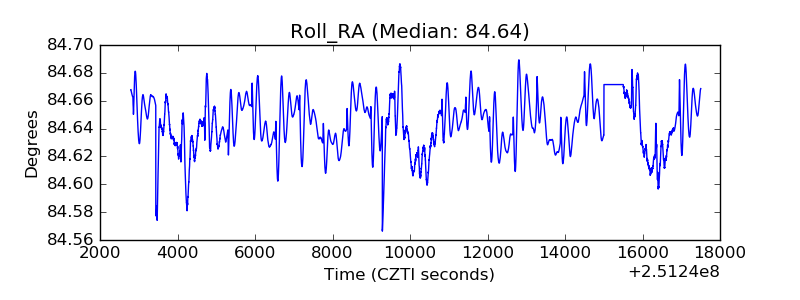 |
| Veto Counter | 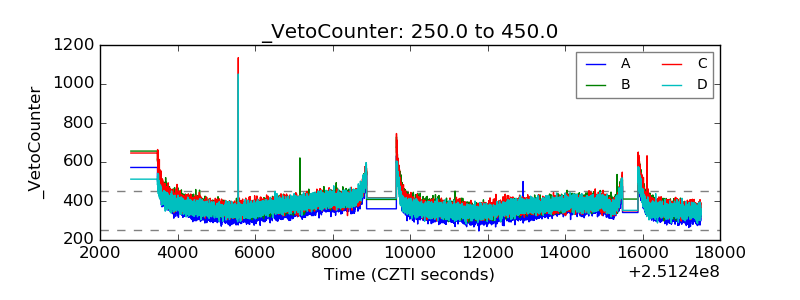 |