| Param | Original file | Final file |
|---|---|---|
| Filename | modeM0/AS1A04_112T01_9000001778_12018cztM0_level2.evt | modeM0/AS1A04_112T01_9000001778_12018cztM0_level2_quad_clean.evt |
| Size (bytes) | 689,644,800 | 122,765,760 |
| Size | 657.7 MB | 117.1 MB |
| Events in quadrant A | 3,837,673 | 822,487 |
| Events in quadrant B | 9,406,557 | 772,964 |
| Events in quadrant C | 3,204,902 | 821,718 |
| Events in quadrant D | 3,936,715 | 785,867 |
| Mode M0 | |||
|---|---|---|---|
| Quadrant | BADHDUFLAG | Total packets | Discarded packets |
| A | 0 | 16508 | 2 |
| B | 0 | 33190 | 1 |
| C | 0 | 15040 | 1 |
| D | 0 | 16959 | 1 |
| Mode SS | |||
|---|---|---|---|
| Quadrant | BADHDUFLAG | Total packets | Discarded packets |
| A | 0 | 150 | 0 |
| B | 0 | 150 | 0 |
| C | 0 | 150 | 0 |
| D | 0 | 150 | 0 |
| Mode M9 | |||
|---|---|---|---|
| Quadrant | BADHDUFLAG | Total packets | Discarded packets |
| A | 0 | 2 | 0 |
| B | 0 | 2 | 0 |
| C | 0 | 2 | 0 |
| D | 0 | 2 | 0 |
| Quadrant | Total seconds | Saturated seconds | Saturation percentage |
|---|---|---|---|
| A | 7396 | 189 | 2.555435% |
| B | 7396 | 1144 | 15.467820% |
| C | 7396 | 80 | 1.081666% |
| D | 7396 | 102 | 1.379124% |
Noise dominated data is calculated using 1-second bins in cleaned event files. If a bin has >2000 counts, and if more than 50% of those come from <1% of pixels, then it is considered to be noise-dominated and hence unusable.
| Quadrant | # 1 sec bins | Bins with >0 counts | Bins with >2000 counts | High rate bins dominated by noise | Noise dominated (total time) | Noise dominated (detector-on time) | Marked lightcurve |
|---|---|---|---|---|---|---|---|
| A | 7637 | 7398 | 50 | 50 | 0.65% | 0.68% | 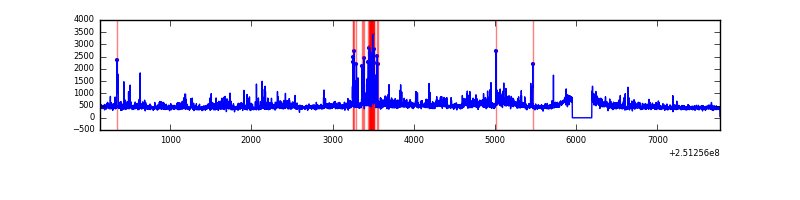 |
| B | 7637 | 7397 | 659 | 659 | 8.63% | 8.91% | 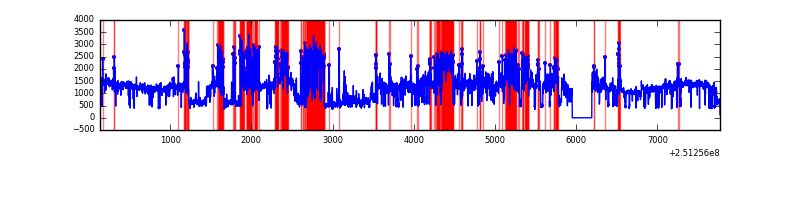 |
| C | 7637 | 7397 | 4 | 4 | 0.05% | 0.05% | 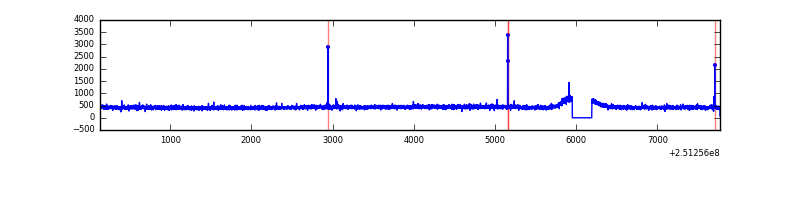 |
| D | 7637 | 7398 | 32 | 32 | 0.42% | 0.43% | 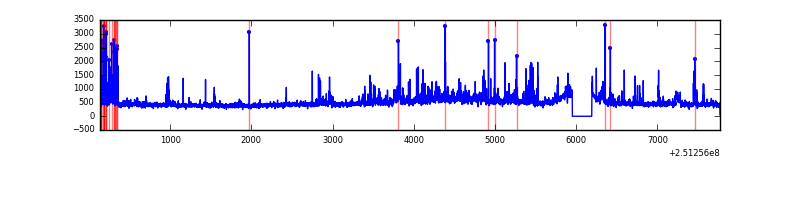 |
Top three noisy pixels from each quadrant. If the there are fewer than three noisy pixels in the level2.evt file, extra rows are filled as -1
| Pixel properties | Quadrant properties | ||||||
|---|---|---|---|---|---|---|---|
| Quadrant | DetID | PixID | Counts | Sigma | Mean | Median | Sigma |
| A | 13 | 248 | 196468 | 1136.89 | 832 | 811 | 172.1 |
| A | 1 | 162 | 154193 | 891.25 | 832 | 811 | 172.1 |
| A | 1 | 178 | 84294 | 485.09 | 832 | 811 | 172.1 |
| B | 4 | 206 | 4504334 | 29706.63 | 797 | 776 | 151.6 |
| B | 3 | 64 | 798879 | 5264.49 | 797 | 776 | 151.6 |
| B | 4 | 239 | 765784 | 5046.19 | 797 | 776 | 151.6 |
| C | 14 | 234 | 15969 | 80.23 | 817 | 817 | 188.9 |
| C | 13 | 61 | 6170 | 28.34 | 817 | 817 | 188.9 |
| C | 8 | 222 | 2715 | 10.05 | 817 | 817 | 188.9 |
| D | 8 | 195 | 279288 | 1436.24 | 809 | 784 | 193.9 |
| D | 1 | 52 | 220642 | 1133.8 | 809 | 784 | 193.9 |
| D | 13 | 104 | 107843 | 552.1 | 809 | 784 | 193.9 |
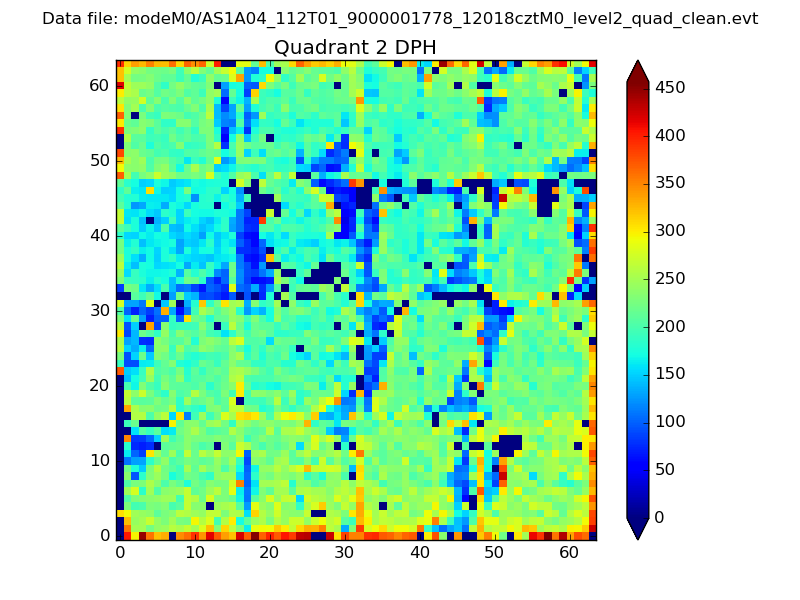
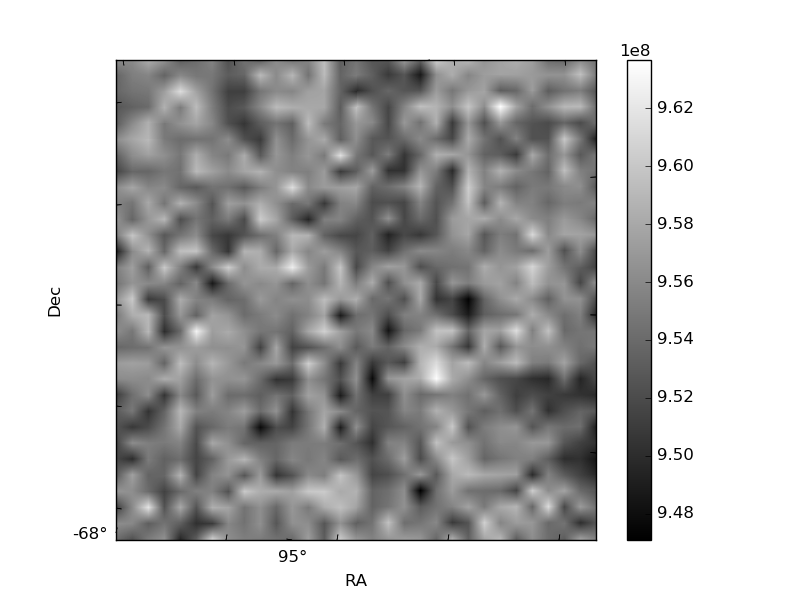
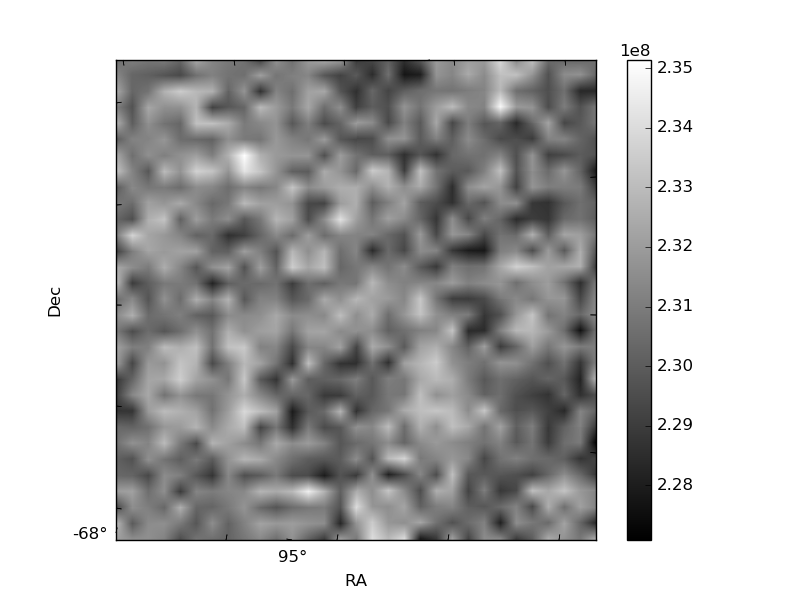
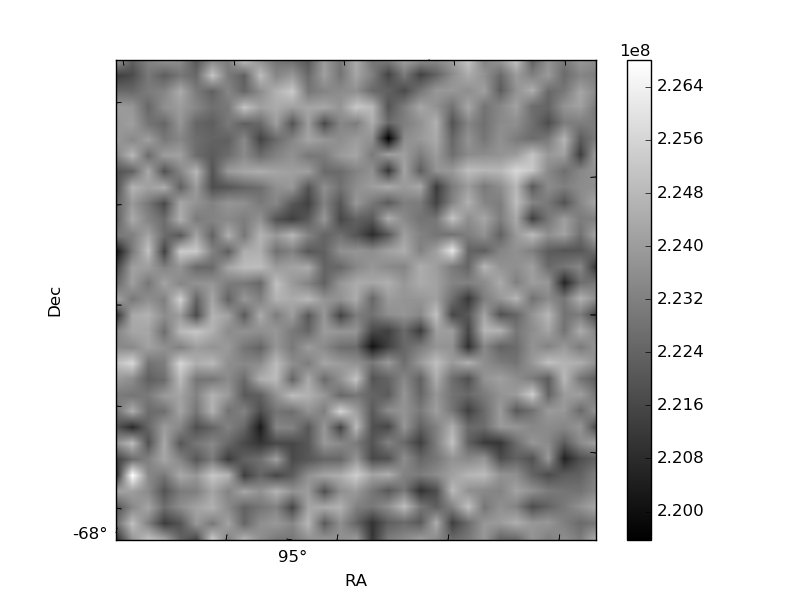
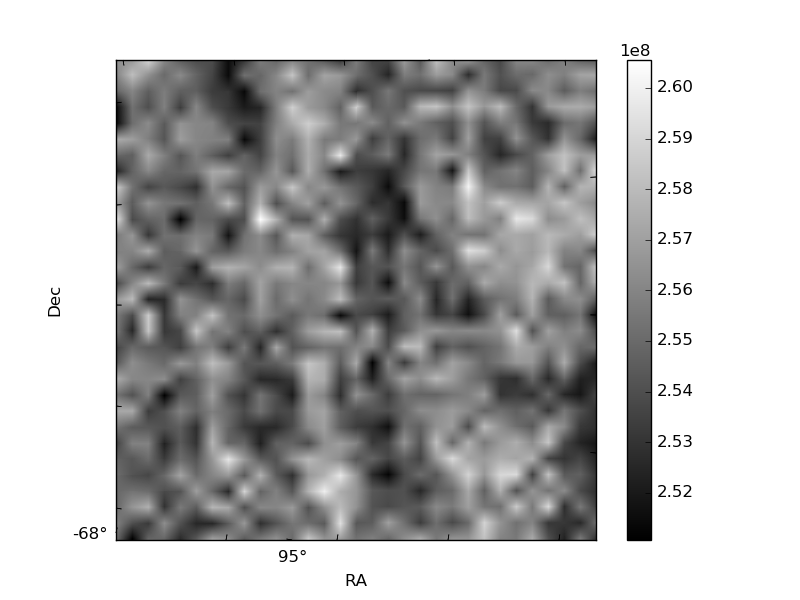
Histogram calculated using DETX and DETY for each event in the final _common_clean file
| Quadrant A | 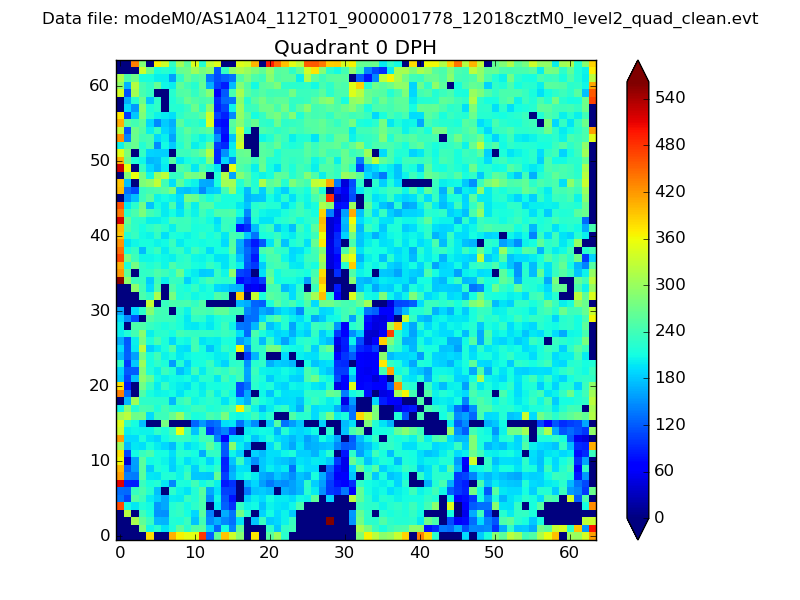 |
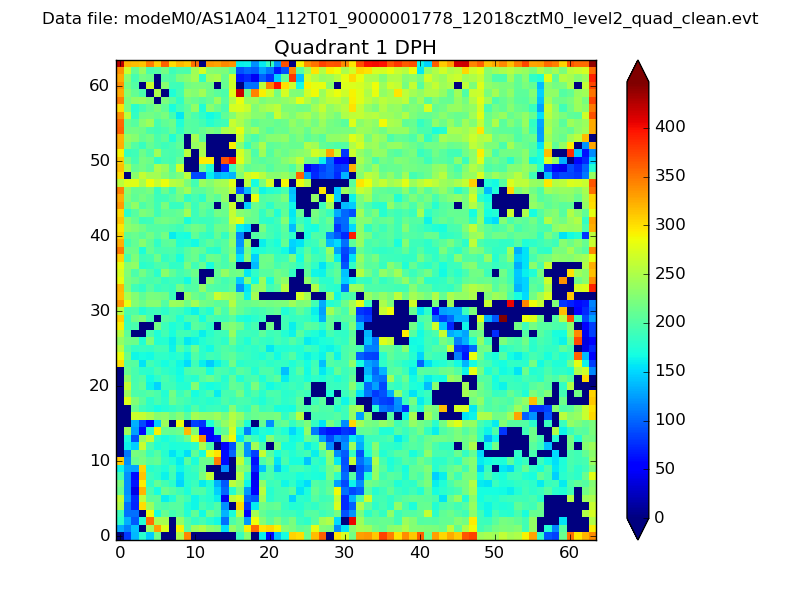 |
Quadrant B |
|---|---|---|---|
| Quadrant D | 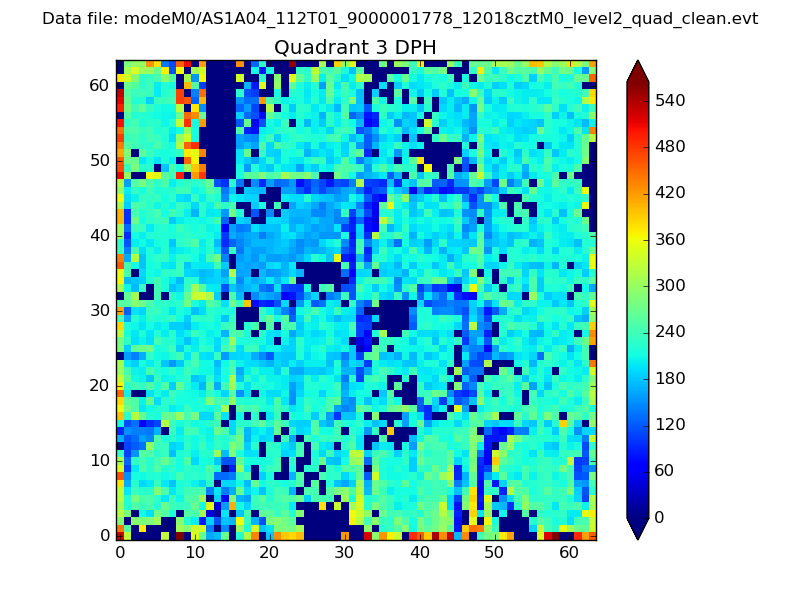 |
 |
Quadrant C |
| Plot type | Count rate plots | Images |
|---|---|---|
| Comparison with Poisson distribution Blue bars denote a histogram of data divided into 1 sec bins. Red curve is a Poisson curve with rate = median count rate of data. |
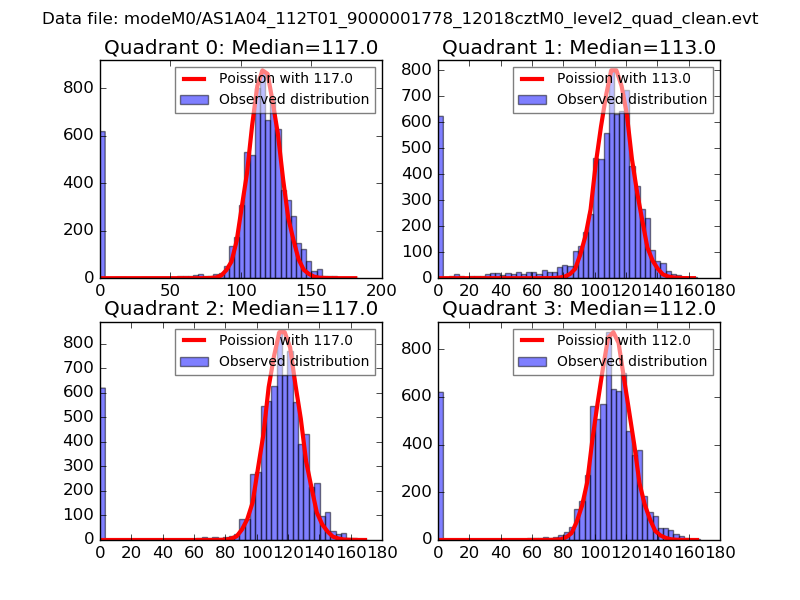 |
 |
| Quadrant-wise count rates Data is divided into 100 sec bins |
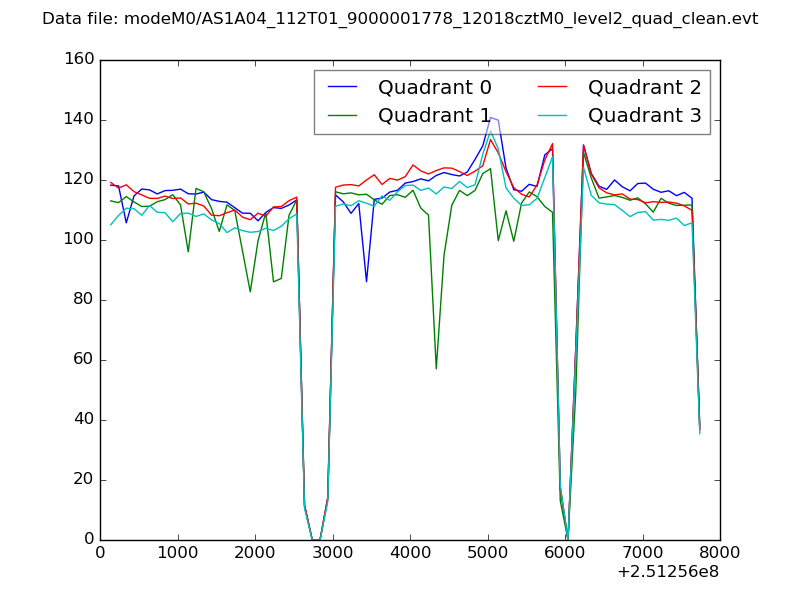 |
|
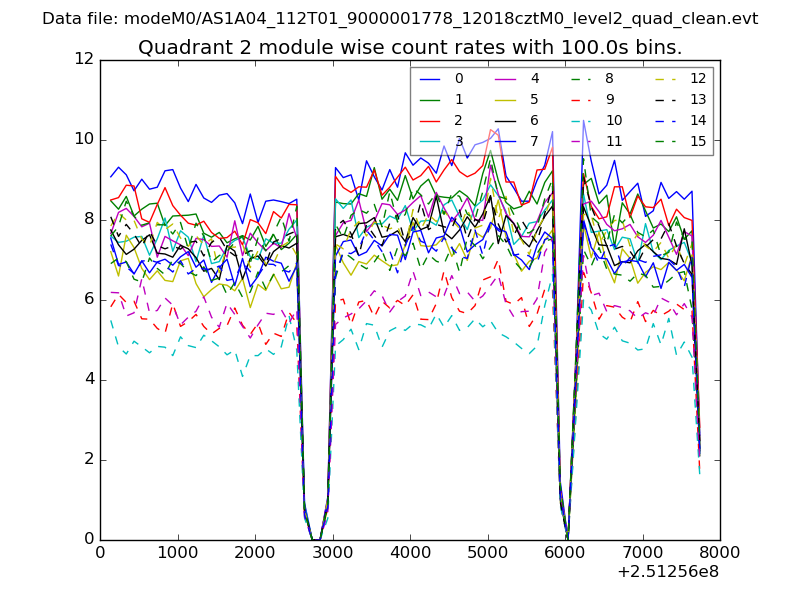
| Module-wise count rates for Quadrant A Data is divided into 100 sec bins |
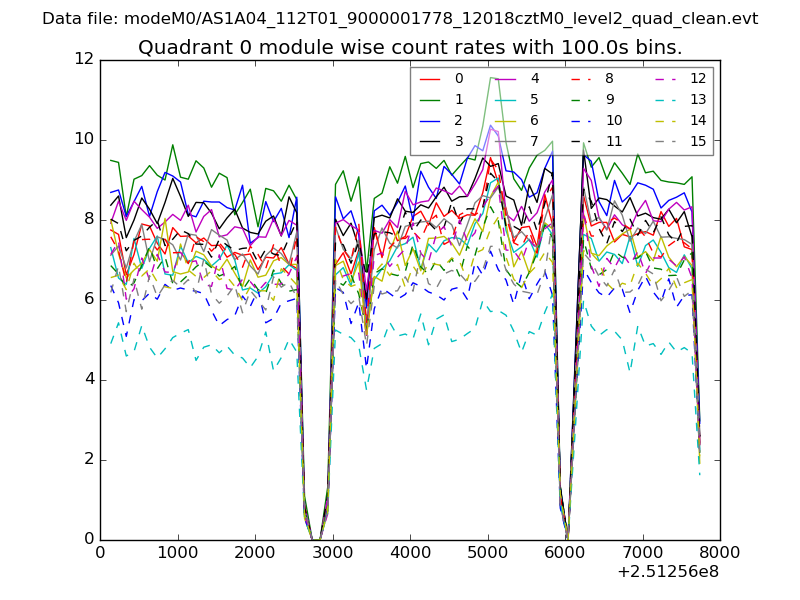 |
 |
| Module-wise count rates for Quadrant B Data is divided into 100 sec bins |
 |
 |
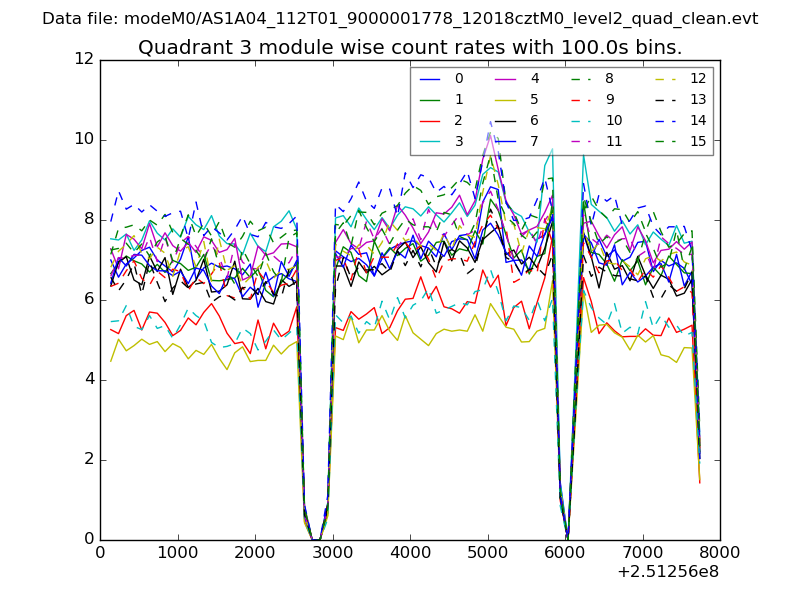
| Module-wise count rates for Quadrant C Data is divided into 100 sec bins |
 |
 |
| Module-wise count rates for Quadrant D Data is divided into 100 sec bins |
 |
 |
| Parameter | Plot |
|---|---|
| CZT HV Monitor | 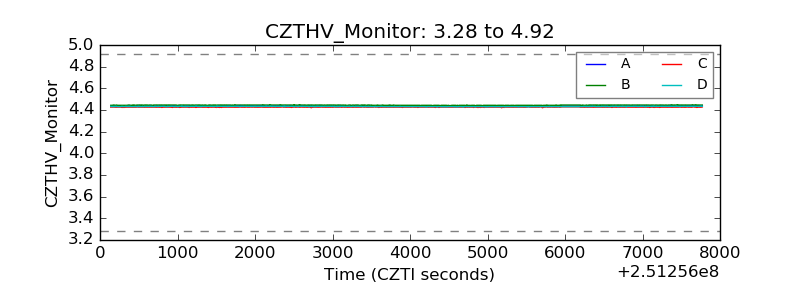 |
| D_VDD |  |
| Temperature 1 | 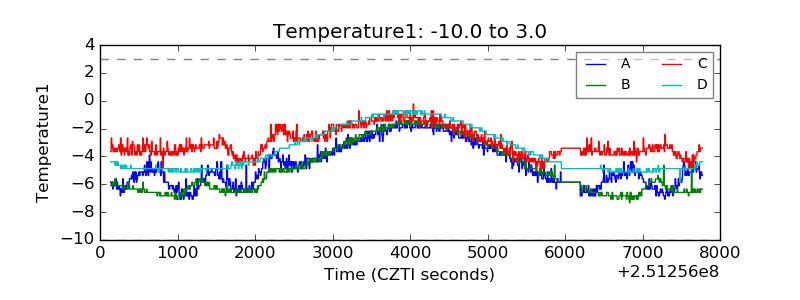 |
| Veto HV Monitor | 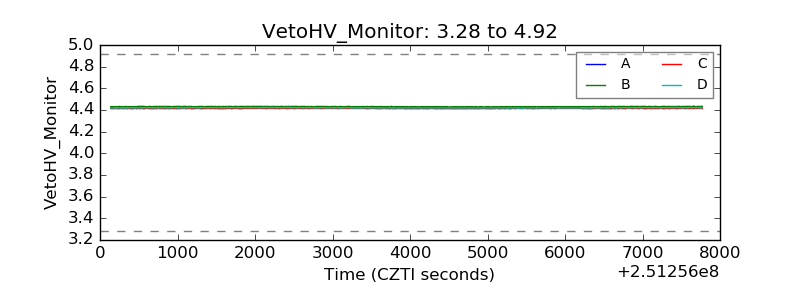 |
| Veto LLD | 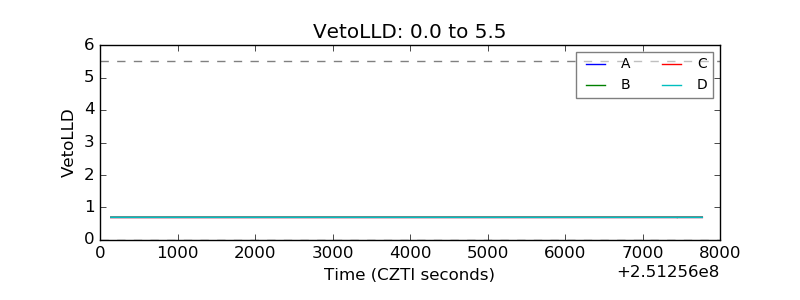 |
| Alpha Counter | 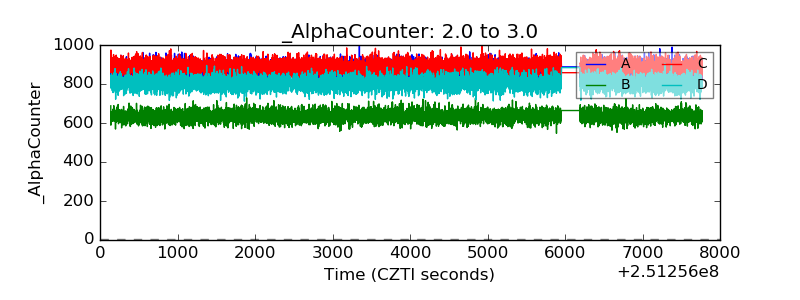 |
| _CPM_Rate | 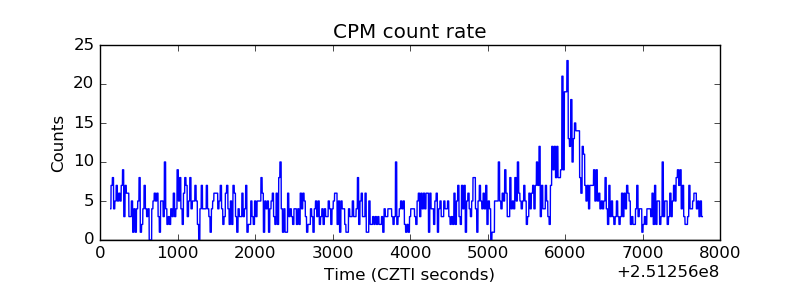 |
| CZT Counter | 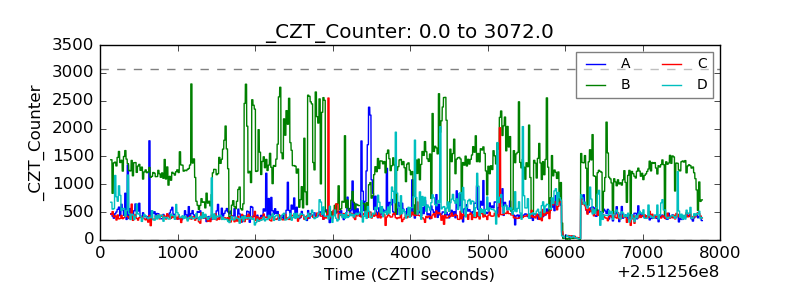 |
| +2.5 Volts monitor |  |
| +5 Volts monitor |  |
| _ROLL_ROT | 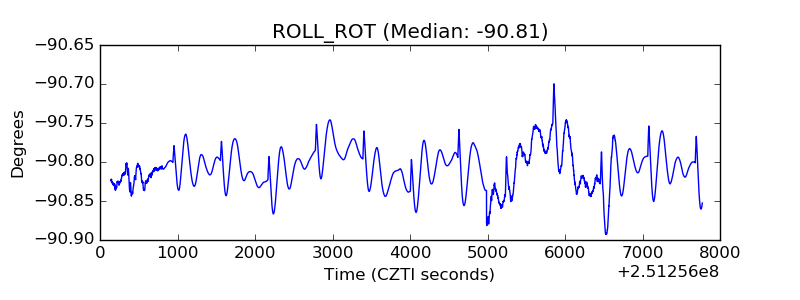 |
| _Roll_DEC | 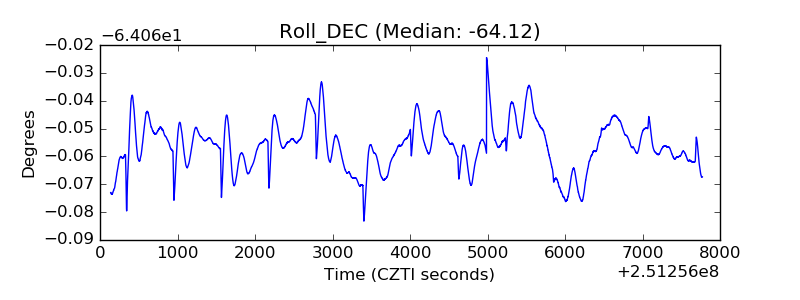 |
| _Roll_RA | 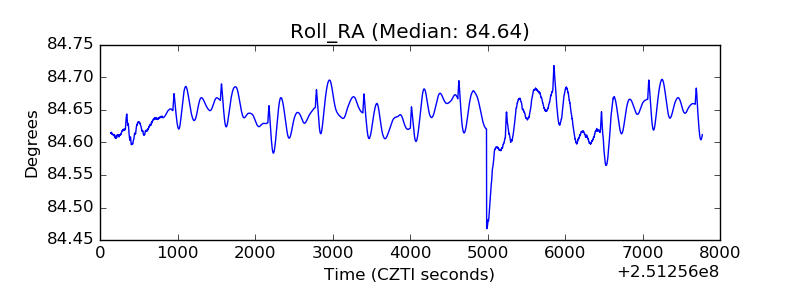 |
| Veto Counter | 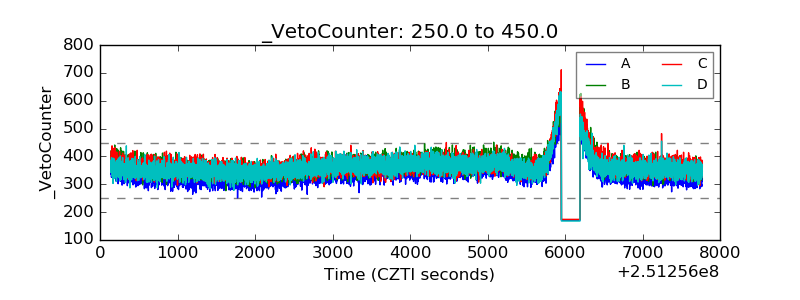 |