| Param | Original file | Final file |
|---|---|---|
| Filename | modeM0/AS1A04_112T01_9000001778_12025cztM0_level2.evt | modeM0/AS1A04_112T01_9000001778_12025cztM0_level2_quad_clean.evt |
| Size (bytes) | 555,281,280 | 116,089,920 |
| Size | 529.6 MB | 110.7 MB |
| Events in quadrant A | 3,727,174 | 771,559 |
| Events in quadrant B | 5,046,265 | 761,583 |
| Events in quadrant C | 3,015,892 | 775,739 |
| Events in quadrant D | 4,566,100 | 732,601 |
| Mode M0 | |||
|---|---|---|---|
| Quadrant | BADHDUFLAG | Total packets | Discarded packets |
| A | 0 | 15732 | 1 |
| B | 0 | 19599 | 1 |
| C | 0 | 13915 | 1 |
| D | 0 | 18272 | 1 |
| Mode SS | |||
|---|---|---|---|
| Quadrant | BADHDUFLAG | Total packets | Discarded packets |
| A | 0 | 138 | 0 |
| B | 0 | 138 | 0 |
| C | 0 | 138 | 0 |
| D | 0 | 138 | 0 |
| Mode M9 | |||
|---|---|---|---|
| Quadrant | BADHDUFLAG | Total packets | Discarded packets |
| A | 0 | 10 | 0 |
| B | 0 | 10 | 0 |
| C | 0 | 10 | 0 |
| D | 0 | 10 | 0 |
| Quadrant | Total seconds | Saturated seconds | Saturation percentage |
|---|---|---|---|
| A | 6806 | 130 | 1.910079% |
| B | 6806 | 371 | 5.451073% |
| C | 6806 | 49 | 0.719953% |
| D | 6806 | 253 | 3.717308% |
Noise dominated data is calculated using 1-second bins in cleaned event files. If a bin has >2000 counts, and if more than 50% of those come from <1% of pixels, then it is considered to be noise-dominated and hence unusable.
| Quadrant | # 1 sec bins | Bins with >0 counts | Bins with >2000 counts | High rate bins dominated by noise | Noise dominated (total time) | Noise dominated (detector-on time) | Marked lightcurve |
|---|---|---|---|---|---|---|---|
| A | 7812 | 6807 | 27 | 27 | 0.35% | 0.40% | 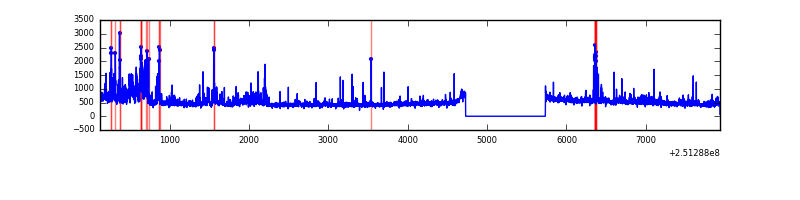 |
| B | 7812 | 6807 | 216 | 216 | 2.76% | 3.17% | 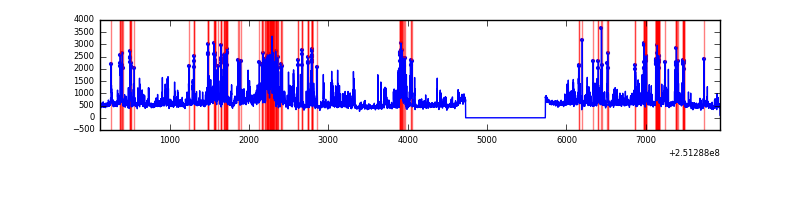 |
| C | 7812 | 6807 | 0 | 0 | 0.00% | 0.00% | 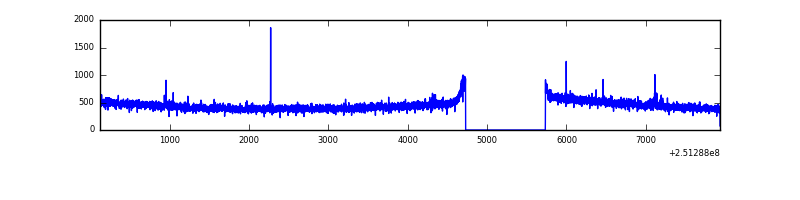 |
| D | 7812 | 6807 | 159 | 159 | 2.04% | 2.34% | 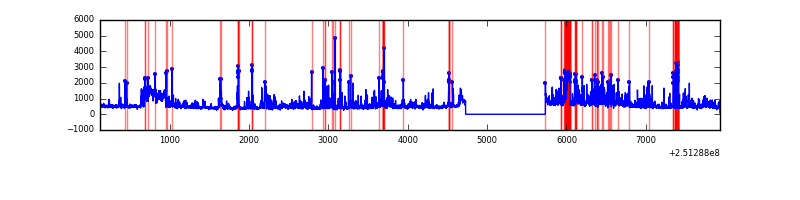 |
Top three noisy pixels from each quadrant. If the there are fewer than three noisy pixels in the level2.evt file, extra rows are filled as -1
| Pixel properties | Quadrant properties | ||||||
|---|---|---|---|---|---|---|---|
| Quadrant | DetID | PixID | Counts | Sigma | Mean | Median | Sigma |
| A | 13 | 248 | 451778 | 2784.1 | 795 | 778 | 162.0 |
| A | 1 | 162 | 81840 | 500.41 | 795 | 778 | 162.0 |
| A | 1 | 178 | 39722 | 240.41 | 795 | 778 | 162.0 |
| B | 4 | 239 | 673065 | 4514.54 | 785 | 767 | 148.9 |
| B | 3 | 64 | 418583 | 2805.67 | 785 | 767 | 148.9 |
| B | 10 | 245 | 258514 | 1730.79 | 785 | 767 | 148.9 |
| C | 0 | 207 | 12266 | 64.63 | 769 | 773 | 177.8 |
| C | 13 | 61 | 5788 | 28.2 | 769 | 773 | 177.8 |
| C | 14 | 234 | 4926 | 23.36 | 769 | 773 | 177.8 |
| D | 1 | 52 | 481157 | 2621.63 | 760 | 738 | 183.3 |
| D | 4 | 95 | 293516 | 1597.68 | 760 | 738 | 183.3 |
| D | 13 | 104 | 185925 | 1010.56 | 760 | 738 | 183.3 |
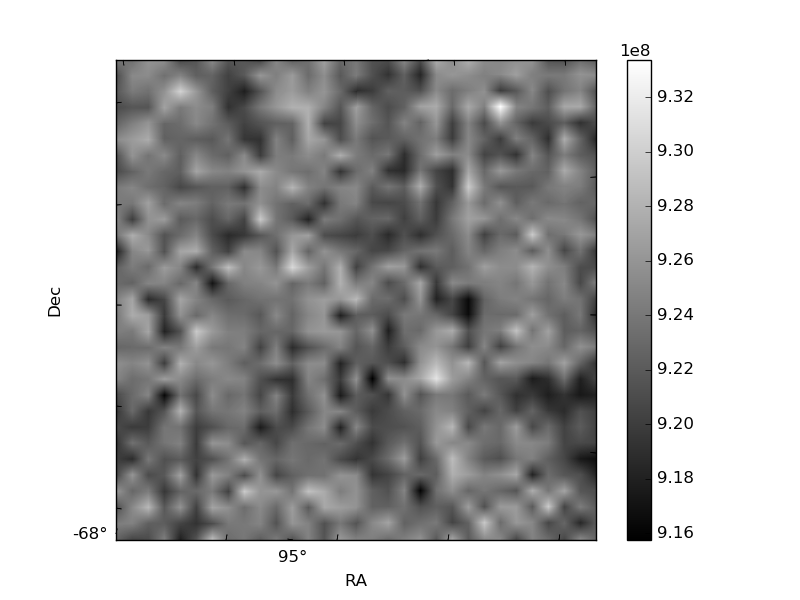
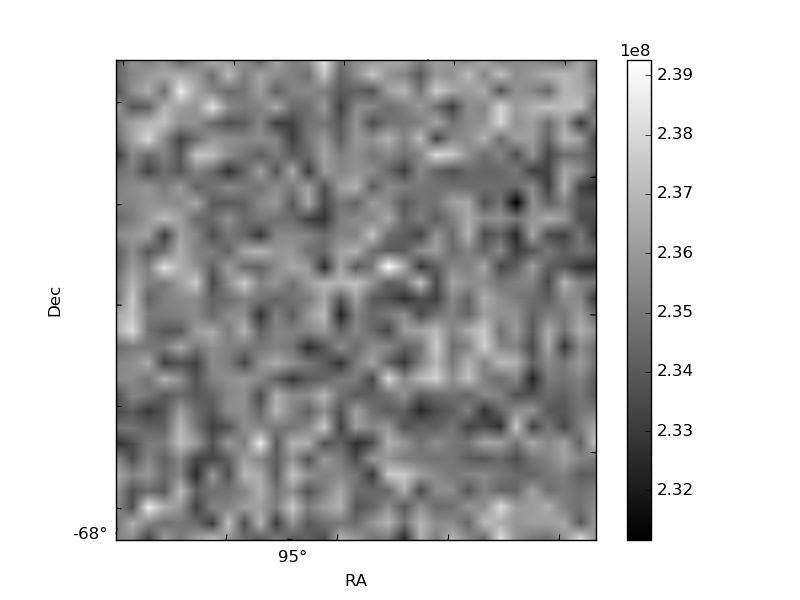
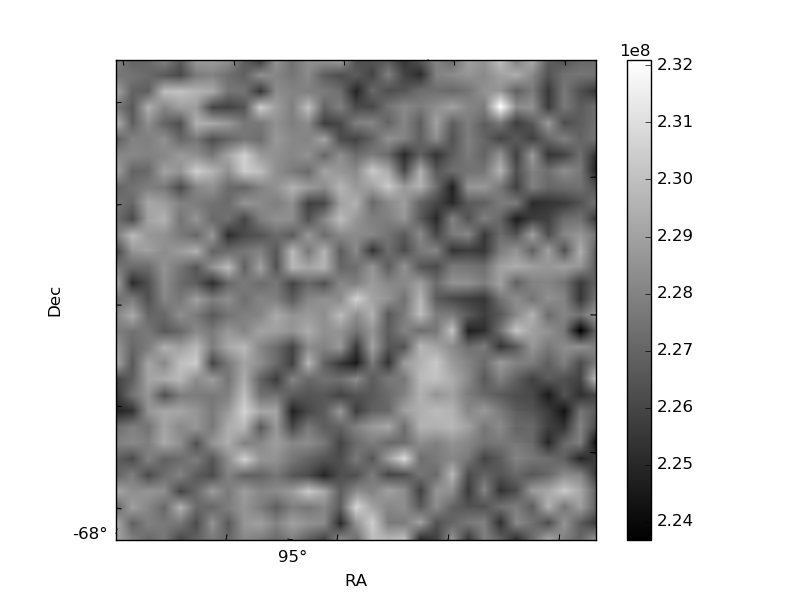
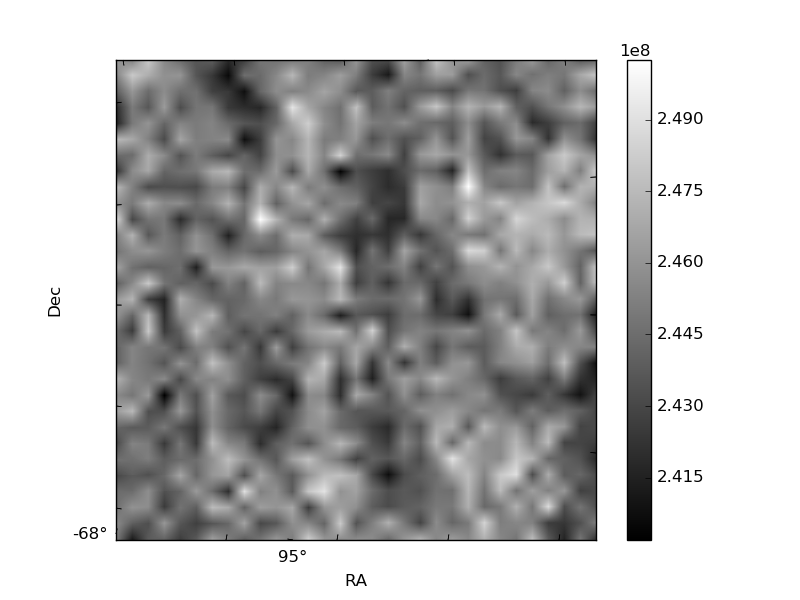
Histogram calculated using DETX and DETY for each event in the final _common_clean file
| Quadrant A | 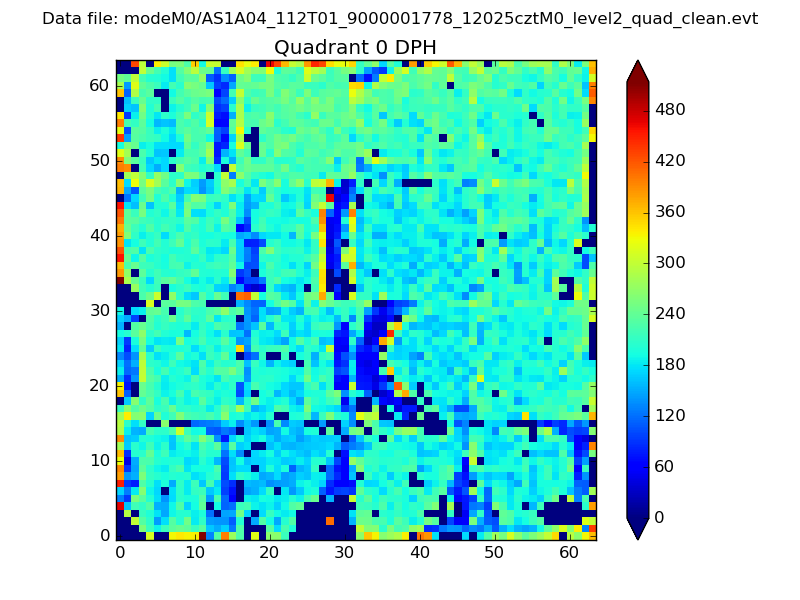 |
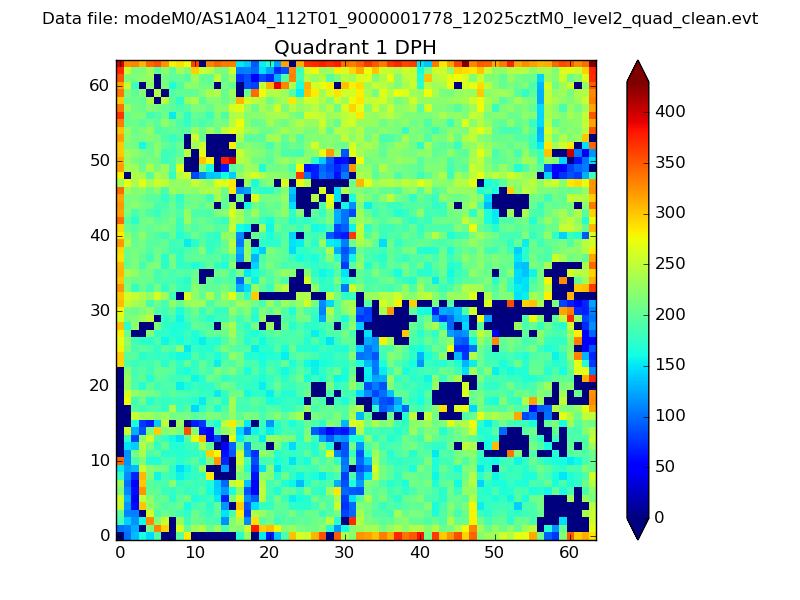 |
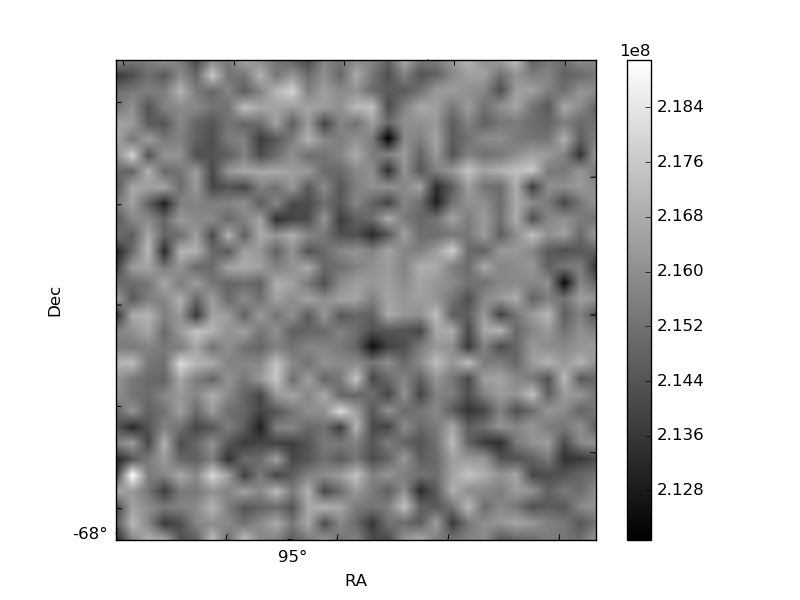
Quadrant B |
|---|---|---|---|
| Quadrant D | 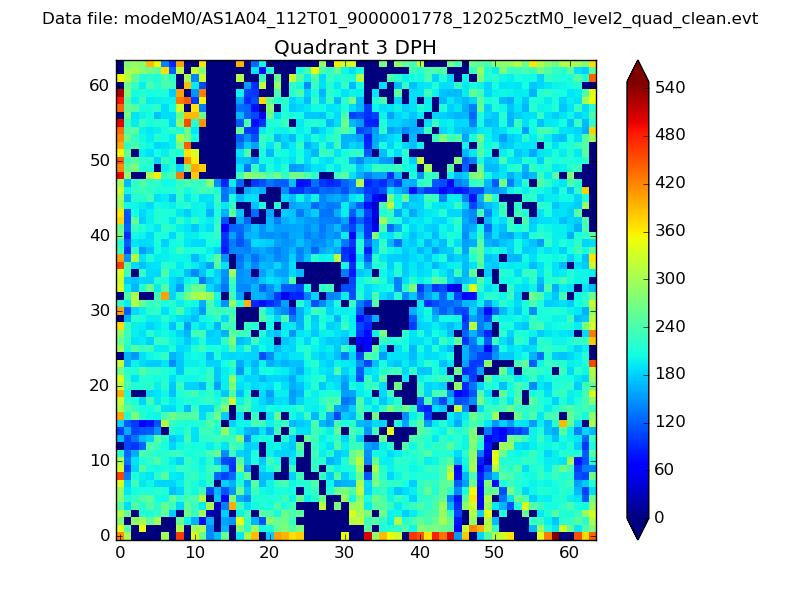 |
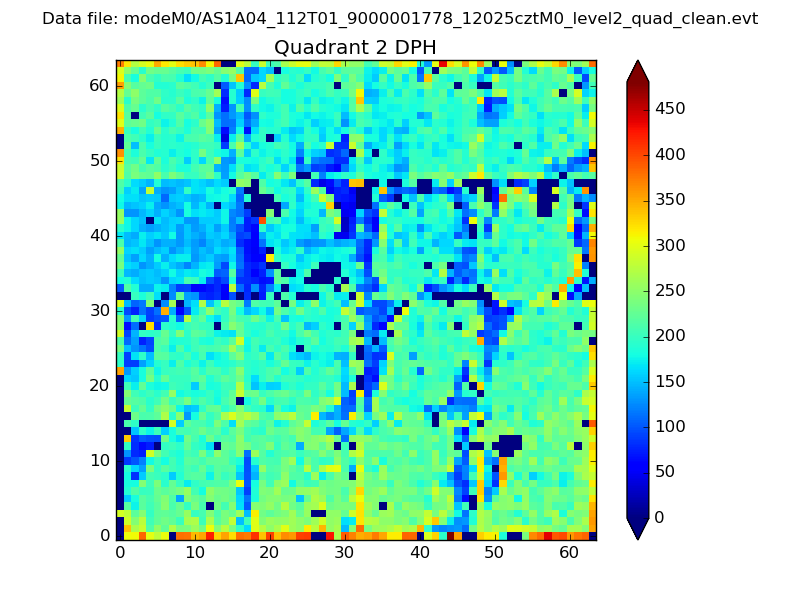 |
Quadrant C |
| Plot type | Count rate plots | Images |
|---|---|---|
| Comparison with Poisson distribution Blue bars denote a histogram of data divided into 1 sec bins. Red curve is a Poisson curve with rate = median count rate of data. |
 |
 |
| Quadrant-wise count rates Data is divided into 100 sec bins |
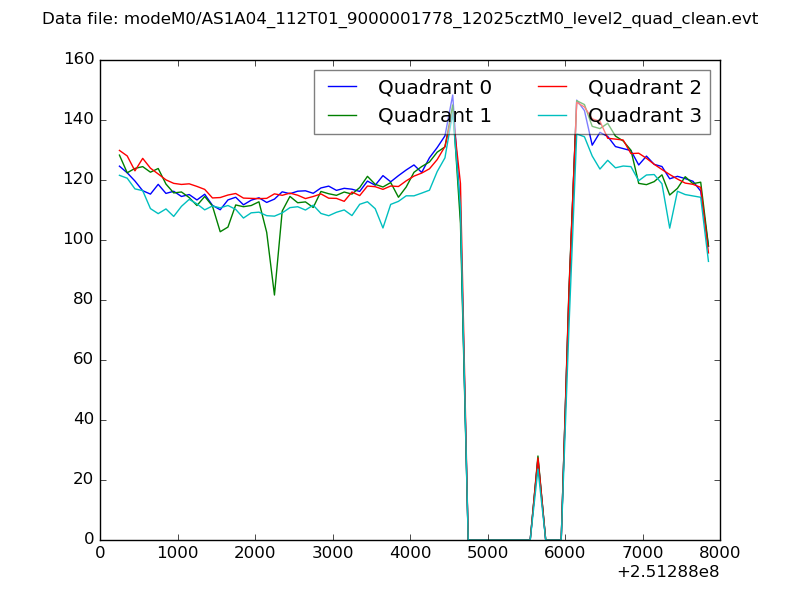 |
|
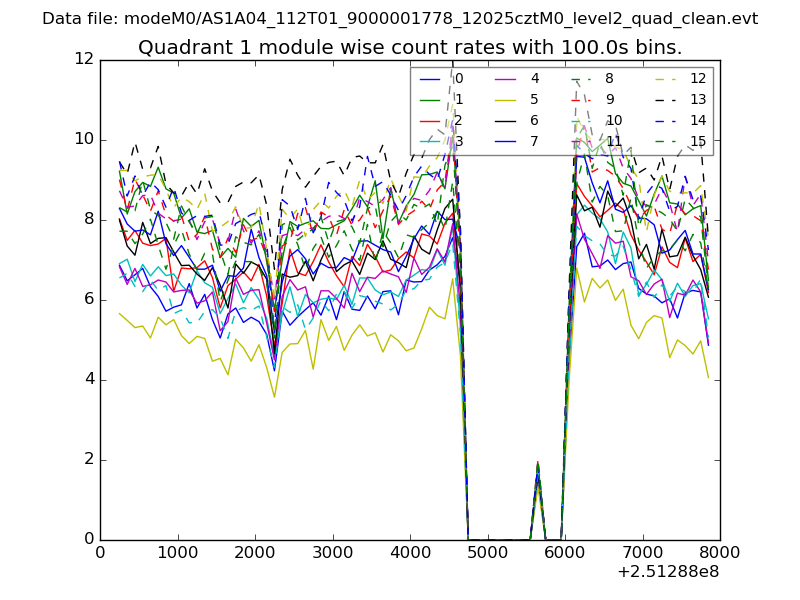
| Module-wise count rates for Quadrant A Data is divided into 100 sec bins |
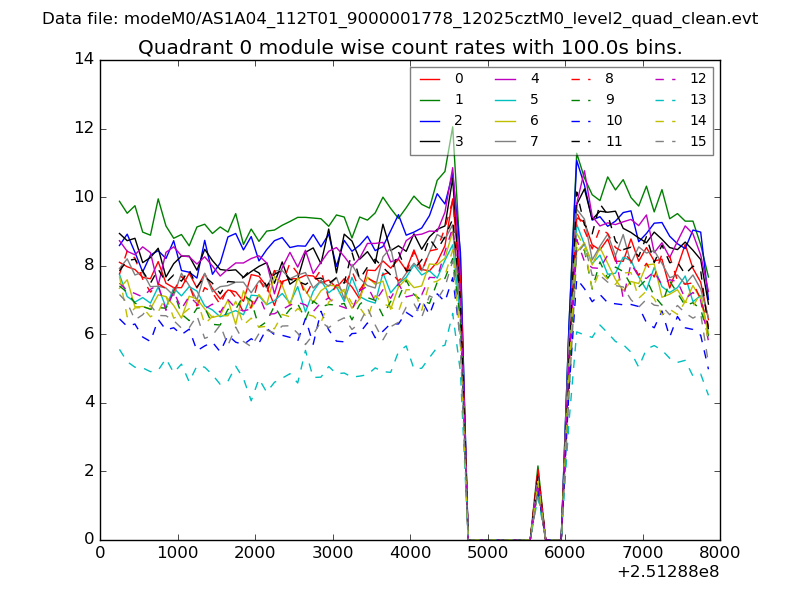 |
 |
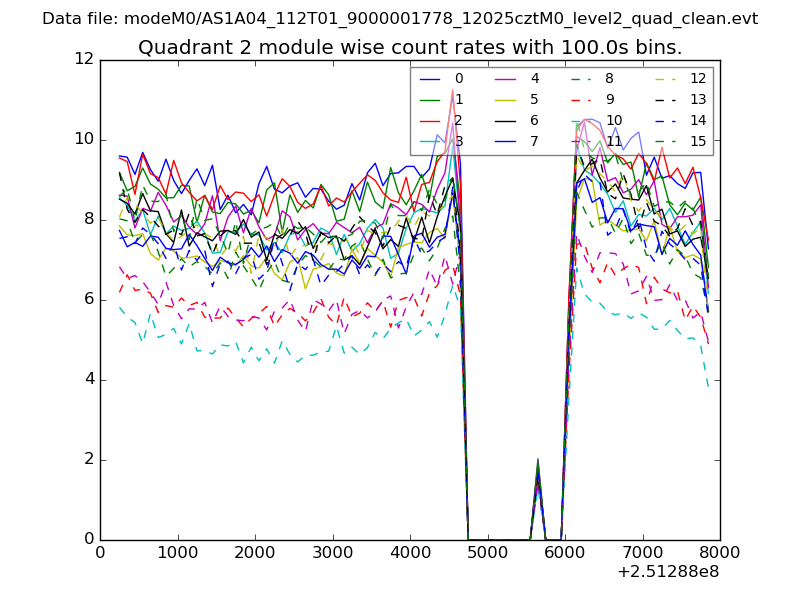
| Module-wise count rates for Quadrant B Data is divided into 100 sec bins |
 |
 |
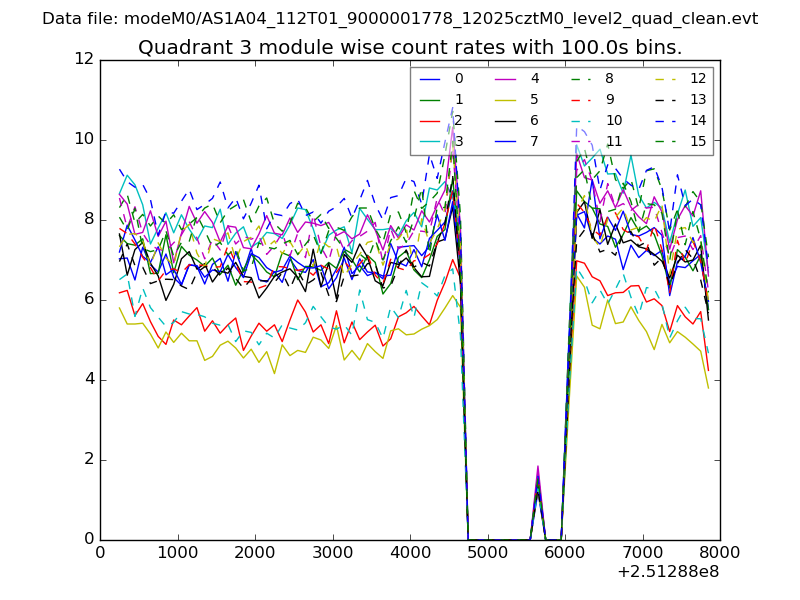
| Module-wise count rates for Quadrant C Data is divided into 100 sec bins |
 |
 |
| Module-wise count rates for Quadrant D Data is divided into 100 sec bins |
 |
 |
| Parameter | Plot |
|---|---|
| CZT HV Monitor | 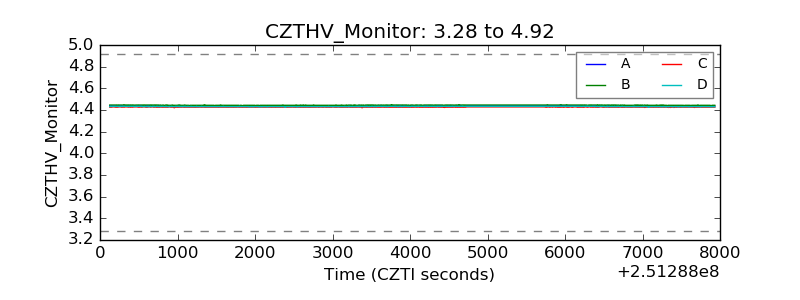 |
| D_VDD | 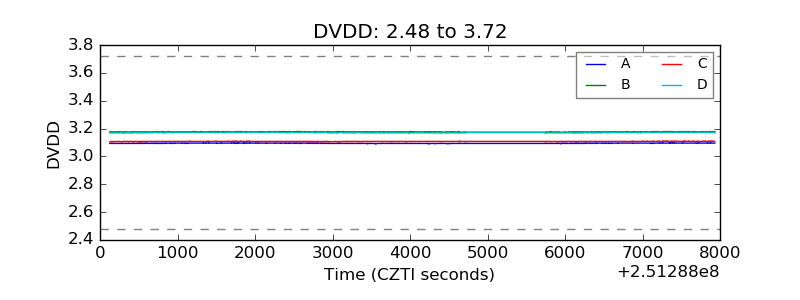 |
| Temperature 1 | 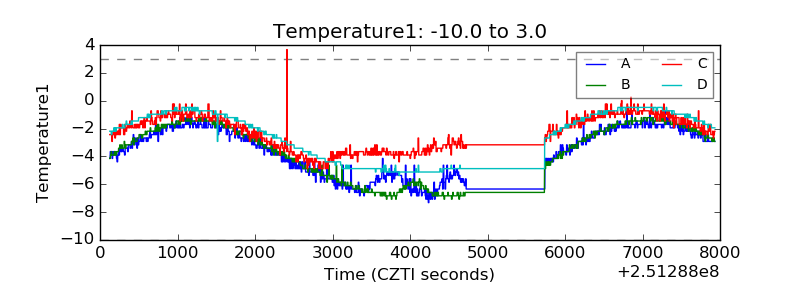 |
| Veto HV Monitor | 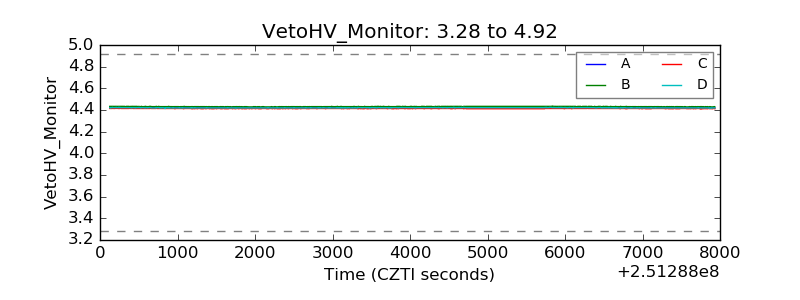 |
| Veto LLD | 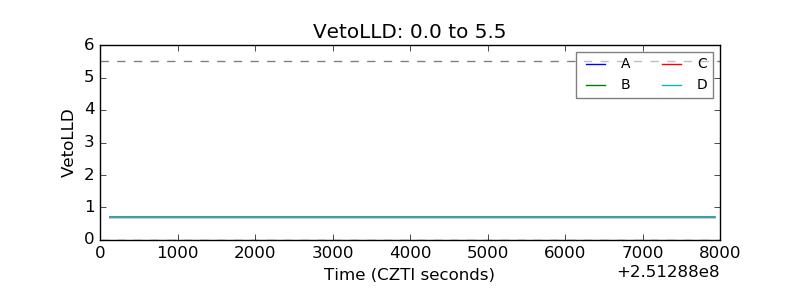 |
| Alpha Counter | 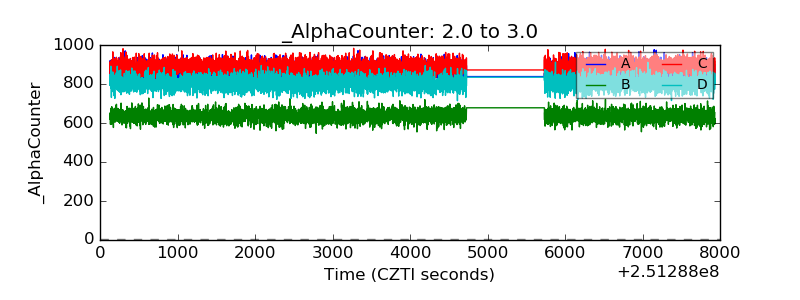 |
| _CPM_Rate | 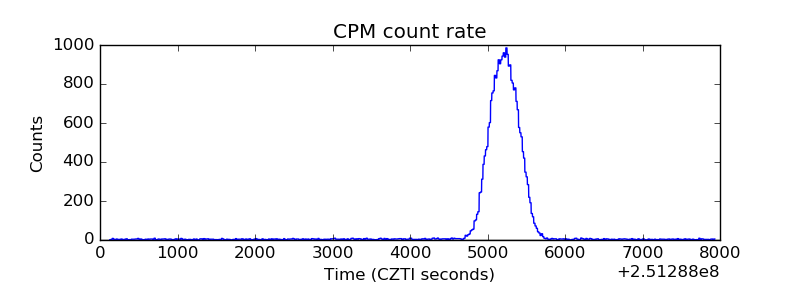 |
| CZT Counter | 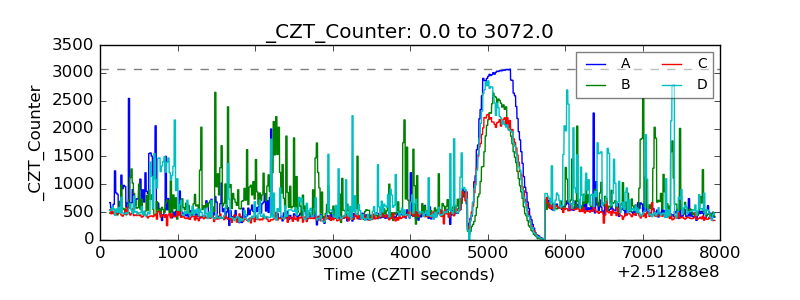 |
| +2.5 Volts monitor | 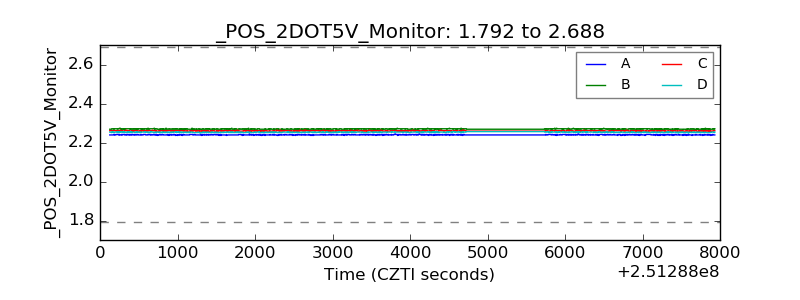 |
| +5 Volts monitor |  |
| _ROLL_ROT | 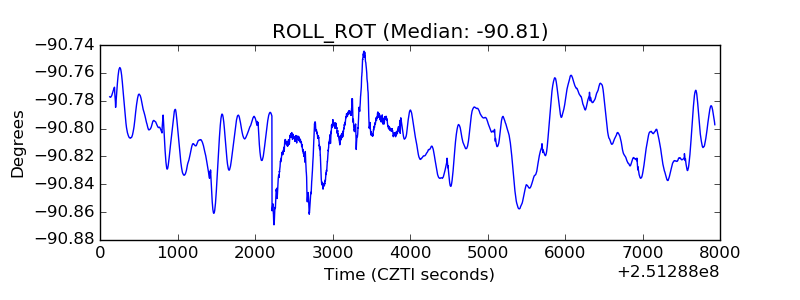 |
| _Roll_DEC | 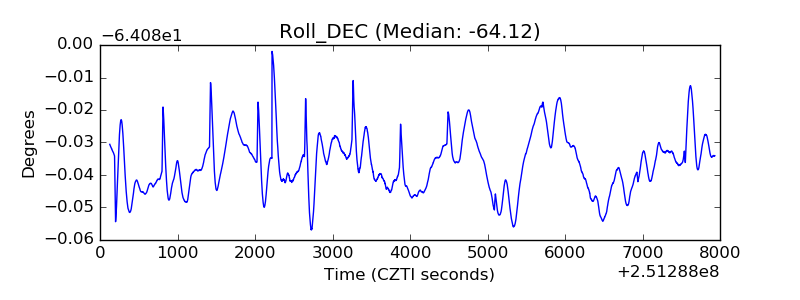 |
| _Roll_RA | 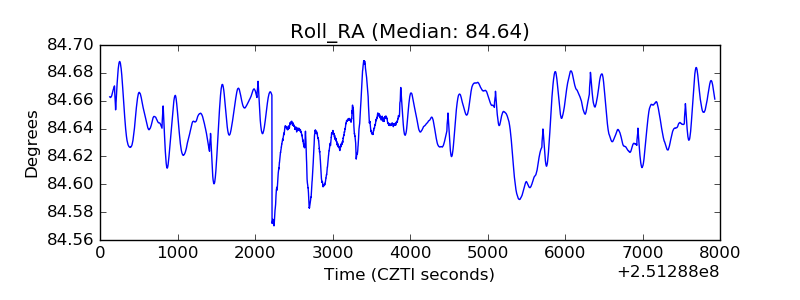 |
| Veto Counter | 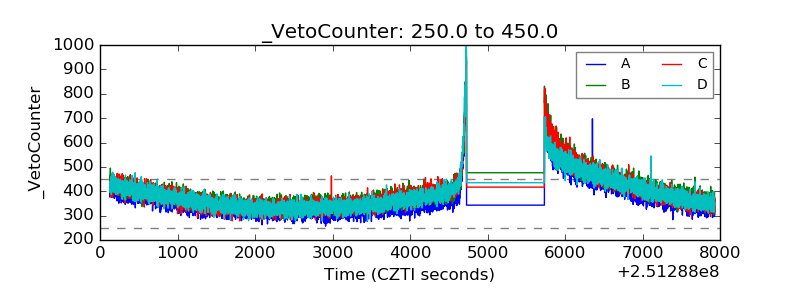 |