| Param | Original file | Final file |
|---|---|---|
| Filename | modeM0/AS1G08_024T01_9000001776cztM0_level2.fits | modeM0/AS1G08_024T01_9000001776cztM0_level2_quad_clean.evt |
| Size (bytes) | 315,616,320 | 323,763,840 |
| Size | 301.0 MB | 308.8 MB |
| Events in quadrant A | 1,919,682 | 2,011,888 |
| Events in quadrant B | 1,825,516 | 1,918,166 |
| Events in quadrant C | 1,942,618 | 1,887,119 |
| Events in quadrant D | 1,591,382 | 1,711,004 |
| Mode M0 | |||
|---|---|---|---|
| Quadrant | BADHDUFLAG | Total packets | Discarded packets |
| A | 0 | 75674 | 0 |
| B | 0 | 88496 | 0 |
| C | 0 | 69062 | 0 |
| D | 0 | 106542 | 0 |
| Mode M9 | |||
|---|---|---|---|
| Quadrant | BADHDUFLAG | Total packets | Discarded packets |
| A | 0 | 71 | 0 |
| B | 0 | 71 | 0 |
| C | 0 | 71 | 0 |
| D | 0 | 71 | 0 |
| Mode SS | |||
|---|---|---|---|
| Quadrant | BADHDUFLAG | Total packets | Discarded packets |
| A | 0 | 676 | 0 |
| B | 0 | 676 | 0 |
| C | 0 | 676 | 0 |
| D | 0 | 676 | 0 |
| Quadrant | Total seconds | Saturated seconds | Saturation percentage |
|---|---|---|---|
| A | 33140 | 778 | 2.347616% |
| B | 33140 | 2127 | 6.418226% |
| C | 33140 | 386 | 1.164756% |
| D | 33140 | 3728 | 11.249246% |
Noise dominated data is calculated using 1-second bins in cleaned event files. If a bin has >2000 counts, and if more than 50% of those come from <1% of pixels, then it is considered to be noise-dominated and hence unusable.
| Quadrant | # 1 sec bins | Bins with >0 counts | Bins with >2000 counts | High rate bins dominated by noise | Noise dominated (total time) | Noise dominated (detector-on time) | Marked lightcurve |
|---|---|---|---|---|---|---|---|
| A | 40200 | 33129 | 0 | 0 | 0.00% | 0.00% |  |
| B | 40200 | 33100 | 0 | 0 | 0.00% | 0.00% |  |
| C | 40200 | 33132 | 0 | 0 | 0.00% | 0.00% | 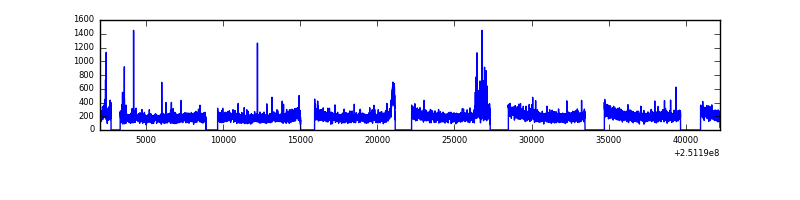 |
| D | 40200 | 33118 | 0 | 0 | 0.00% | 0.00% |  |
Top three noisy pixels from each quadrant. If the there are fewer than three noisy pixels in the level2.evt file, extra rows are filled as -1
| Pixel properties | Quadrant properties | ||||||
|---|---|---|---|---|---|---|---|
| Quadrant | DetID | PixID | Counts | Sigma | Mean | Median | Sigma |
| A | 0 | 29 | 1853 | 10.92 | 500 | 469 | 126.8 |
| A | 7 | 110 | 1557 | 8.58 | 500 | 469 | 126.8 |
| A | 9 | 19 | 1436 | 7.63 | 500 | 469 | 126.8 |
| B | 2 | 9 | 1582 | 11.73 | 482 | 460 | 95.6 |
| B | 12 | 226 | 1216 | 7.91 | 482 | 460 | 95.6 |
| B | 14 | 254 | 1212 | 7.86 | 482 | 460 | 95.6 |
| C | 1 | 80 | 1447 | 7.29 | 512 | 479 | 132.8 |
| C | 1 | 81 | 1441 | 7.24 | 512 | 479 | 132.8 |
| C | 12 | 241 | 1381 | 6.79 | 512 | 479 | 132.8 |
| D | 6 | 231 | 1163 | 6.07 | 454 | 413 | 123.6 |
| D | 3 | 14 | 1139 | 5.87 | 454 | 413 | 123.6 |
| D | 10 | 189 | 1133 | 5.82 | 454 | 413 | 123.6 |
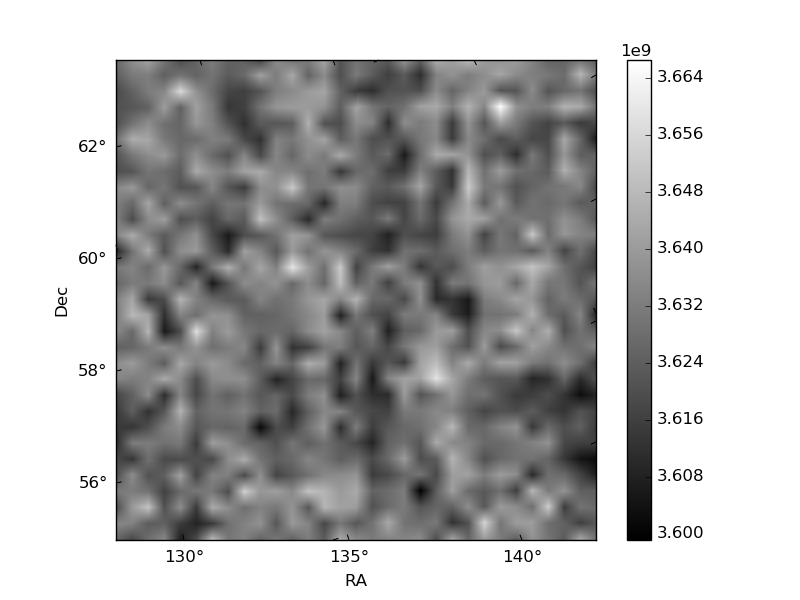
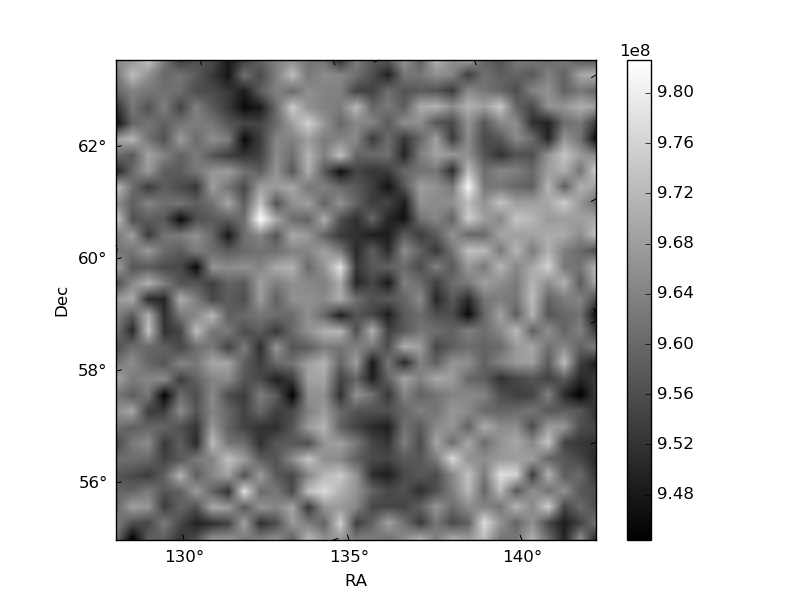
Histogram calculated using DETX and DETY for each event in the final _common_clean file
| Quadrant A | 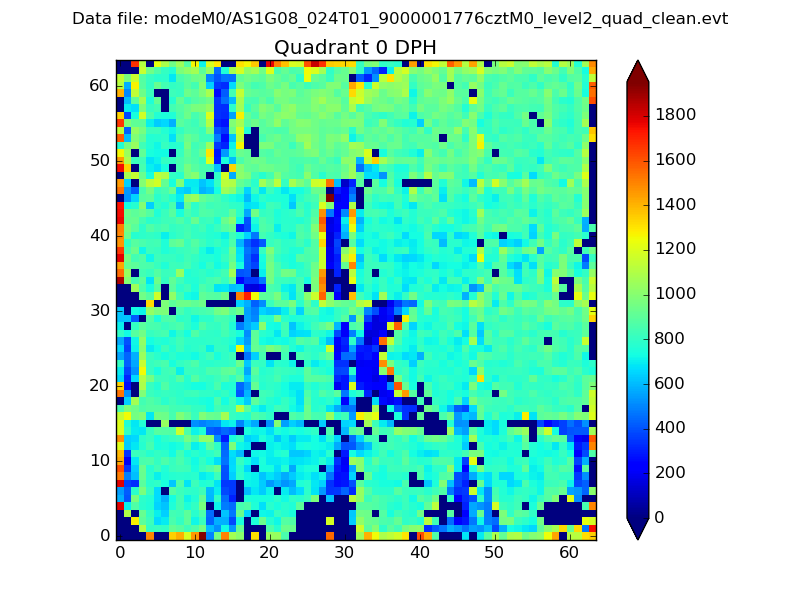 |
 |
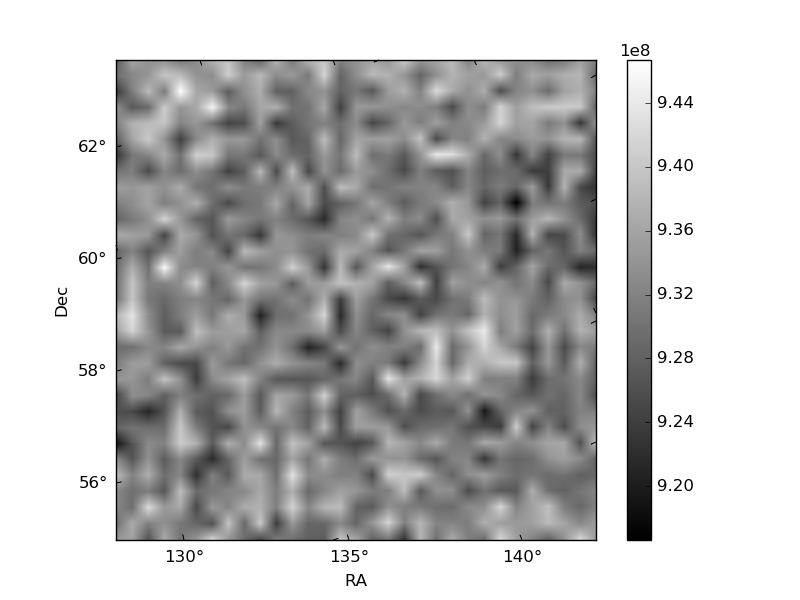
Quadrant B |
|---|---|---|---|
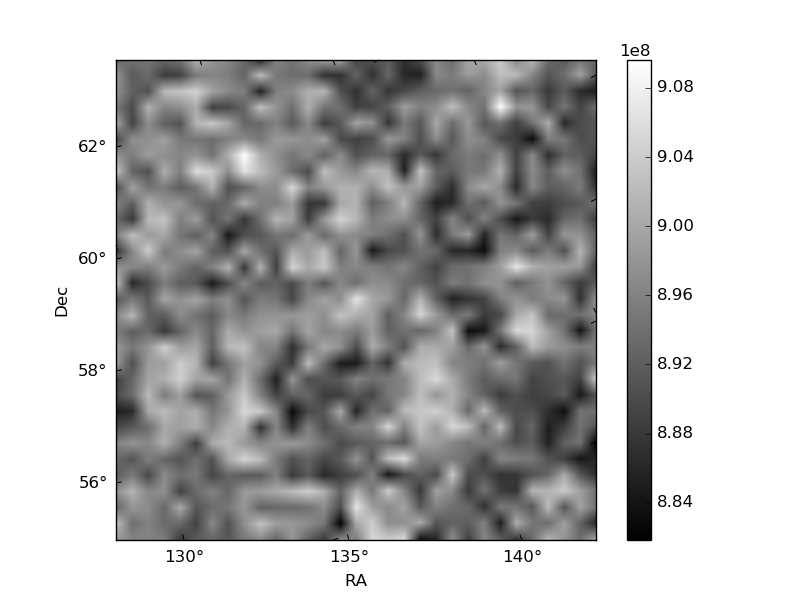
| Quadrant D | 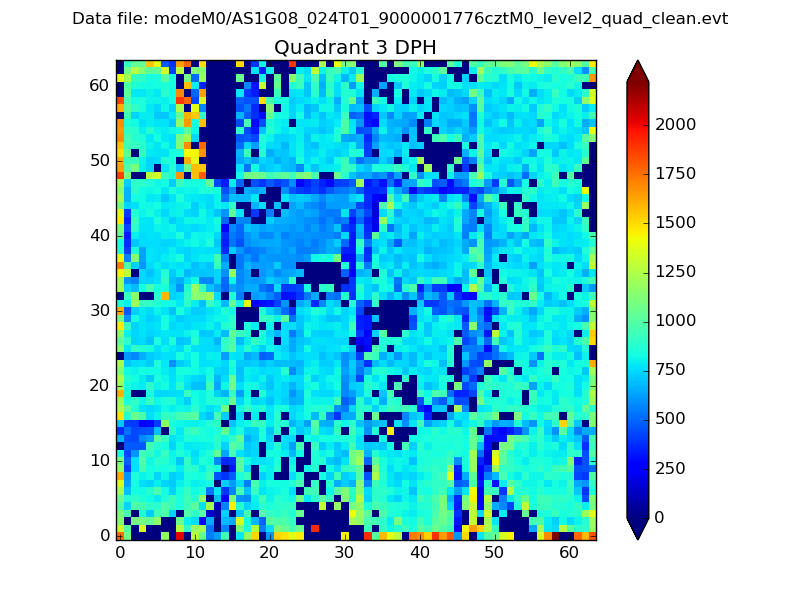 |
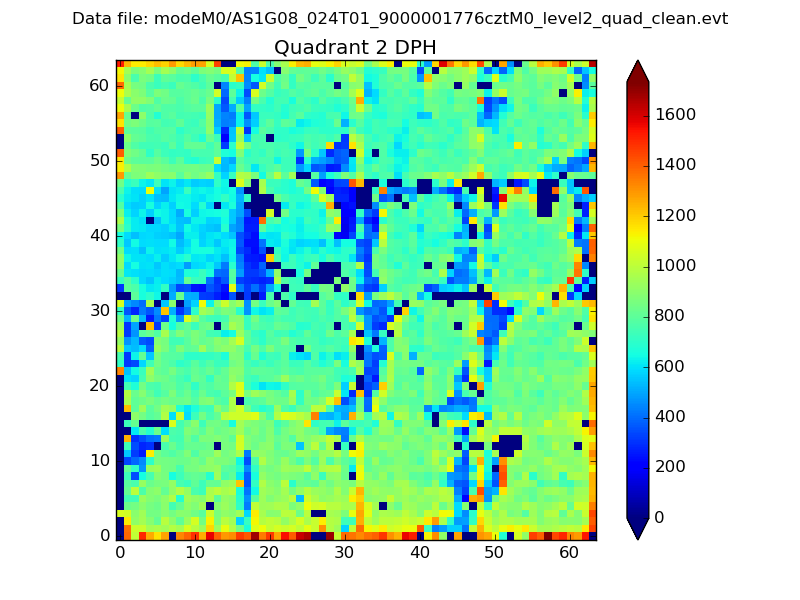 |
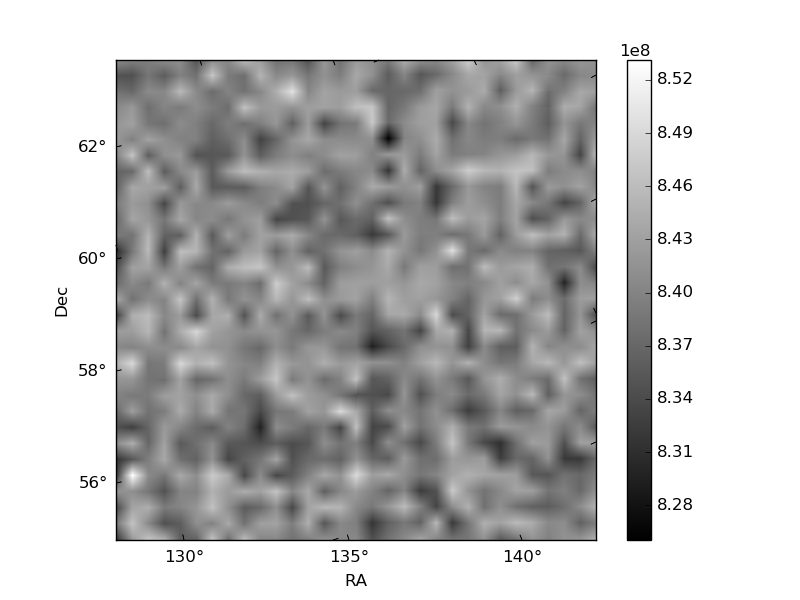
Quadrant C |
| Plot type | Count rate plots | Images |
|---|---|---|
| Comparison with Poisson distribution Blue bars denote a histogram of data divided into 1 sec bins. Red curve is a Poisson curve with rate = median count rate of data. |
 |
 |
| Quadrant-wise count rates Data is divided into 100 sec bins |
 |
|
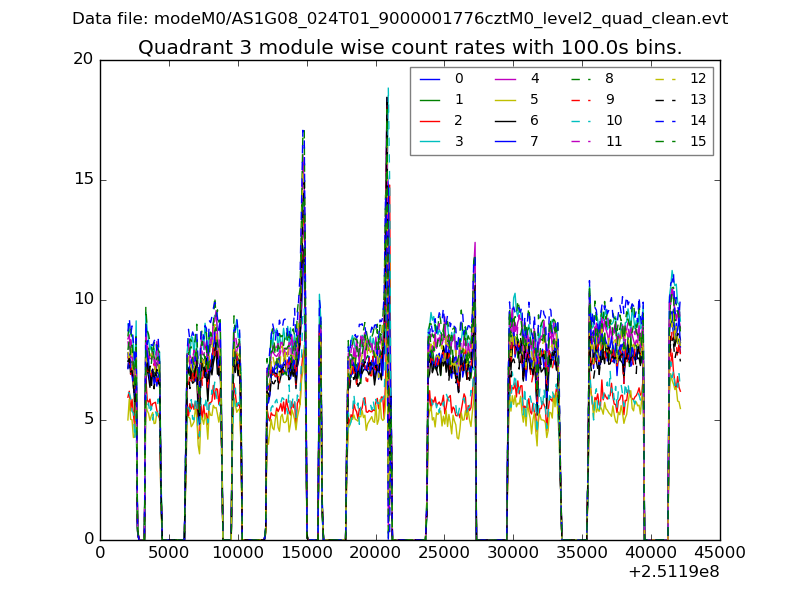
| Module-wise count rates for Quadrant A Data is divided into 100 sec bins |
 |
 |
| Module-wise count rates for Quadrant B Data is divided into 100 sec bins |
 |
 |
| Module-wise count rates for Quadrant C Data is divided into 100 sec bins |
 |
 |
| Module-wise count rates for Quadrant D Data is divided into 100 sec bins |
 |
 |
| Parameter | Plot |
|---|---|
| CZT HV Monitor |  |
| D_VDD |  |
| Temperature 1 |  |
| Veto HV Monitor |  |
| Veto LLD | 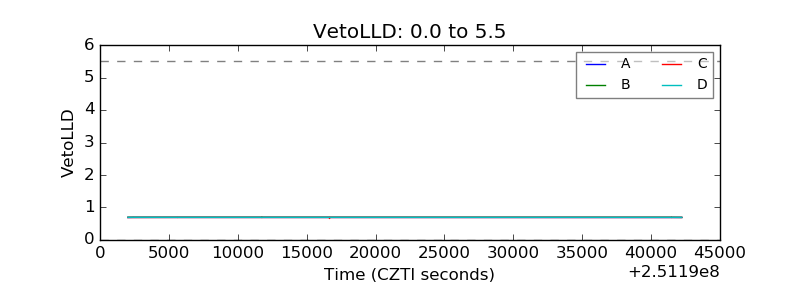 |
| Alpha Counter |  |
| _CPM_Rate |  |
| CZT Counter |  |
| +2.5 Volts monitor |  |
| +5 Volts monitor |  |
| _ROLL_ROT |  |
| _Roll_DEC |  |
| _Roll_RA |  |
| Veto Counter |  |