| Param | Original file | Final file |
|---|---|---|
| Filename | modeM0/AS1G08_024T01_9000001776_12008cztM0_level2.evt | modeM0/AS1G08_024T01_9000001776_12008cztM0_level2_quad_clean.evt |
| Size (bytes) | 1,119,280,320 | 163,586,880 |
| Size | 1.0 GB | 156.0 MB |
| Events in quadrant A | 6,840,479 | 1,042,024 |
| Events in quadrant B | 7,941,023 | 1,015,752 |
| Events in quadrant C | 5,899,452 | 1,018,515 |
| Events in quadrant D | 12,335,096 | 976,096 |
| Mode M0 | |||
|---|---|---|---|
| Quadrant | BADHDUFLAG | Total packets | Discarded packets |
| A | 0 | 28655 | 4 |
| B | 0 | 31891 | 3 |
| C | 0 | 26608 | 3 |
| D | 0 | 45347 | 3 |
| Mode M9 | |||
|---|---|---|---|
| Quadrant | BADHDUFLAG | Total packets | Discarded packets |
| A | 0 | 22 | 0 |
| B | 0 | 22 | 0 |
| C | 0 | 22 | 0 |
| D | 0 | 22 | 0 |
| Mode SS | |||
|---|---|---|---|
| Quadrant | BADHDUFLAG | Total packets | Discarded packets |
| A | 0 | 268 | 0 |
| B | 0 | 268 | 0 |
| C | 0 | 268 | 0 |
| D | 0 | 268 | 0 |
| Quadrant | Total seconds | Saturated seconds | Saturation percentage |
|---|---|---|---|
| A | 13045 | 269 | 2.062093% |
| B | 13045 | 553 | 4.239172% |
| C | 13045 | 169 | 1.295516% |
| D | 13045 | 2194 | 16.818704% |
Noise dominated data is calculated using 1-second bins in cleaned event files. If a bin has >2000 counts, and if more than 50% of those come from <1% of pixels, then it is considered to be noise-dominated and hence unusable.
| Quadrant | # 1 sec bins | Bins with >0 counts | Bins with >2000 counts | High rate bins dominated by noise | Noise dominated (total time) | Noise dominated (detector-on time) | Marked lightcurve |
|---|---|---|---|---|---|---|---|
| A | 15296 | 13046 | 7 | 7 | 0.05% | 0.05% | 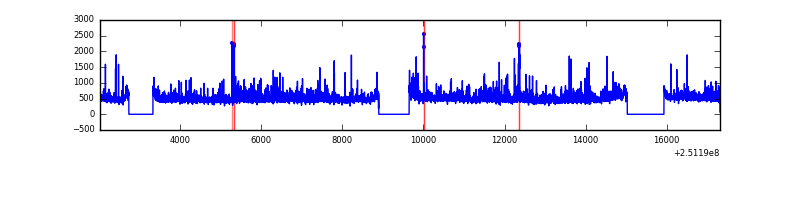 |
| B | 15296 | 13046 | 232 | 232 | 1.52% | 1.78% | 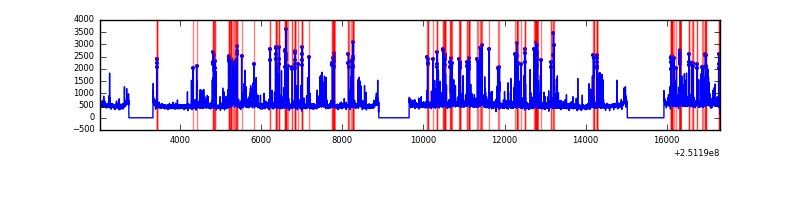 |
| C | 15296 | 13046 | 3 | 3 | 0.02% | 0.02% | 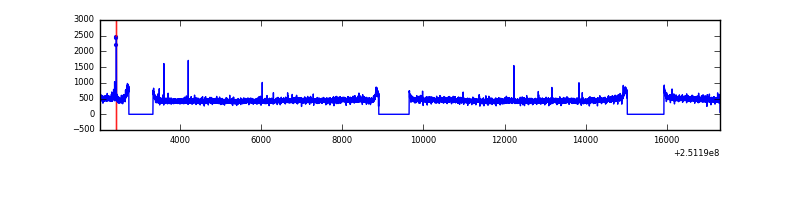 |
| D | 15296 | 13046 | 1962 | 1962 | 12.83% | 15.04% | 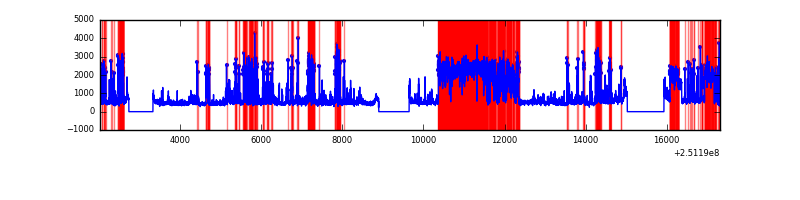 |
Top three noisy pixels from each quadrant. If the there are fewer than three noisy pixels in the level2.evt file, extra rows are filled as -1
| Pixel properties | Quadrant properties | ||||||
|---|---|---|---|---|---|---|---|
| Quadrant | DetID | PixID | Counts | Sigma | Mean | Median | Sigma |
| A | 4 | 2 | 247491 | 778.85 | 1553 | 1520 | 315.8 |
| A | 1 | 162 | 230617 | 725.42 | 1553 | 1520 | 315.8 |
| A | 1 | 178 | 122996 | 384.65 | 1553 | 1520 | 315.8 |
| B | 4 | 239 | 1248497 | 4253.7 | 1529 | 1491 | 293.2 |
| B | 10 | 245 | 204010 | 690.82 | 1529 | 1491 | 293.2 |
| B | 11 | 51 | 190760 | 645.62 | 1529 | 1491 | 293.2 |
| C | 7 | 247 | 50759 | 143.09 | 1493 | 1498 | 344.3 |
| C | 14 | 234 | 18852 | 50.41 | 1493 | 1498 | 344.3 |
| C | 13 | 61 | 10733 | 26.83 | 1493 | 1498 | 344.3 |
| D | 1 | 52 | 5903655 | 17190.49 | 1428 | 1384 | 343.3 |
| D | 8 | 195 | 288792 | 837.08 | 1428 | 1384 | 343.3 |
| D | 14 | 34 | 176703 | 510.62 | 1428 | 1384 | 343.3 |
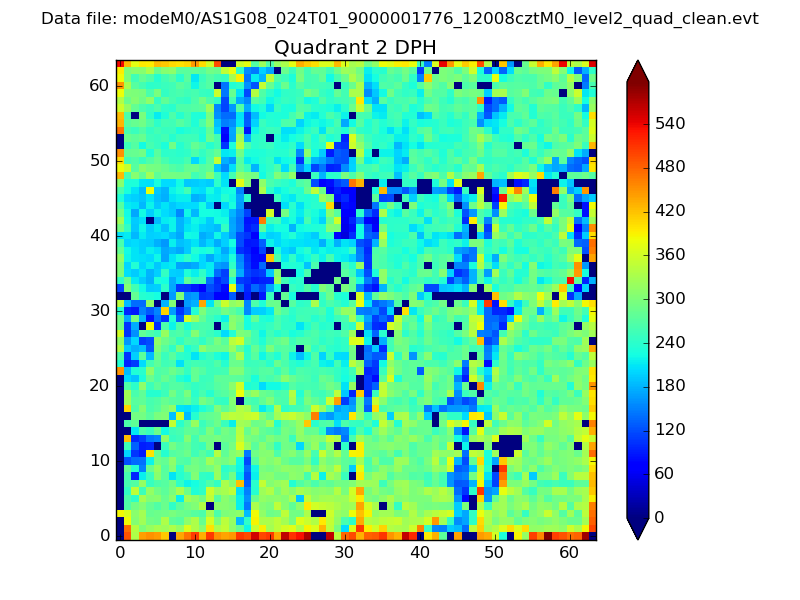
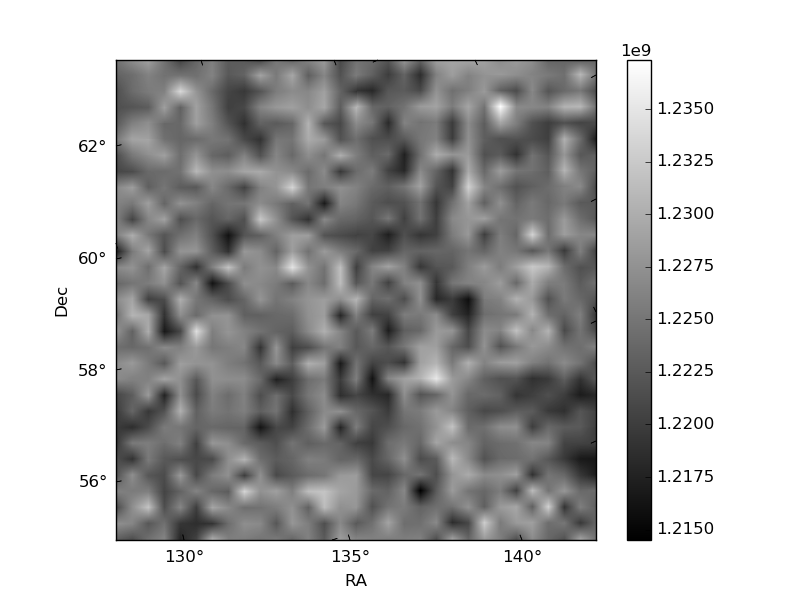
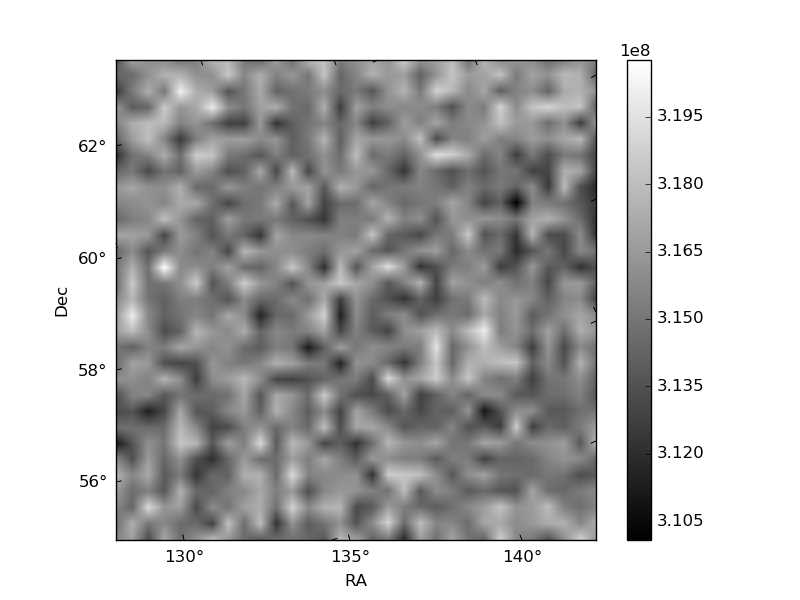
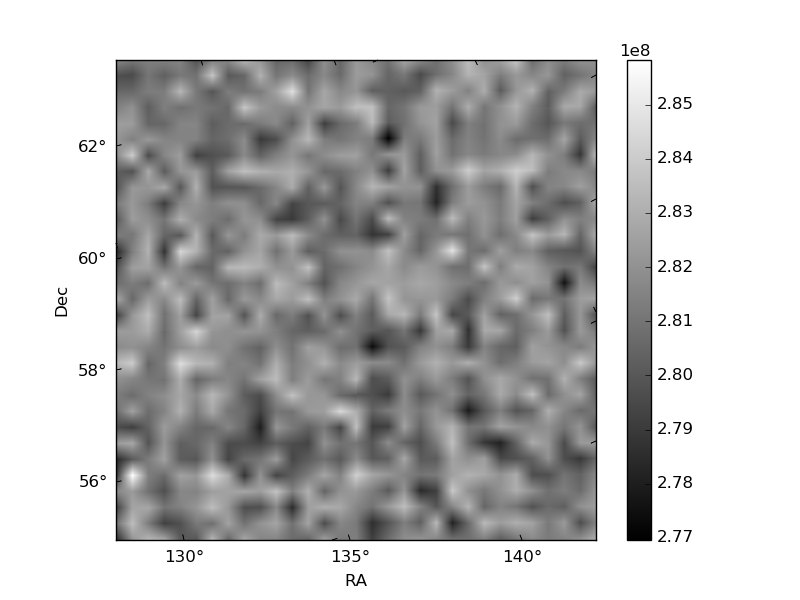
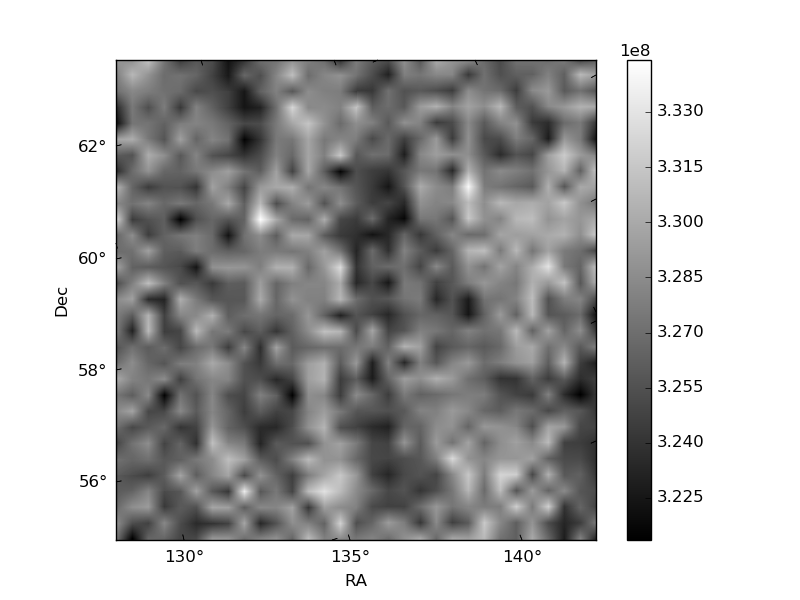
Histogram calculated using DETX and DETY for each event in the final _common_clean file
| Quadrant A | 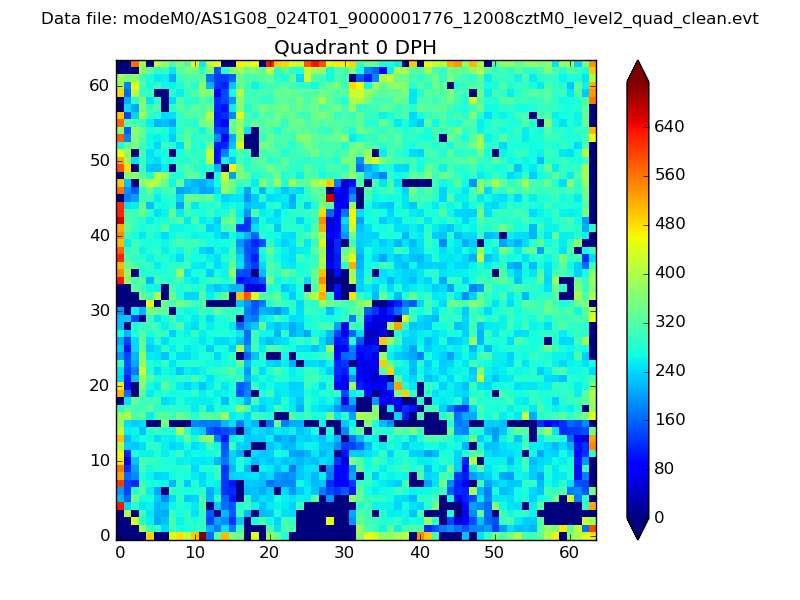 |
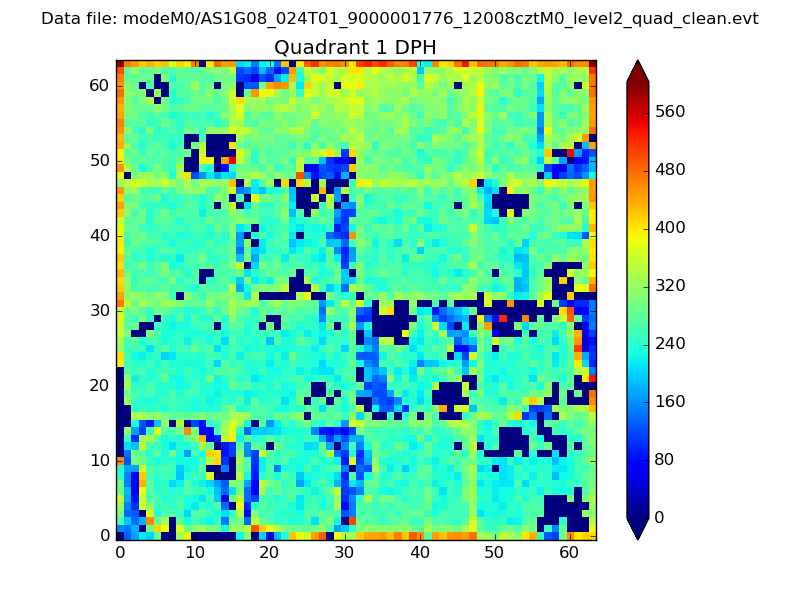 |
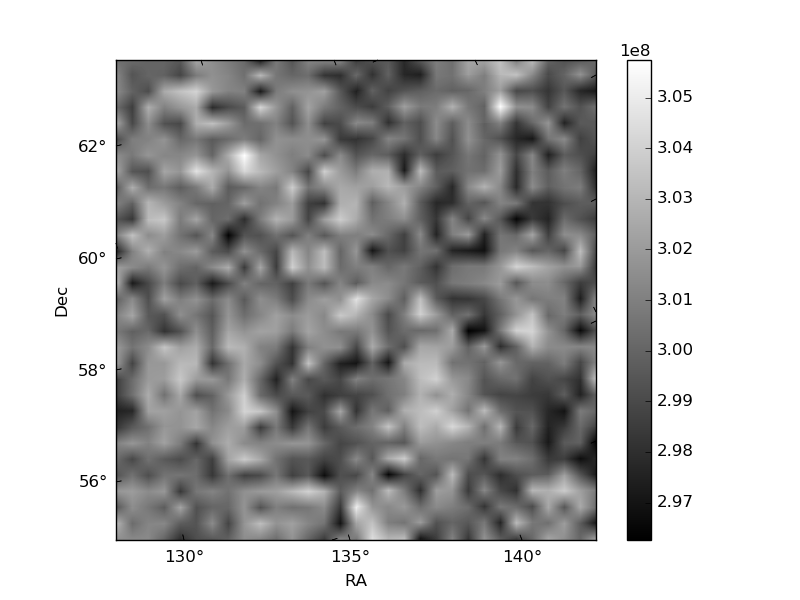
Quadrant B |
|---|---|---|---|
| Quadrant D | 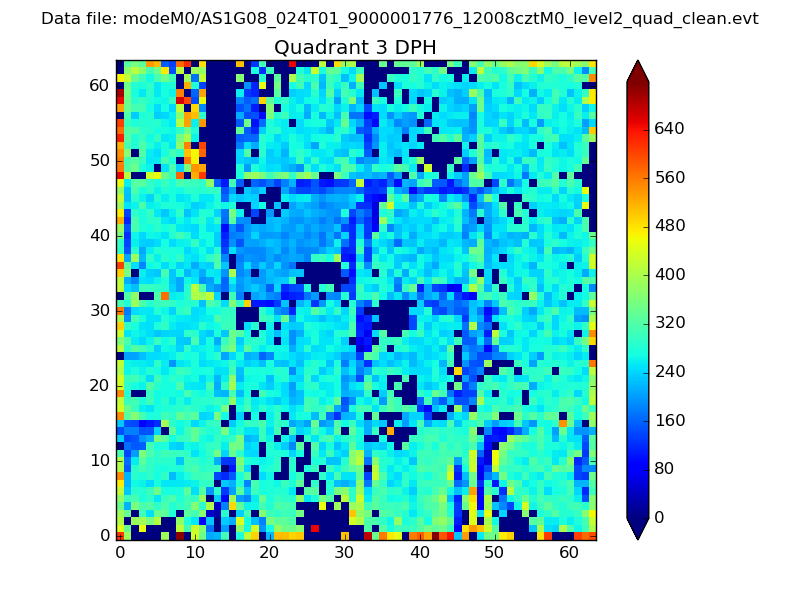 |
 |
Quadrant C |
| Plot type | Count rate plots | Images |
|---|---|---|
| Comparison with Poisson distribution Blue bars denote a histogram of data divided into 1 sec bins. Red curve is a Poisson curve with rate = median count rate of data. |
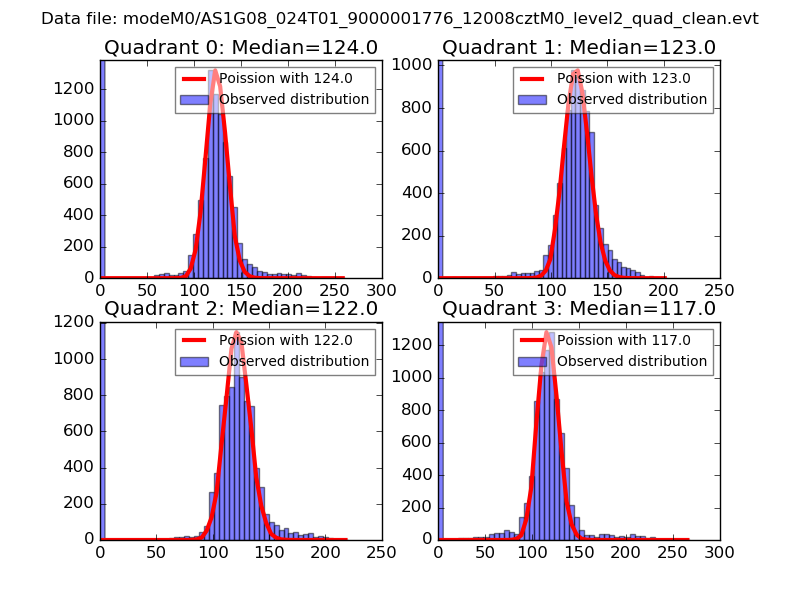 |
 |
| Quadrant-wise count rates Data is divided into 100 sec bins |
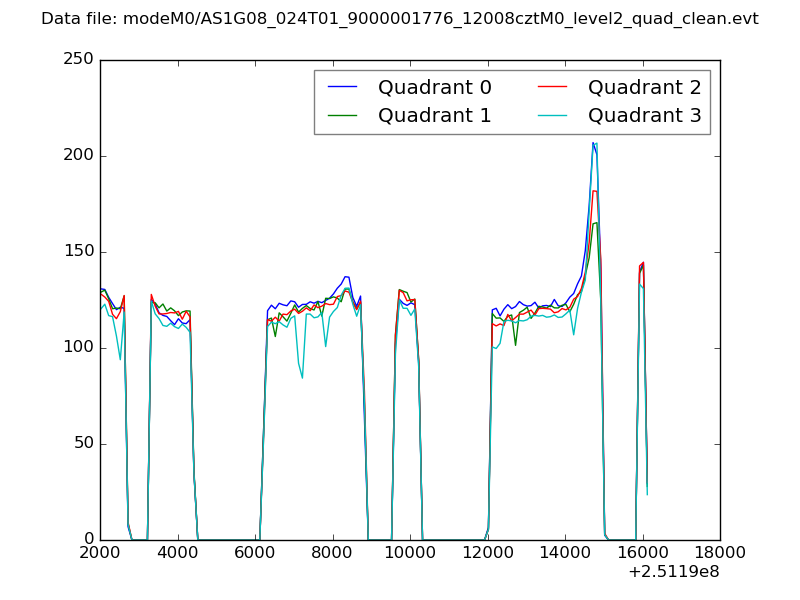 |
|
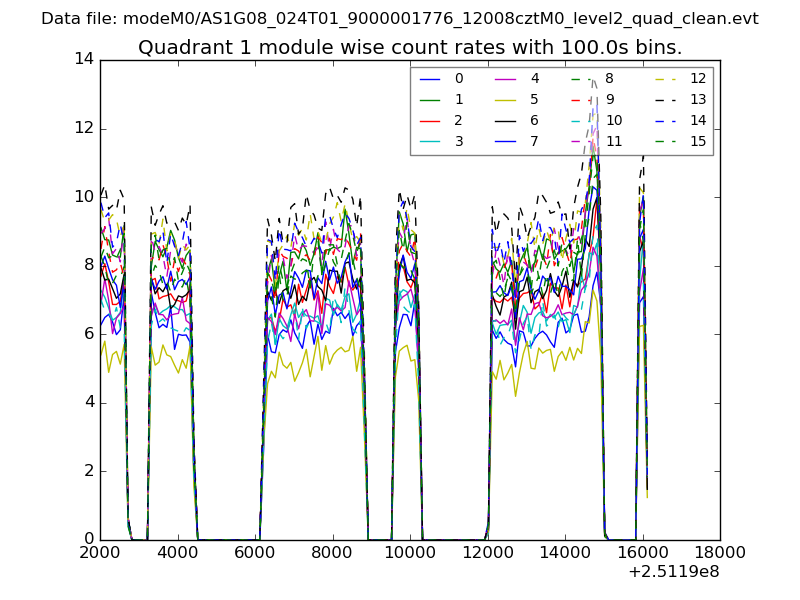
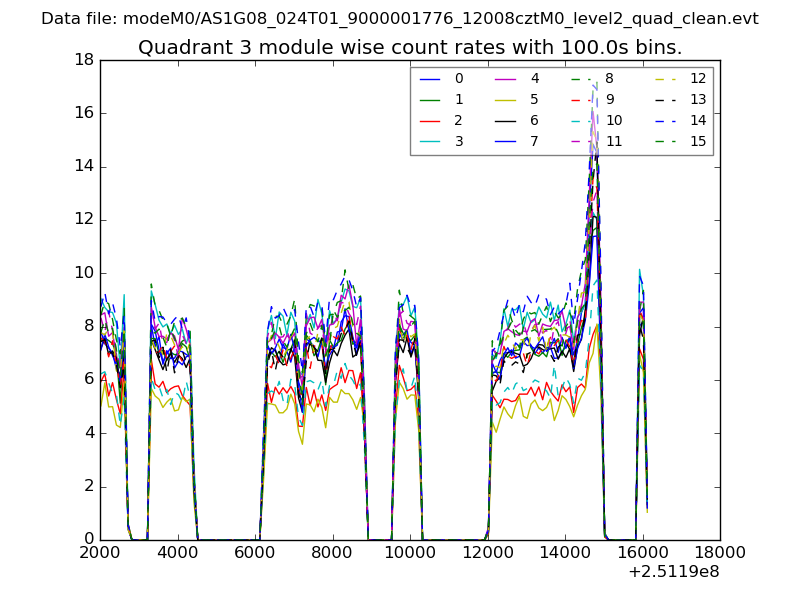
| Module-wise count rates for Quadrant A Data is divided into 100 sec bins |
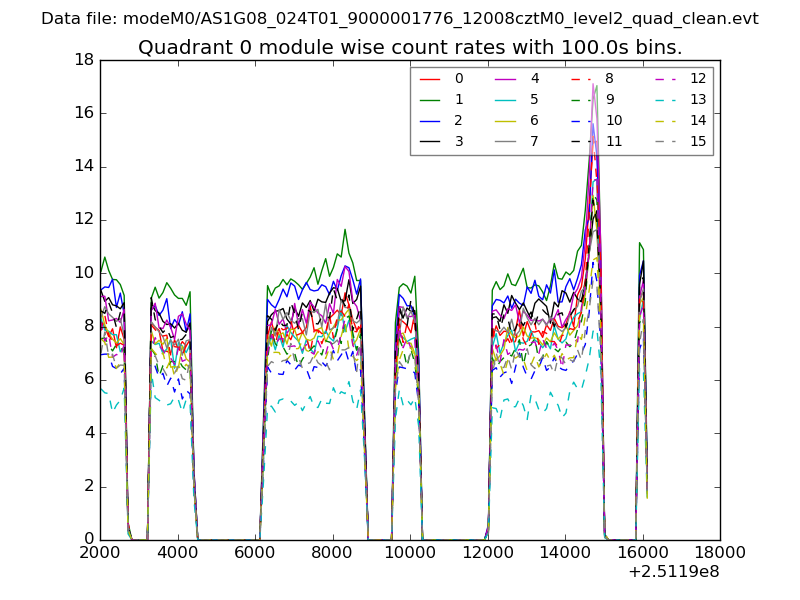 |
 |
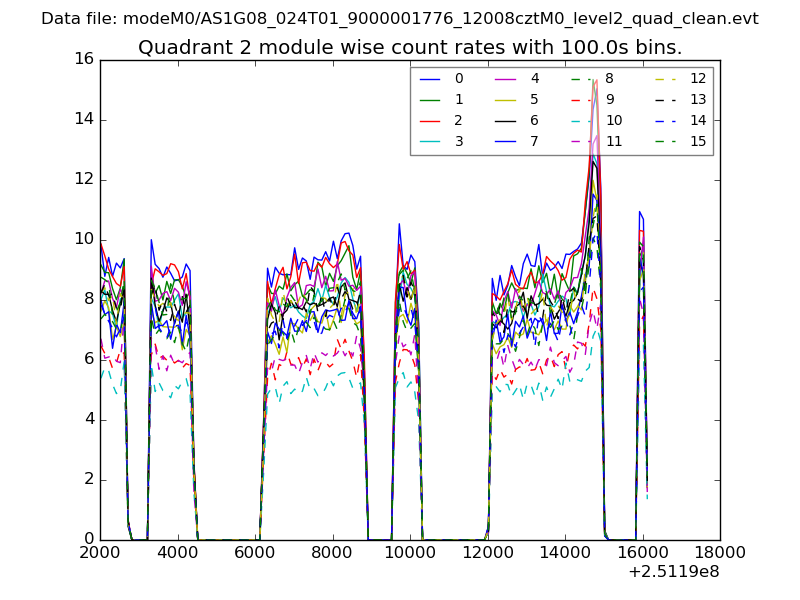
| Module-wise count rates for Quadrant B Data is divided into 100 sec bins |
 |
 |
| Module-wise count rates for Quadrant C Data is divided into 100 sec bins |
 |
 |
| Module-wise count rates for Quadrant D Data is divided into 100 sec bins |
 |
 |
| Parameter | Plot |
|---|---|
| CZT HV Monitor | 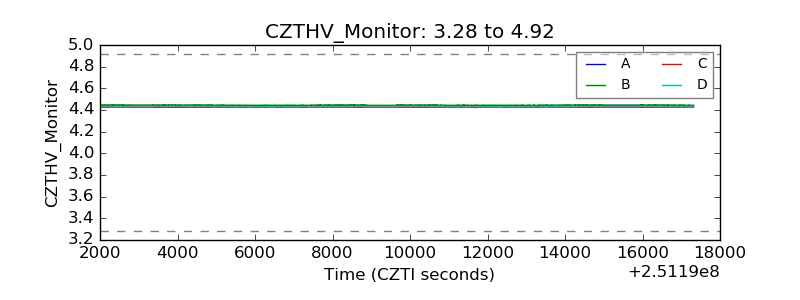 |
| D_VDD | 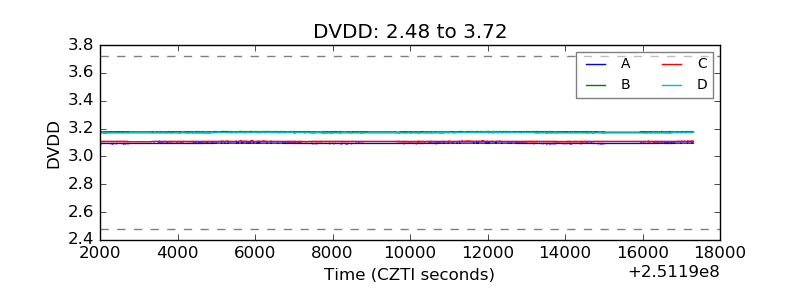 |
| Temperature 1 |  |
| Veto HV Monitor | 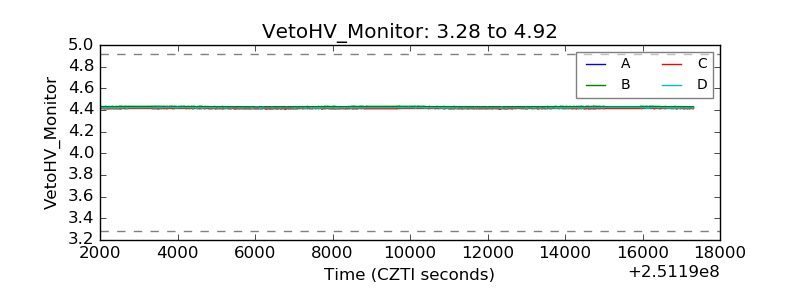 |
| Veto LLD | 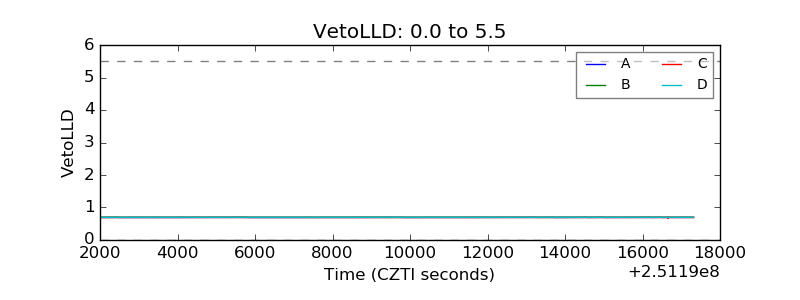 |
| Alpha Counter | 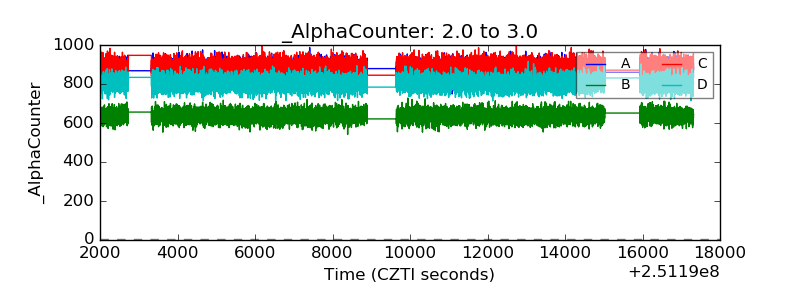 |
| _CPM_Rate | 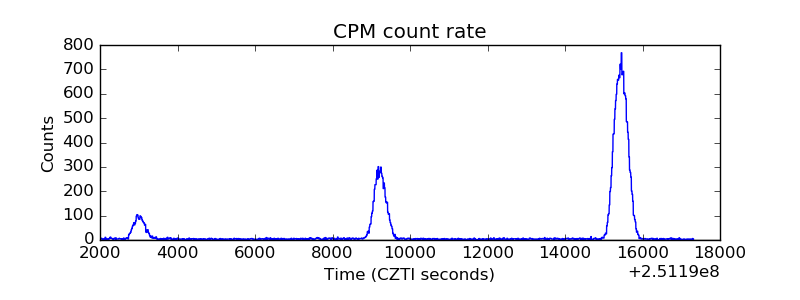 |
| CZT Counter | 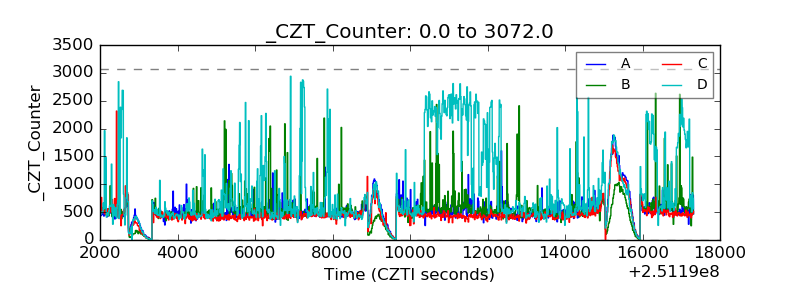 |
| +2.5 Volts monitor |  |
| +5 Volts monitor |  |
| _ROLL_ROT | 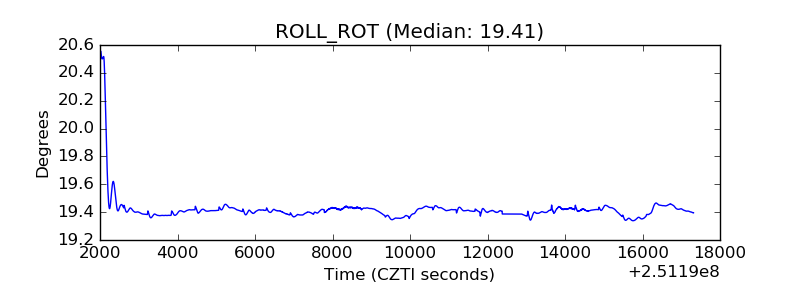 |
| _Roll_DEC | 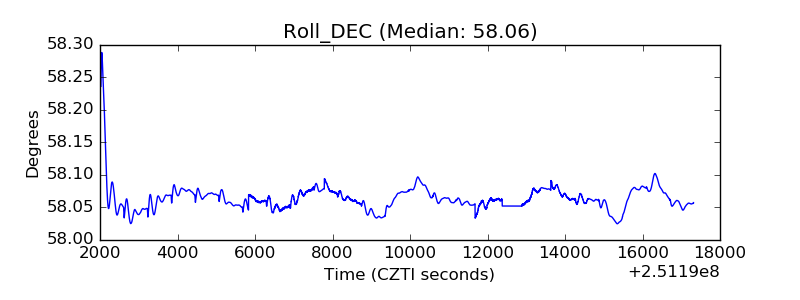 |
| _Roll_RA | 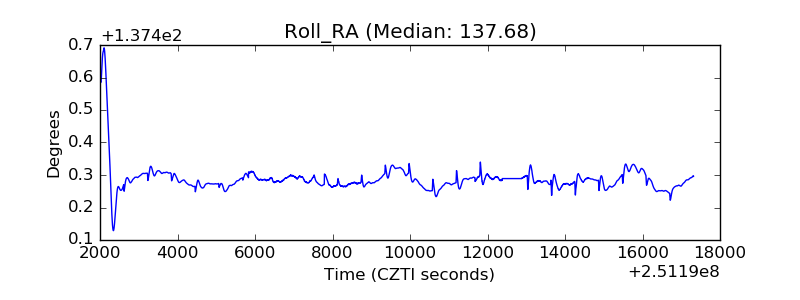 |
| Veto Counter | 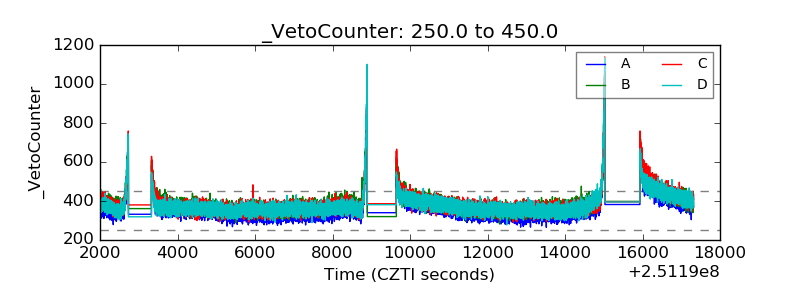 |