| Param | Original file | Final file |
|---|---|---|
| Filename | modeM0/AS1G08_024T01_9000001776_12011cztM0_level2.evt | modeM0/AS1G08_024T01_9000001776_12011cztM0_level2_quad_clean.evt |
| Size (bytes) | 579,263,040 | 77,330,880 |
| Size | 552.4 MB | 73.7 MB |
| Events in quadrant A | 3,629,890 | 488,974 |
| Events in quadrant B | 4,729,617 | 472,767 |
| Events in quadrant C | 3,228,396 | 478,016 |
| Events in quadrant D | 5,517,558 | 451,079 |
| Mode M0 | |||
|---|---|---|---|
| Quadrant | BADHDUFLAG | Total packets | Discarded packets |
| A | 0 | 15199 | 3 |
| B | 0 | 18454 | 2 |
| C | 0 | 13833 | 2 |
| D | 0 | 20827 | 2 |
| Mode M9 | |||
|---|---|---|---|
| Quadrant | BADHDUFLAG | Total packets | Discarded packets |
| A | 0 | 20 | 0 |
| B | 0 | 20 | 0 |
| C | 0 | 20 | 0 |
| D | 0 | 21 | 0 |
| Mode SS | |||
|---|---|---|---|
| Quadrant | BADHDUFLAG | Total packets | Discarded packets |
| A | 0 | 130 | 0 |
| B | 0 | 130 | 0 |
| C | 0 | 130 | 0 |
| D | 0 | 130 | 0 |
| Quadrant | Total seconds | Saturated seconds | Saturation percentage |
|---|---|---|---|
| A | 6463 | 131 | 2.026922% |
| B | 6463 | 415 | 6.421167% |
| C | 6463 | 58 | 0.897416% |
| D | 6463 | 593 | 9.175306% |
Noise dominated data is calculated using 1-second bins in cleaned event files. If a bin has >2000 counts, and if more than 50% of those come from <1% of pixels, then it is considered to be noise-dominated and hence unusable.
| Quadrant | # 1 sec bins | Bins with >0 counts | Bins with >2000 counts | High rate bins dominated by noise | Noise dominated (total time) | Noise dominated (detector-on time) | Marked lightcurve |
|---|---|---|---|---|---|---|---|
| A | 7649 | 6464 | 19 | 19 | 0.25% | 0.29% | 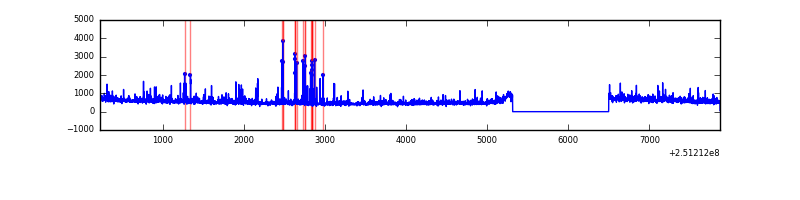 |
| B | 7649 | 6464 | 205 | 205 | 2.68% | 3.17% | 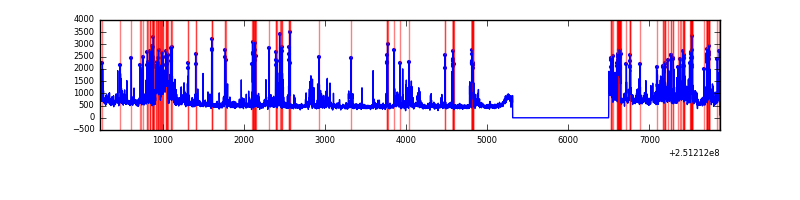 |
| C | 7649 | 6464 | 0 | 0 | 0.00% | 0.00% | 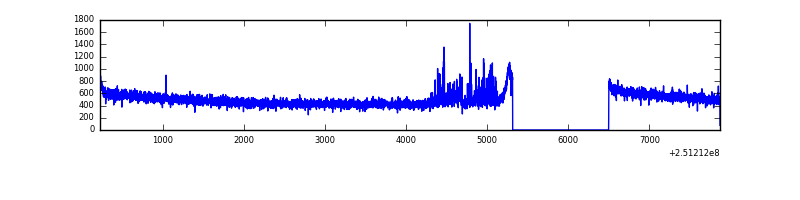 |
| D | 7648 | 6463 | 471 | 471 | 6.16% | 7.29% | 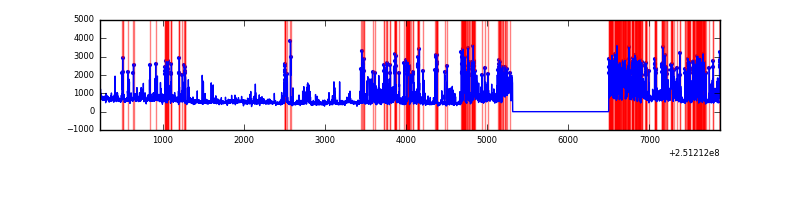 |
Top three noisy pixels from each quadrant. If the there are fewer than three noisy pixels in the level2.evt file, extra rows are filled as -1
| Pixel properties | Quadrant properties | ||||||
|---|---|---|---|---|---|---|---|
| Quadrant | DetID | PixID | Counts | Sigma | Mean | Median | Sigma |
| A | 1 | 162 | 146926 | 876.48 | 826 | 812 | 166.7 |
| A | 1 | 178 | 75945 | 450.7 | 826 | 812 | 166.7 |
| A | 1 | 161 | 66647 | 394.92 | 826 | 812 | 166.7 |
| B | 4 | 239 | 785655 | 5175.64 | 811 | 794 | 151.6 |
| B | 10 | 245 | 357386 | 2351.49 | 811 | 794 | 151.6 |
| B | 15 | 204 | 134380 | 880.91 | 811 | 794 | 151.6 |
| C | 13 | 250 | 88397 | 475.0 | 805 | 809 | 184.4 |
| C | 13 | 61 | 5982 | 28.05 | 805 | 809 | 184.4 |
| C | 12 | 4 | 2152 | 7.28 | 805 | 809 | 184.4 |
| D | 1 | 52 | 1501588 | 8094.18 | 773 | 752 | 185.4 |
| D | 4 | 95 | 400695 | 2156.94 | 773 | 752 | 185.4 |
| D | 8 | 195 | 163443 | 877.41 | 773 | 752 | 185.4 |
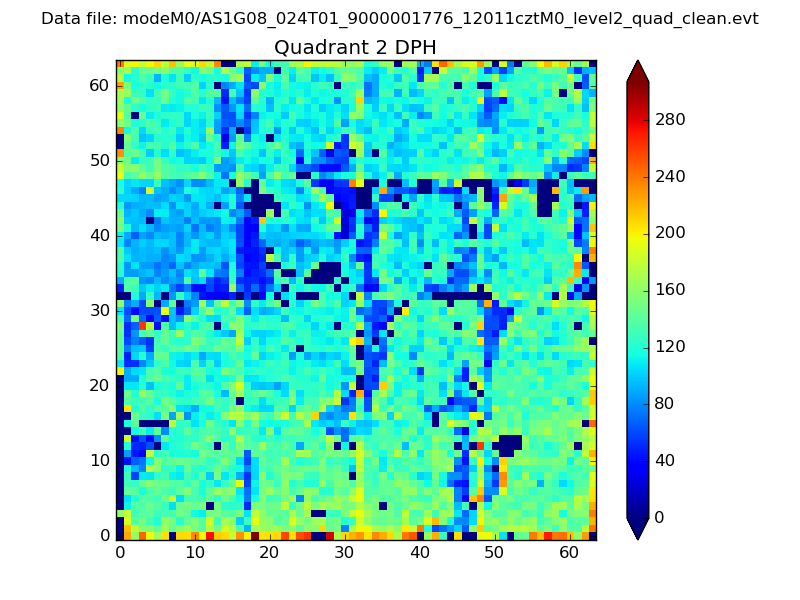
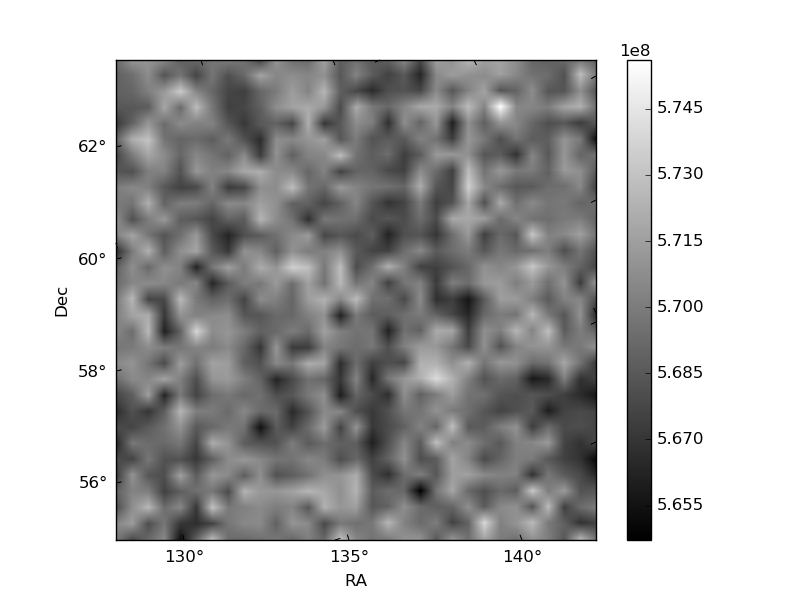
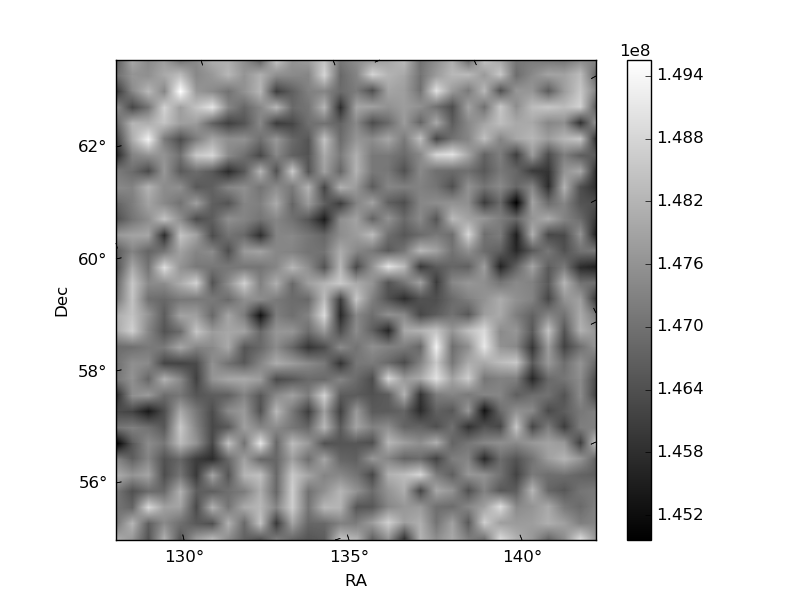
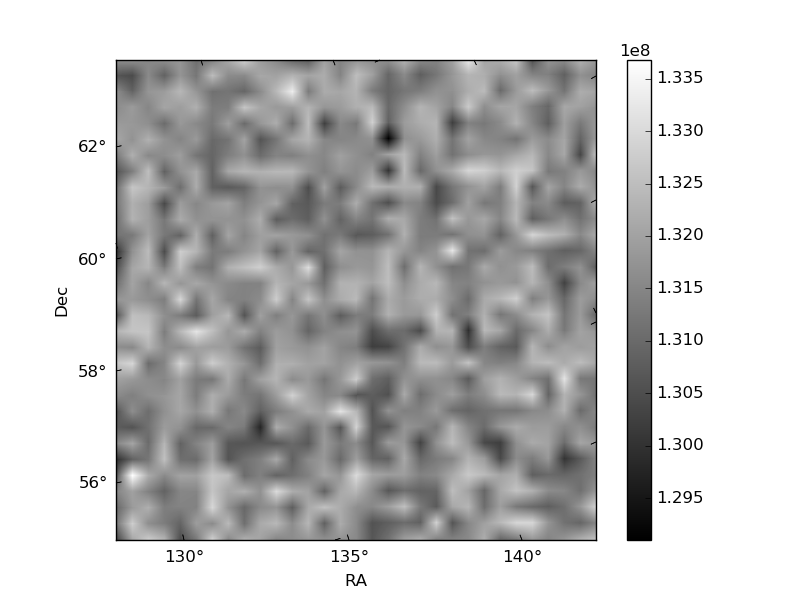
Histogram calculated using DETX and DETY for each event in the final _common_clean file
| Quadrant A | 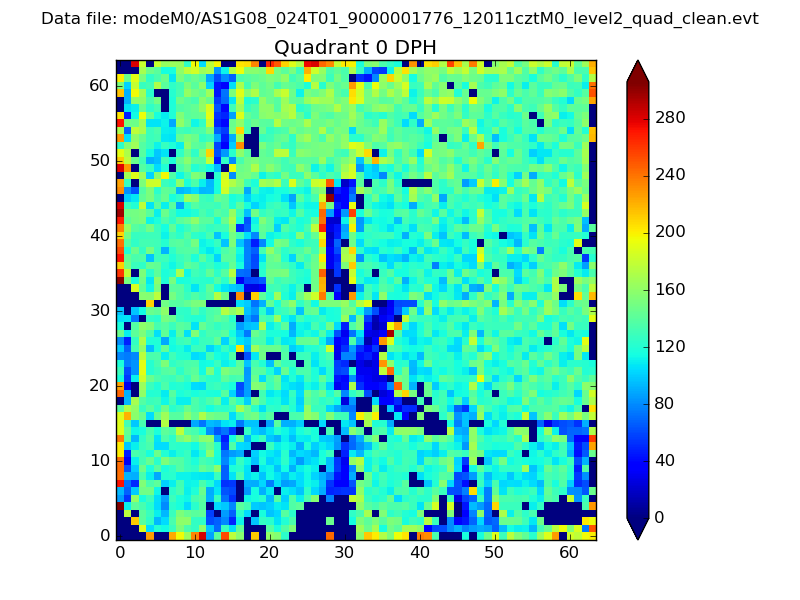 |
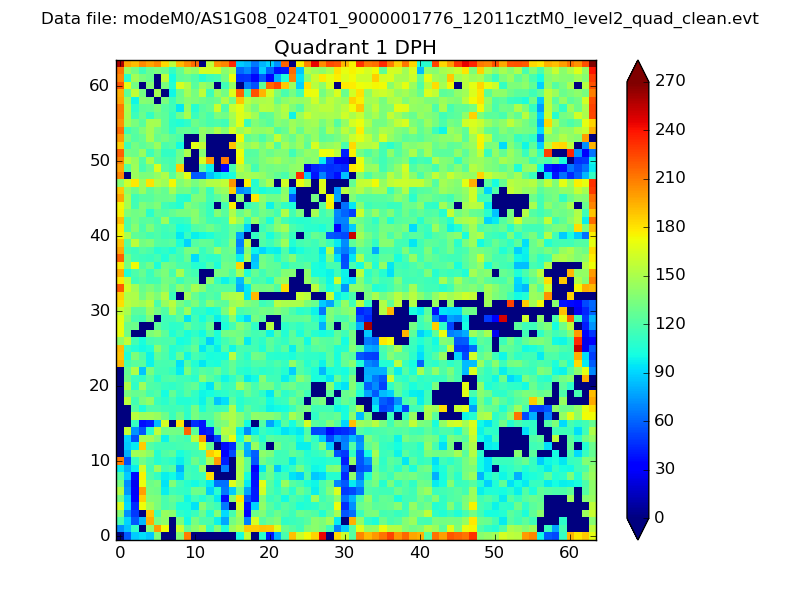 |
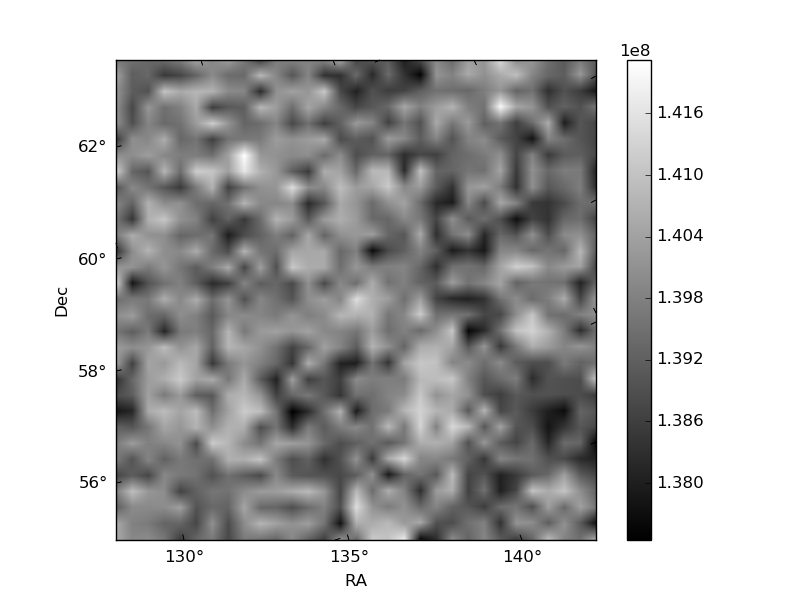
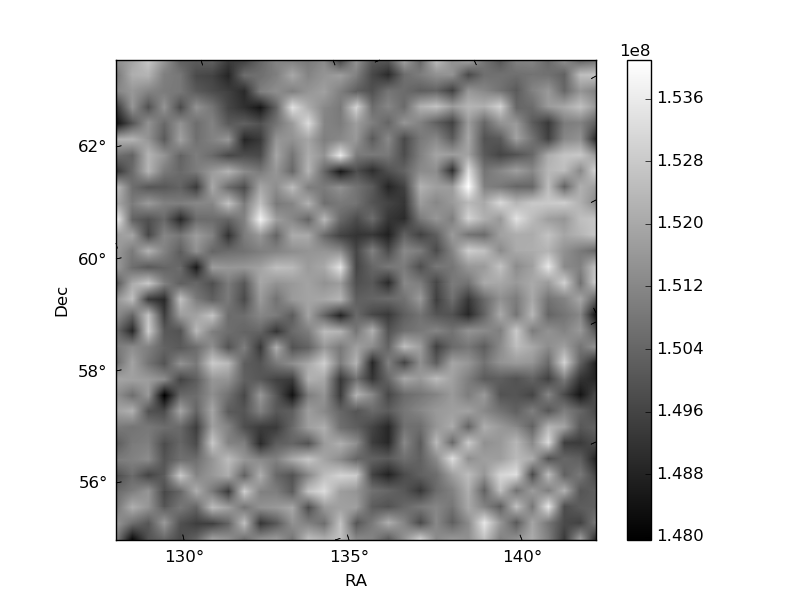
Quadrant B |
|---|---|---|---|
| Quadrant D | 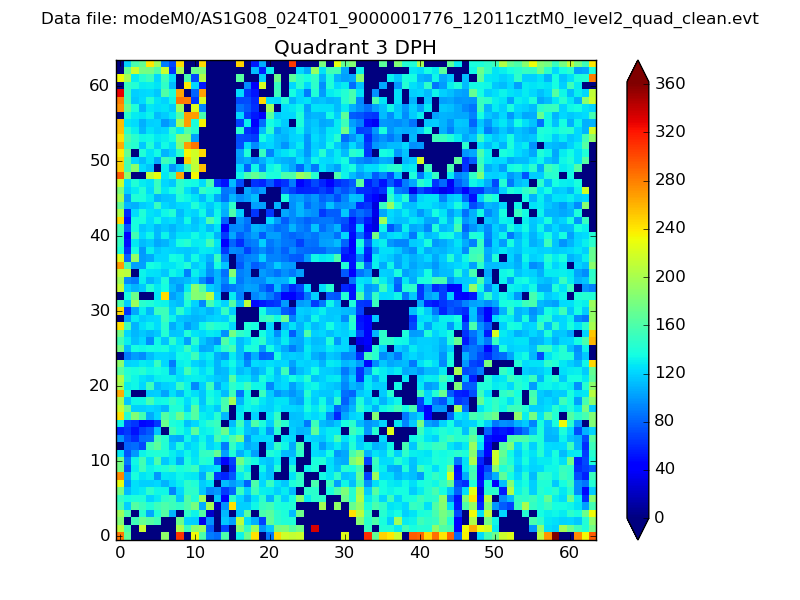 |
 |
Quadrant C |
| Plot type | Count rate plots | Images |
|---|---|---|
| Comparison with Poisson distribution Blue bars denote a histogram of data divided into 1 sec bins. Red curve is a Poisson curve with rate = median count rate of data. |
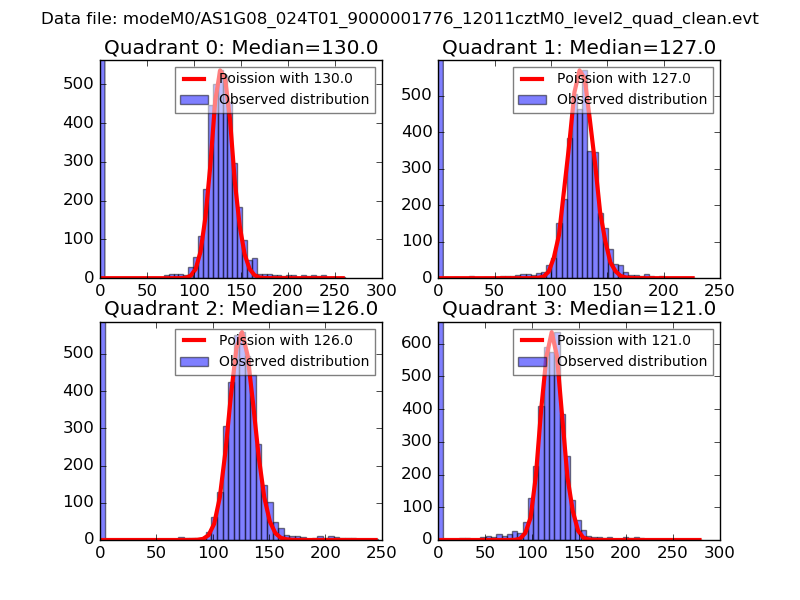 |
 |
| Quadrant-wise count rates Data is divided into 100 sec bins |
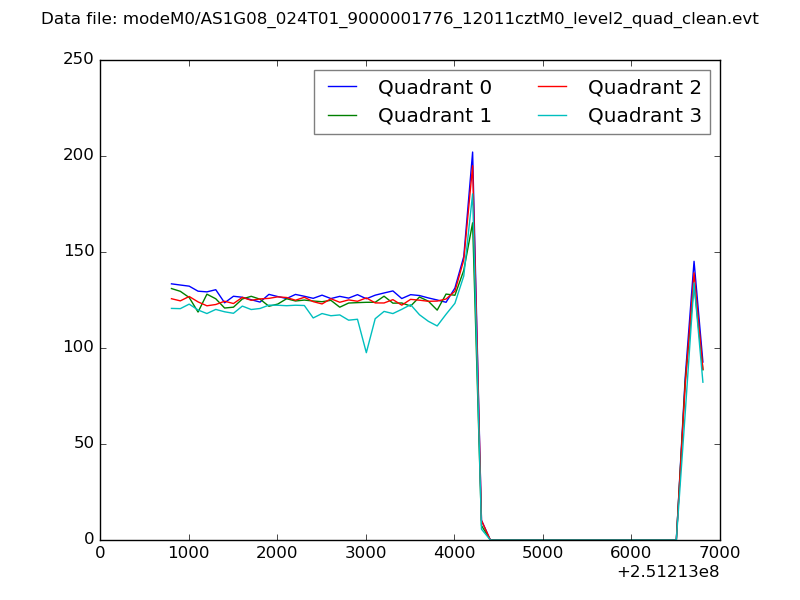 |
|
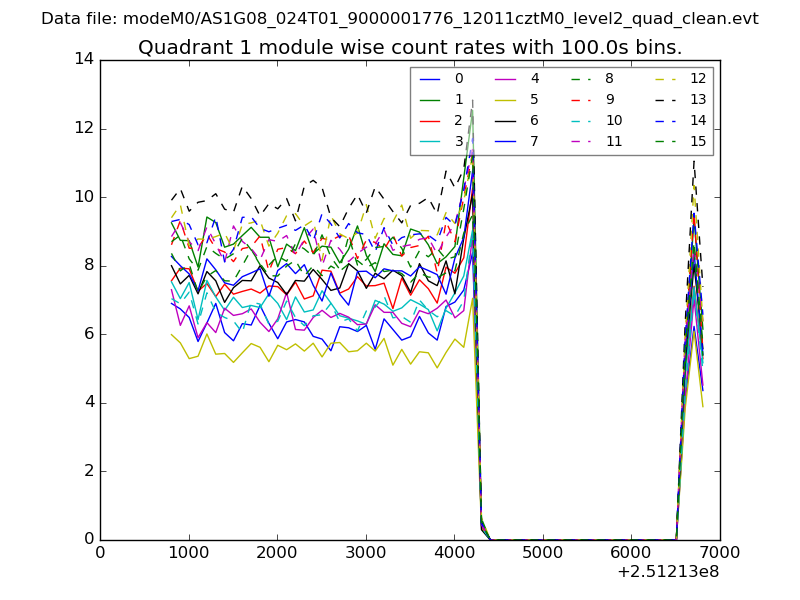
| Module-wise count rates for Quadrant A Data is divided into 100 sec bins |
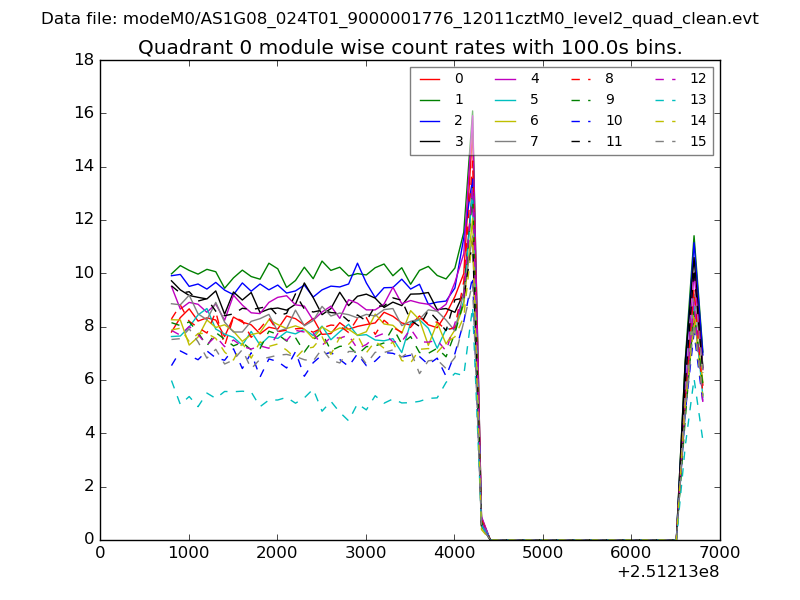 |
 |
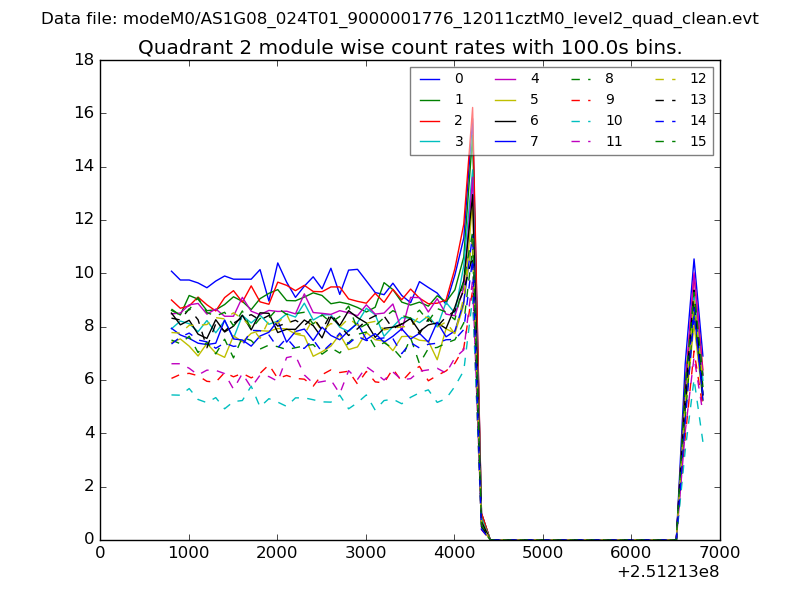
| Module-wise count rates for Quadrant B Data is divided into 100 sec bins |
 |
 |
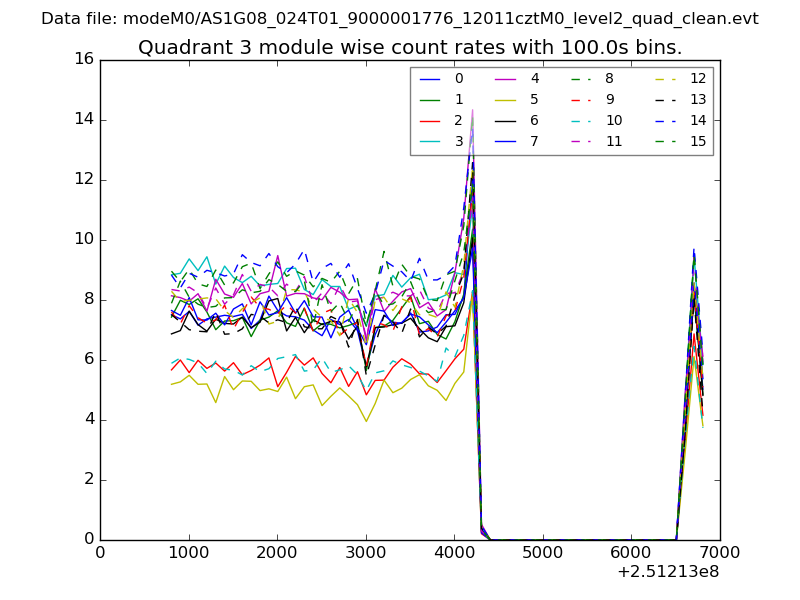
| Module-wise count rates for Quadrant C Data is divided into 100 sec bins |
 |
 |
| Module-wise count rates for Quadrant D Data is divided into 100 sec bins |
 |
 |
| Parameter | Plot |
|---|---|
| CZT HV Monitor | 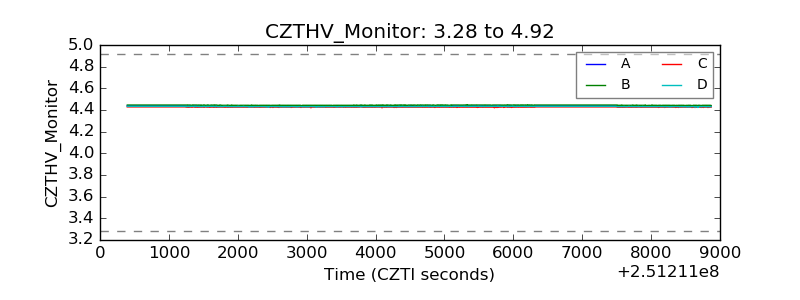 |
| D_VDD | 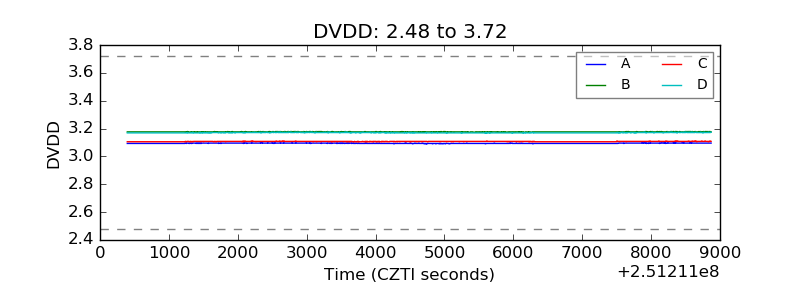 |
| Temperature 1 | 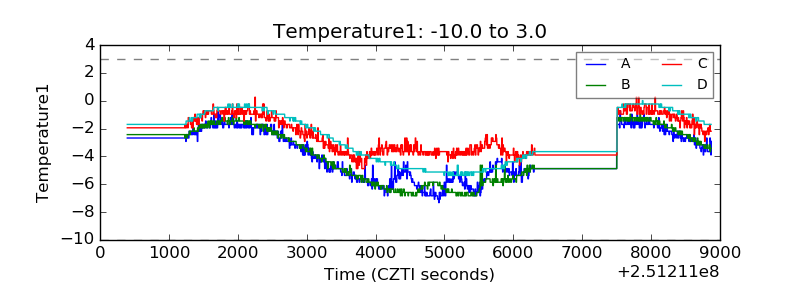 |
| Veto HV Monitor | 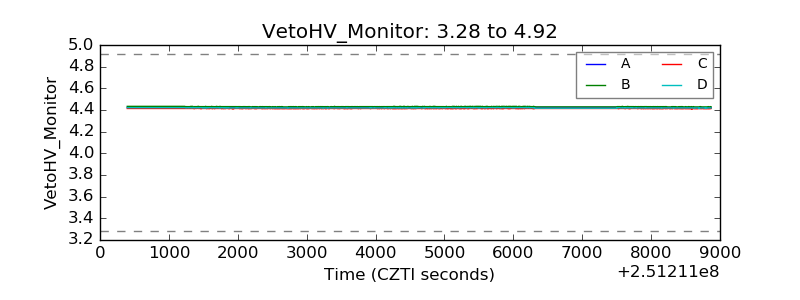 |
| Veto LLD |  |
| Alpha Counter | 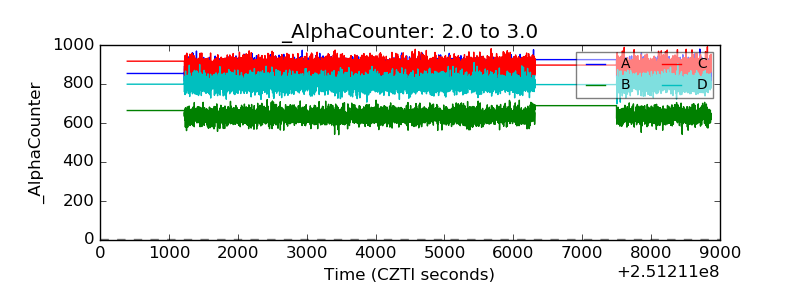 |
| _CPM_Rate | 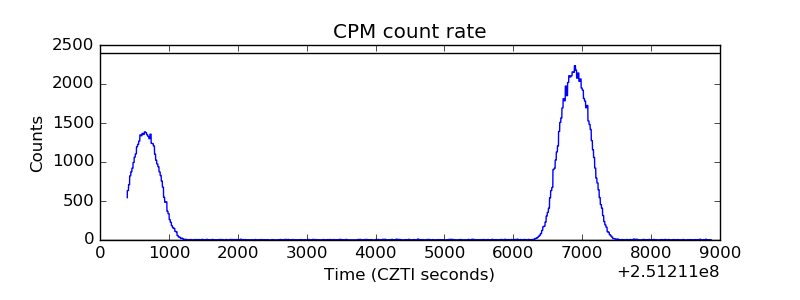 |
| CZT Counter | 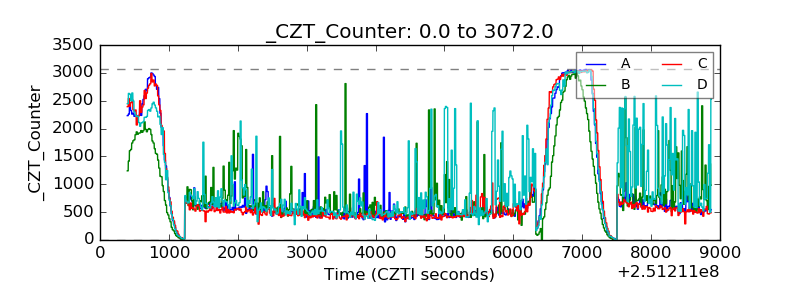 |
| +2.5 Volts monitor |  |
| +5 Volts monitor |  |
| _ROLL_ROT | 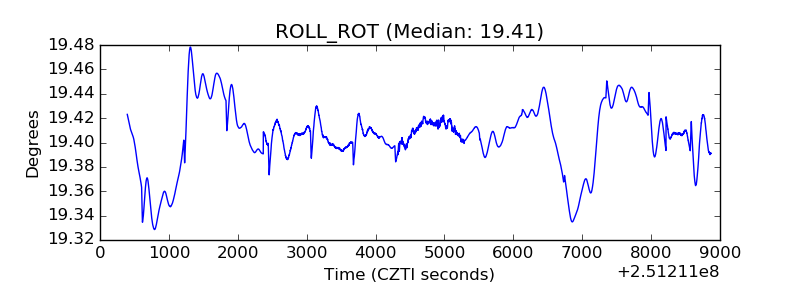 |
| _Roll_DEC | 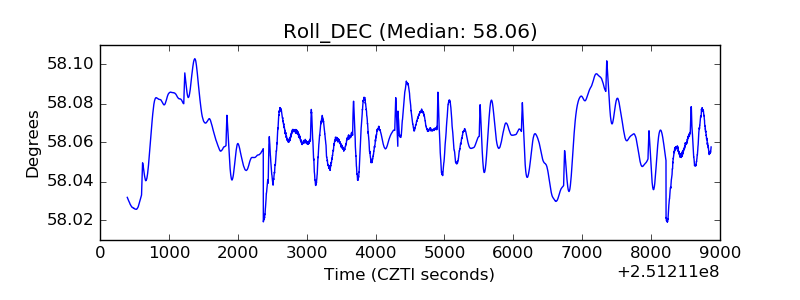 |
| _Roll_RA | 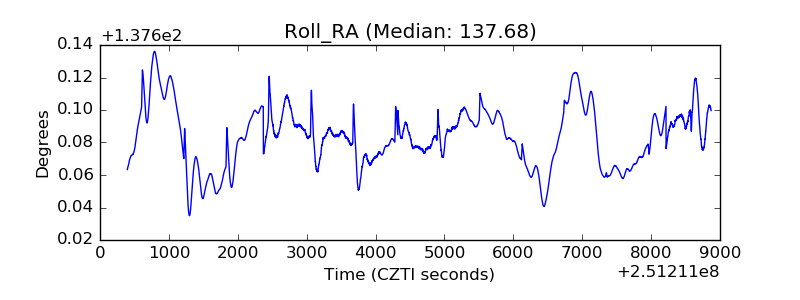 |
| Veto Counter | 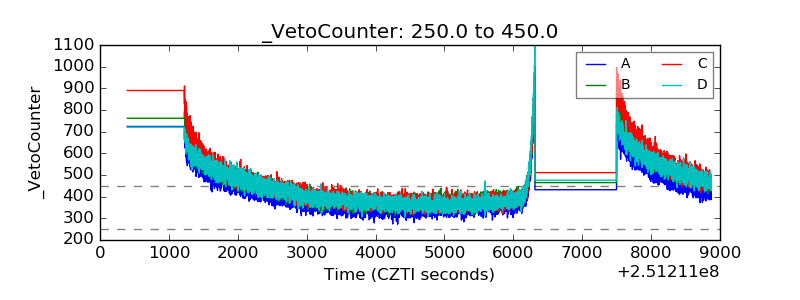 |