| Param | Original file | Final file |
|---|---|---|
| Filename | modeM0/AS1A04_044T01_9000001782cztM0_level2.fits | modeM0/AS1A04_044T01_9000001782cztM0_level2_quad_clean.evt |
| Size (bytes) | 593,412,480 | 578,324,160 |
| Size | 565.9 MB | 551.5 MB |
| Events in quadrant A | 3,570,916 | 3,454,998 |
| Events in quadrant B | 3,521,800 | 3,508,273 |
| Events in quadrant C | 3,585,386 | 3,309,188 |
| Events in quadrant D | 2,924,776 | 2,876,737 |
| Mode SS | |||
|---|---|---|---|
| Quadrant | BADHDUFLAG | Total packets | Discarded packets |
| A | 0 | 1292 | 0 |
| B | 0 | 1292 | 0 |
| C | 0 | 1292 | 0 |
| D | 0 | 1292 | 0 |
| Mode M0 | |||
|---|---|---|---|
| Quadrant | BADHDUFLAG | Total packets | Discarded packets |
| A | 0 | 146049 | 0 |
| B | 0 | 139992 | 0 |
| C | 0 | 131050 | 0 |
| D | 0 | 184746 | 0 |
| Mode M9 | |||
|---|---|---|---|
| Quadrant | BADHDUFLAG | Total packets | Discarded packets |
| A | 0 | 87 | 0 |
| B | 0 | 87 | 0 |
| C | 0 | 87 | 0 |
| D | 0 | 87 | 0 |
| Quadrant | Total seconds | Saturated seconds | Saturation percentage |
|---|---|---|---|
| A | 63653 | 2193 | 3.445242% |
| B | 63653 | 1234 | 1.938636% |
| C | 63653 | 461 | 0.724239% |
| D | 63653 | 5596 | 8.791416% |
Noise dominated data is calculated using 1-second bins in cleaned event files. If a bin has >2000 counts, and if more than 50% of those come from <1% of pixels, then it is considered to be noise-dominated and hence unusable.
| Quadrant | # 1 sec bins | Bins with >0 counts | Bins with >2000 counts | High rate bins dominated by noise | Noise dominated (total time) | Noise dominated (detector-on time) | Marked lightcurve |
|---|---|---|---|---|---|---|---|
| A | 72248 | 63295 | 0 | 0 | 0.00% | 0.00% | 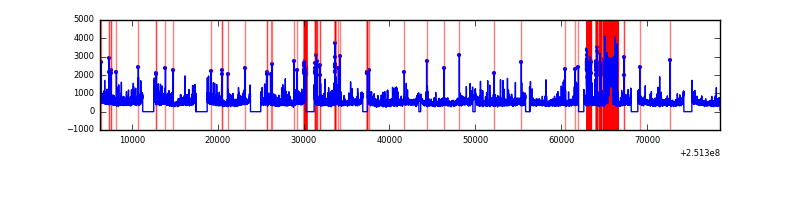 |
| B | 72248 | 63644 | 0 | 0 | 0.00% | 0.00% |  |
| C | 72248 | 63646 | 0 | 0 | 0.00% | 0.00% |  |
| D | 72247 | 63130 | 0 | 0 | 0.00% | 0.00% | 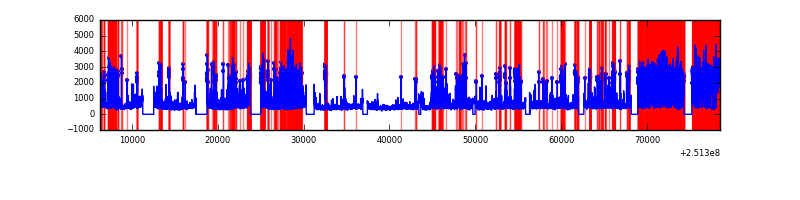 |
Top three noisy pixels from each quadrant. If the there are fewer than three noisy pixels in the level2.evt file, extra rows are filled as -1
| Pixel properties | Quadrant properties | ||||||
|---|---|---|---|---|---|---|---|
| Quadrant | DetID | PixID | Counts | Sigma | Mean | Median | Sigma |
| A | 0 | 29 | 3433 | 11.19 | 928 | 870 | 229.0 |
| A | 7 | 110 | 2936 | 9.02 | 928 | 870 | 229.0 |
| A | 9 | 19 | 2755 | 8.23 | 928 | 870 | 229.0 |
| B | 2 | 9 | 3118 | 11.85 | 928 | 879 | 188.9 |
| B | 3 | 17 | 2399 | 8.05 | 928 | 879 | 188.9 |
| B | 2 | 8 | 2349 | 7.78 | 928 | 879 | 188.9 |
| C | 1 | 80 | 2600 | 6.9 | 947 | 877 | 249.7 |
| C | 1 | 81 | 2574 | 6.8 | 947 | 877 | 249.7 |
| C | 12 | 241 | 2519 | 6.58 | 947 | 877 | 249.7 |
| D | 3 | 14 | 2220 | 6.53 | 834 | 756 | 224.3 |
| D | 6 | 231 | 2129 | 6.12 | 834 | 756 | 224.3 |
| D | 3 | 31 | 2093 | 5.96 | 834 | 756 | 224.3 |
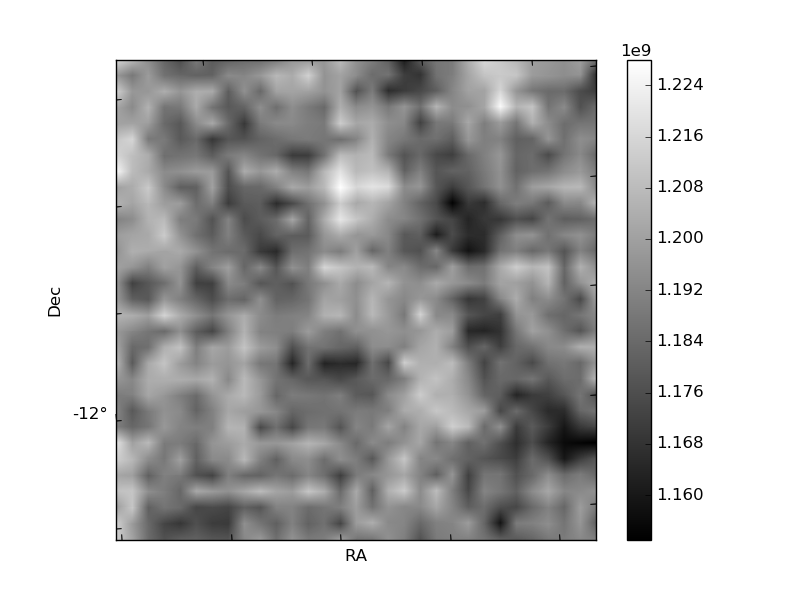
Histogram calculated using DETX and DETY for each event in the final _common_clean file
| Quadrant A | 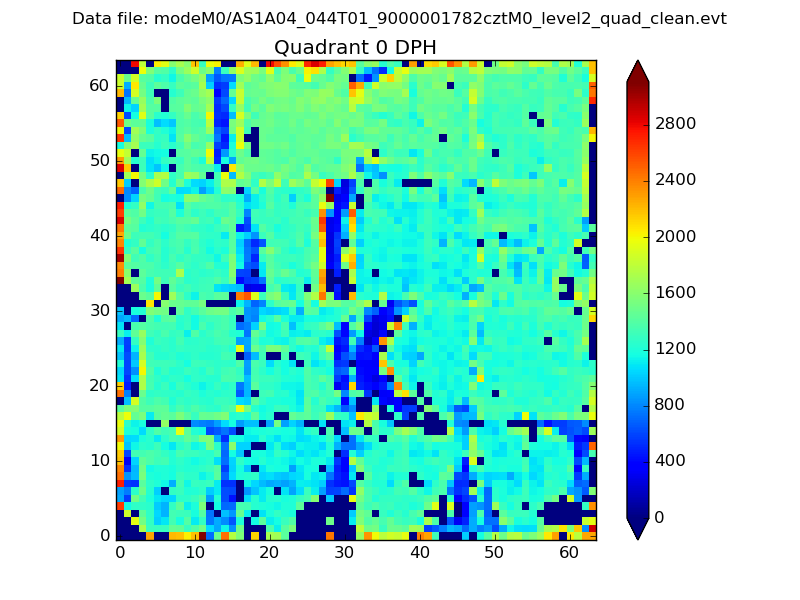 |
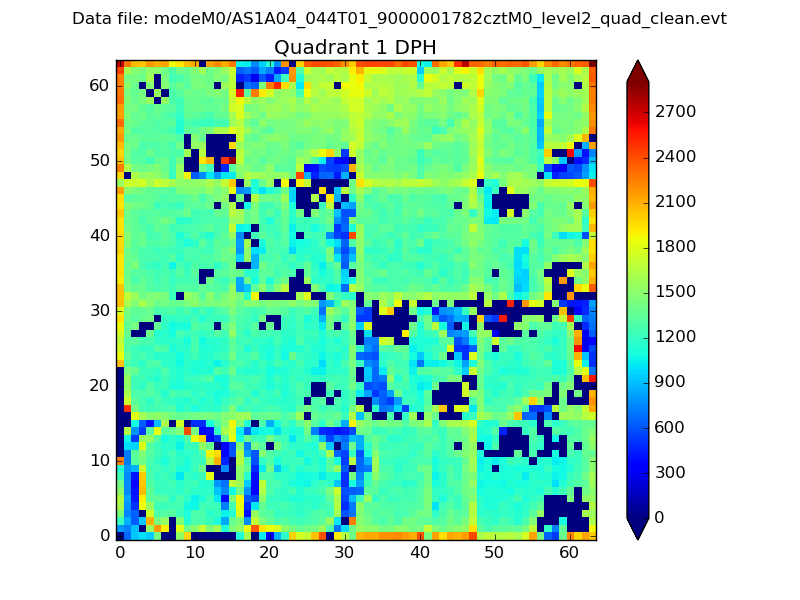 |
Quadrant B |
|---|---|---|---|
| Quadrant D | 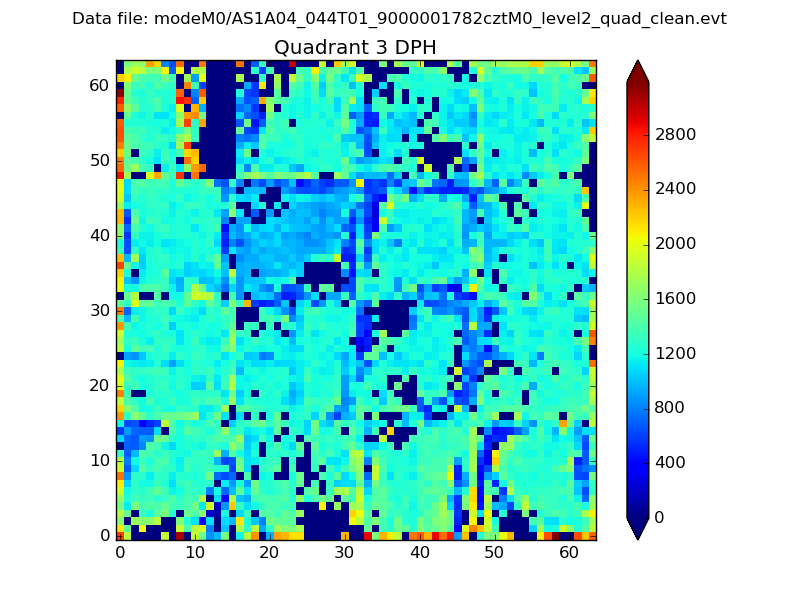 |
 |
Quadrant C |
| Plot type | Count rate plots | Images |
|---|---|---|
| Comparison with Poisson distribution Blue bars denote a histogram of data divided into 1 sec bins. Red curve is a Poisson curve with rate = median count rate of data. |
 |
 |
| Quadrant-wise count rates Data is divided into 100 sec bins |
 |
|
| Module-wise count rates for Quadrant A Data is divided into 100 sec bins |
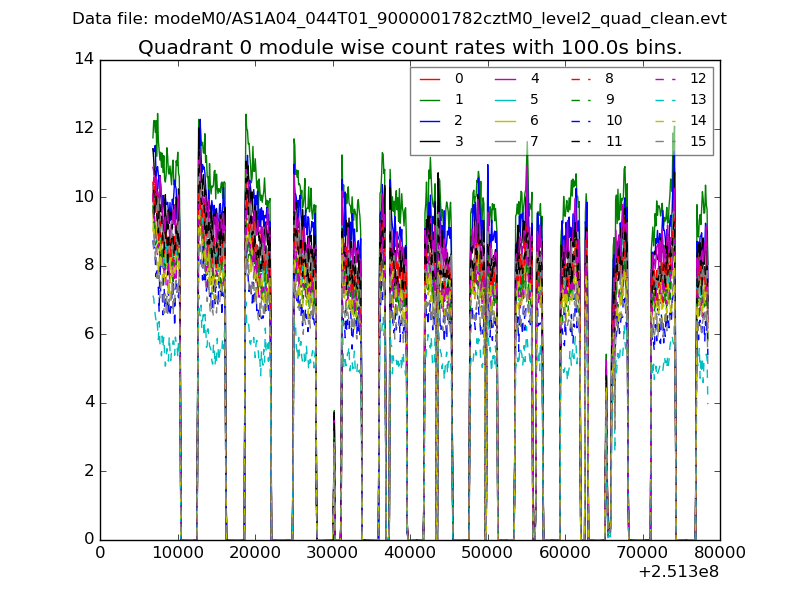 |
 |
| Module-wise count rates for Quadrant B Data is divided into 100 sec bins |
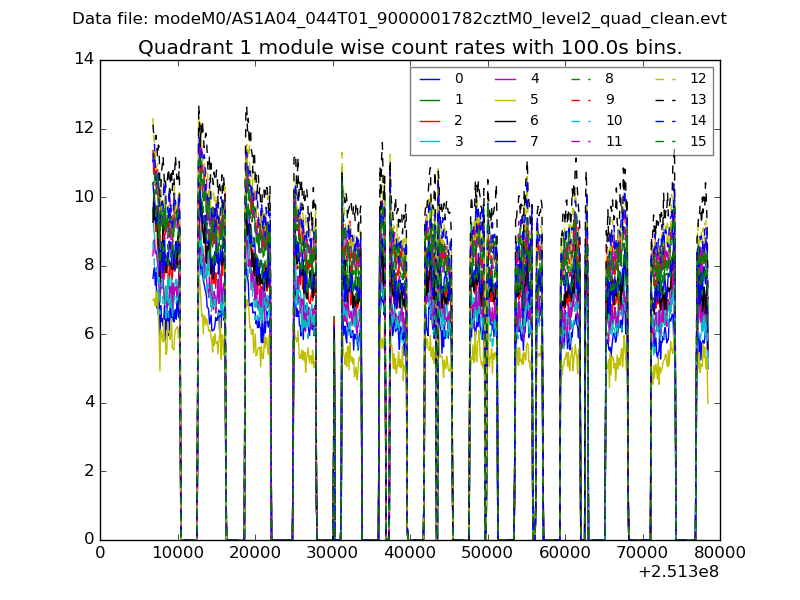 |
 |
| Module-wise count rates for Quadrant C Data is divided into 100 sec bins |
 |
 |
| Module-wise count rates for Quadrant D Data is divided into 100 sec bins |
 |
 |
| Parameter | Plot |
|---|---|
| CZT HV Monitor |  |
| D_VDD | 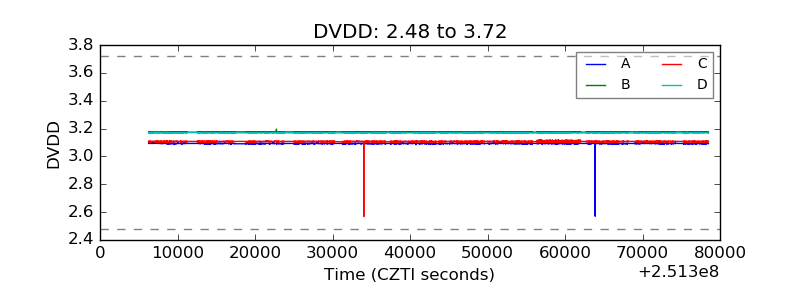 |
| Temperature 1 |  |
| Veto HV Monitor |  |
| Veto LLD | 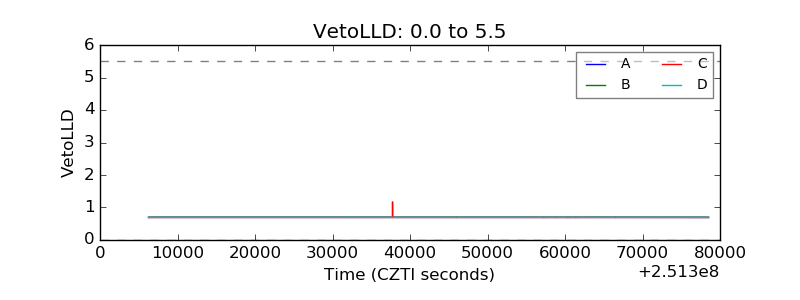 |
| Alpha Counter |  |
| _CPM_Rate |  |
| CZT Counter |  |
| +2.5 Volts monitor |  |
| +5 Volts monitor |  |
| _ROLL_ROT | 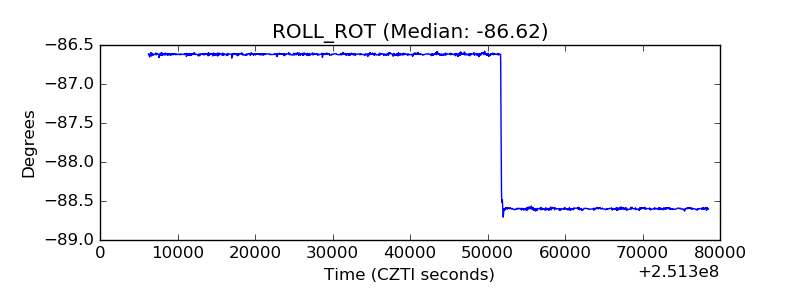 |
| _Roll_DEC |  |
| _Roll_RA |  |
| Veto Counter |  |