| Param | Original file | Final file |
|---|---|---|
| Filename | modeM0/AS1A04_044T01_9000001782_12027cztM0_level2.evt | modeM0/AS1A04_044T01_9000001782_12027cztM0_level2_quad_clean.evt |
| Size (bytes) | 523,981,440 | 107,256,960 |
| Size | 499.7 MB | 102.3 MB |
| Events in quadrant A | 3,728,886 | 715,419 |
| Events in quadrant B | 3,924,641 | 723,250 |
| Events in quadrant C | 3,228,393 | 691,861 |
| Events in quadrant D | 4,537,808 | 656,084 |
| Mode SS | |||
|---|---|---|---|
| Quadrant | BADHDUFLAG | Total packets | Discarded packets |
| A | 0 | 134 | 0 |
| B | 0 | 134 | 0 |
| C | 0 | 134 | 0 |
| D | 0 | 134 | 0 |
| Mode M0 | |||
|---|---|---|---|
| Quadrant | BADHDUFLAG | Total packets | Discarded packets |
| A | 0 | 15351 | 3 |
| B | 0 | 15928 | 2 |
| C | 0 | 13956 | 2 |
| D | 0 | 17854 | 2 |
| Mode M9 | |||
|---|---|---|---|
| Quadrant | BADHDUFLAG | Total packets | Discarded packets |
| A | 0 | 13 | 0 |
| B | 0 | 13 | 0 |
| C | 0 | 13 | 0 |
| D | 0 | 13 | 0 |
| Quadrant | Total seconds | Saturated seconds | Saturation percentage |
|---|---|---|---|
| A | 6625 | 114 | 1.720755% |
| B | 6625 | 172 | 2.596226% |
| C | 6625 | 58 | 0.875472% |
| D | 6625 | 217 | 3.275472% |
Noise dominated data is calculated using 1-second bins in cleaned event files. If a bin has >2000 counts, and if more than 50% of those come from <1% of pixels, then it is considered to be noise-dominated and hence unusable.
| Quadrant | # 1 sec bins | Bins with >0 counts | Bins with >2000 counts | High rate bins dominated by noise | Noise dominated (total time) | Noise dominated (detector-on time) | Marked lightcurve |
|---|---|---|---|---|---|---|---|
| A | 7911 | 6626 | 10 | 10 | 0.13% | 0.15% | 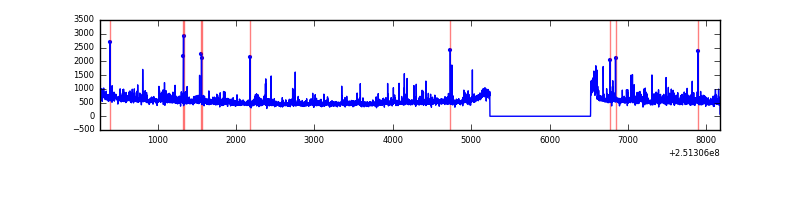 |
| B | 7911 | 6626 | 45 | 45 | 0.57% | 0.68% | 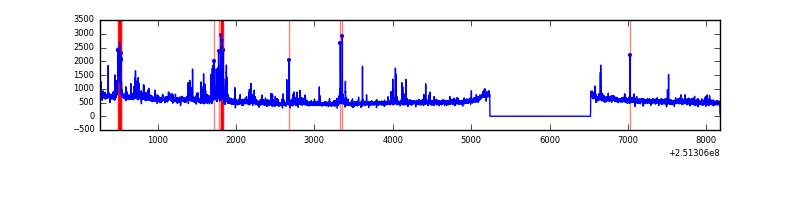 |
| C | 7911 | 6626 | 0 | 0 | 0.00% | 0.00% |  |
| D | 7911 | 6626 | 162 | 162 | 2.05% | 2.44% | 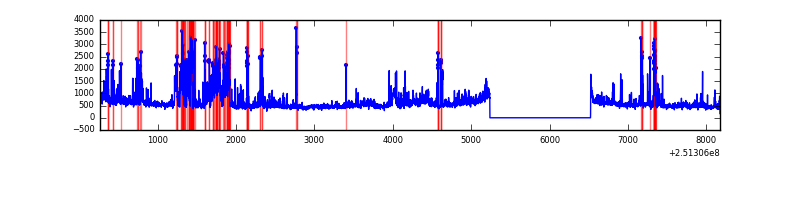 |
Top three noisy pixels from each quadrant. If the there are fewer than three noisy pixels in the level2.evt file, extra rows are filled as -1
| Pixel properties | Quadrant properties | ||||||
|---|---|---|---|---|---|---|---|
| Quadrant | DetID | PixID | Counts | Sigma | Mean | Median | Sigma |
| A | 1 | 162 | 123816 | 710.11 | 866 | 852 | 173.2 |
| A | 1 | 178 | 64988 | 370.38 | 866 | 852 | 173.2 |
| A | 1 | 161 | 57122 | 324.96 | 866 | 852 | 173.2 |
| B | 4 | 239 | 232348 | 1418.39 | 867 | 850 | 163.2 |
| B | 0 | 231 | 67118 | 406.02 | 867 | 850 | 163.2 |
| B | 4 | 206 | 63903 | 386.33 | 867 | 850 | 163.2 |
| C | 13 | 61 | 6096 | 27.54 | 827 | 835 | 191.0 |
| C | 14 | 234 | 2784 | 10.2 | 827 | 835 | 191.0 |
| C | 3 | 202 | 1993 | 6.06 | 827 | 835 | 191.0 |
| D | 1 | 52 | 895233 | 4633.64 | 814 | 794 | 193.0 |
| D | 8 | 195 | 147479 | 759.9 | 814 | 794 | 193.0 |
| D | 13 | 122 | 89695 | 460.55 | 814 | 794 | 193.0 |
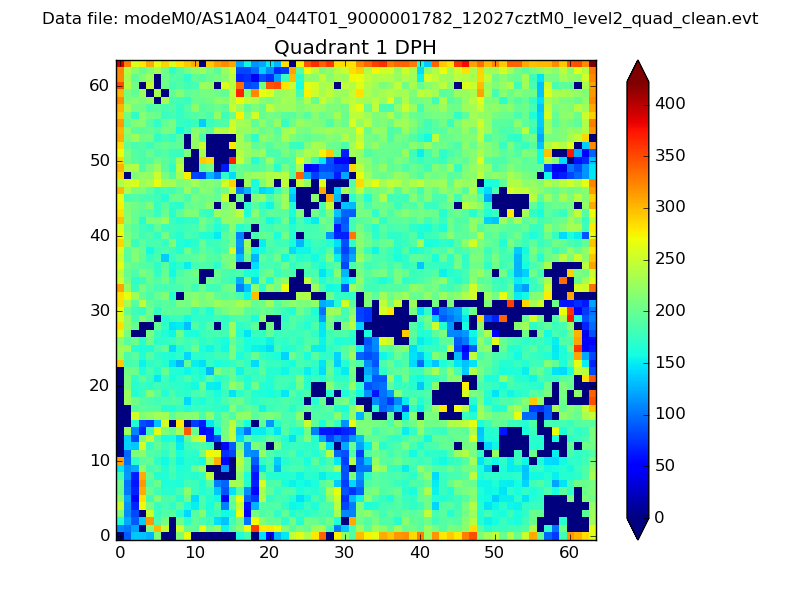
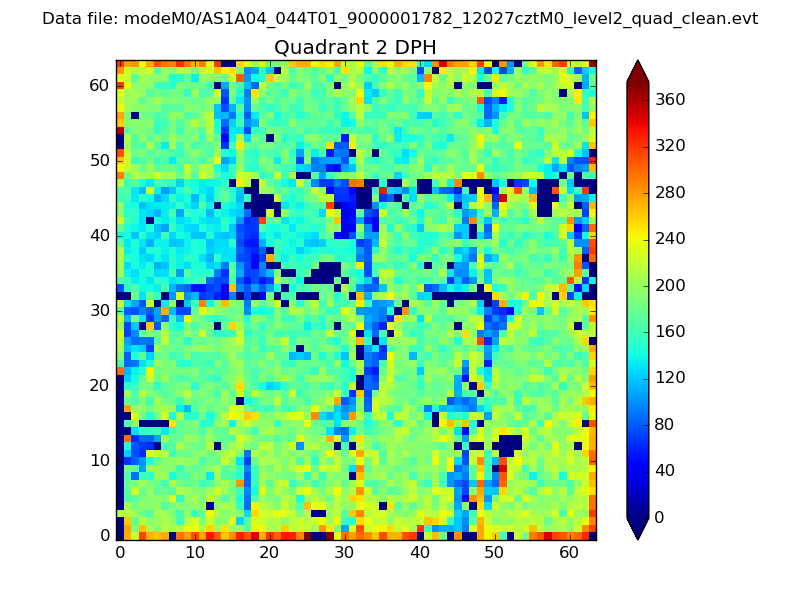
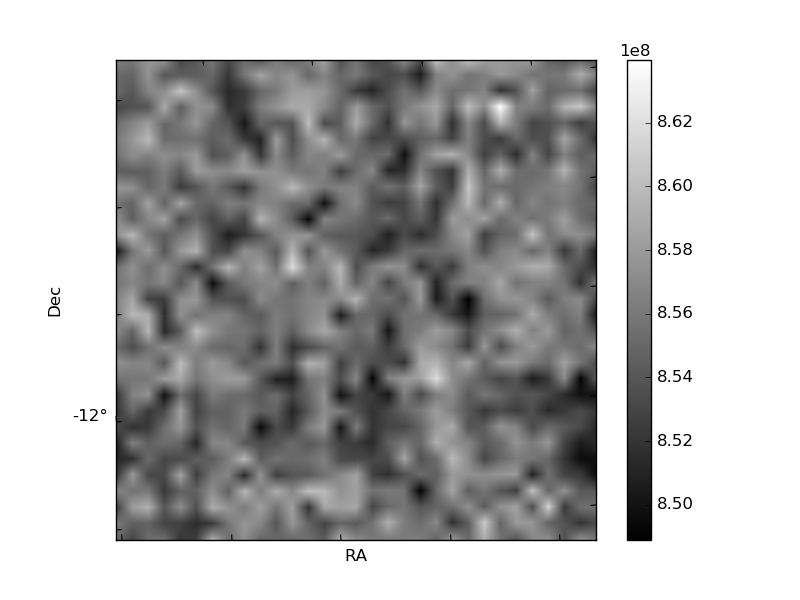
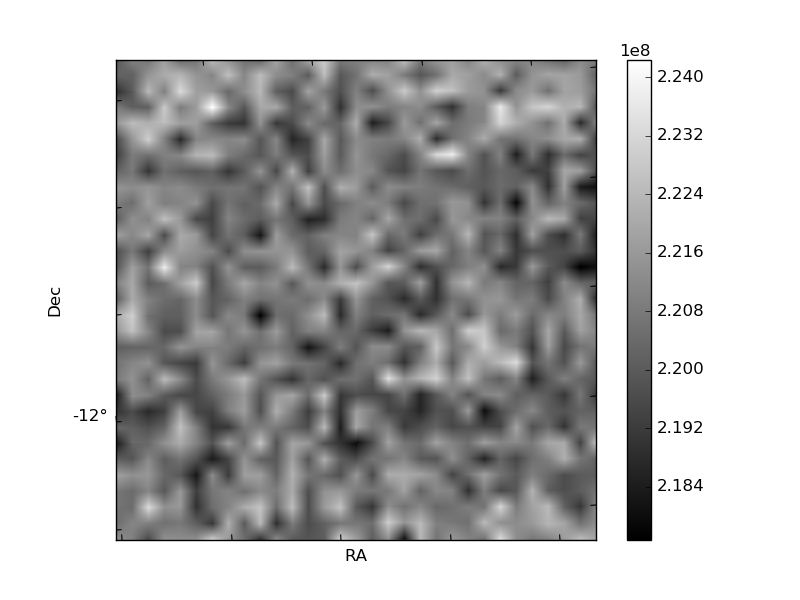
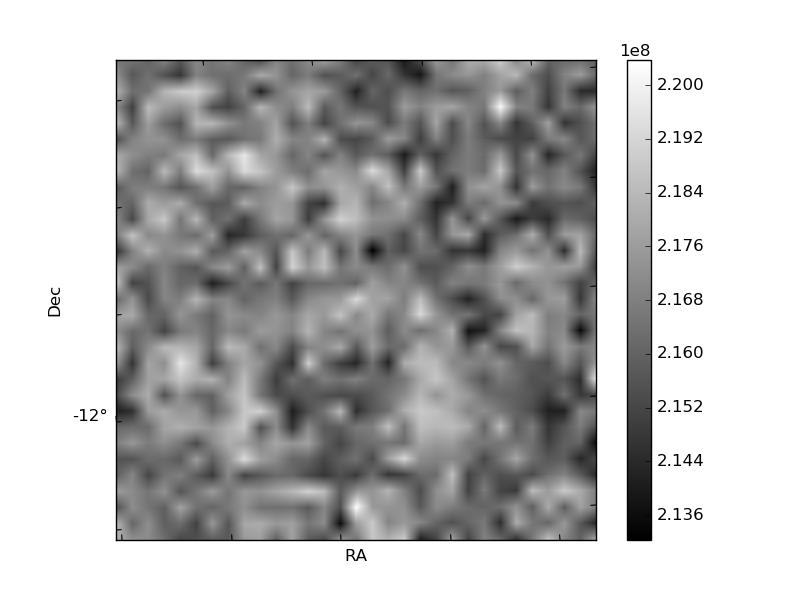
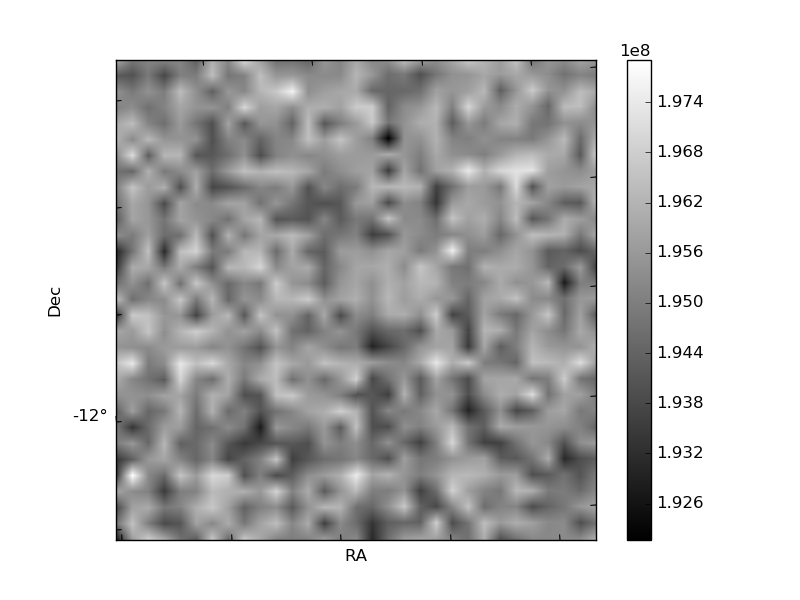
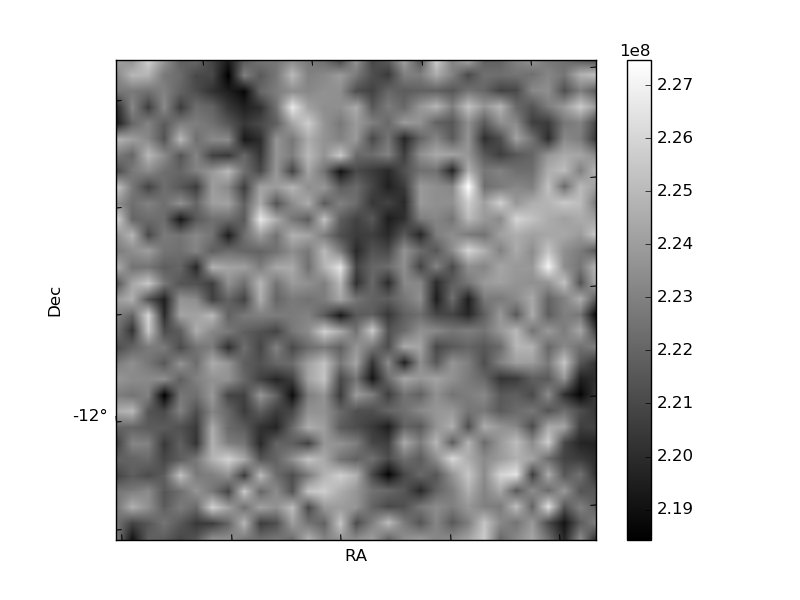
Histogram calculated using DETX and DETY for each event in the final _common_clean file
| Quadrant A | 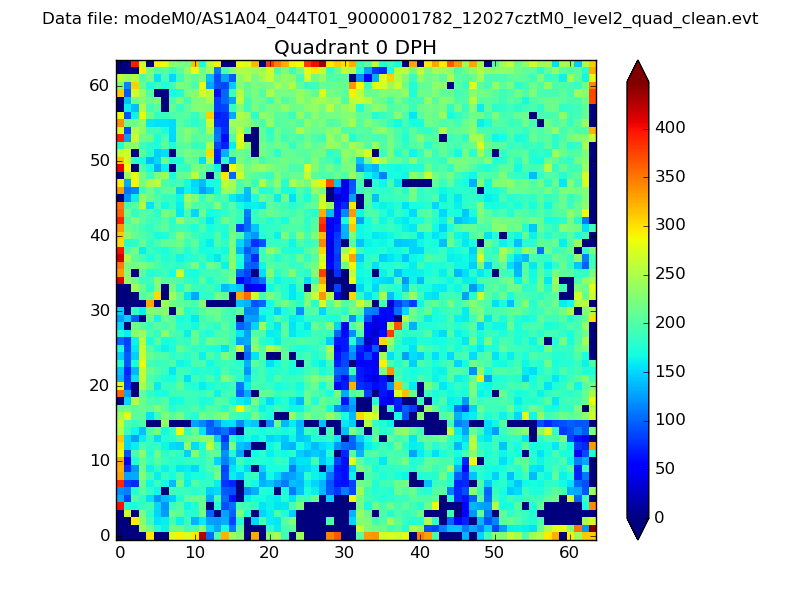 |
 |
Quadrant B |
|---|---|---|---|
| Quadrant D | 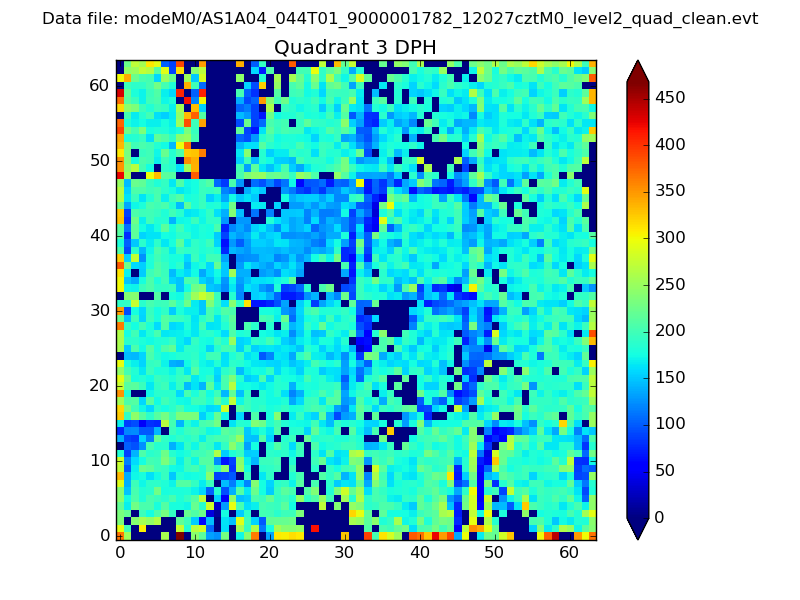 |
 |
Quadrant C |
| Plot type | Count rate plots | Images |
|---|---|---|
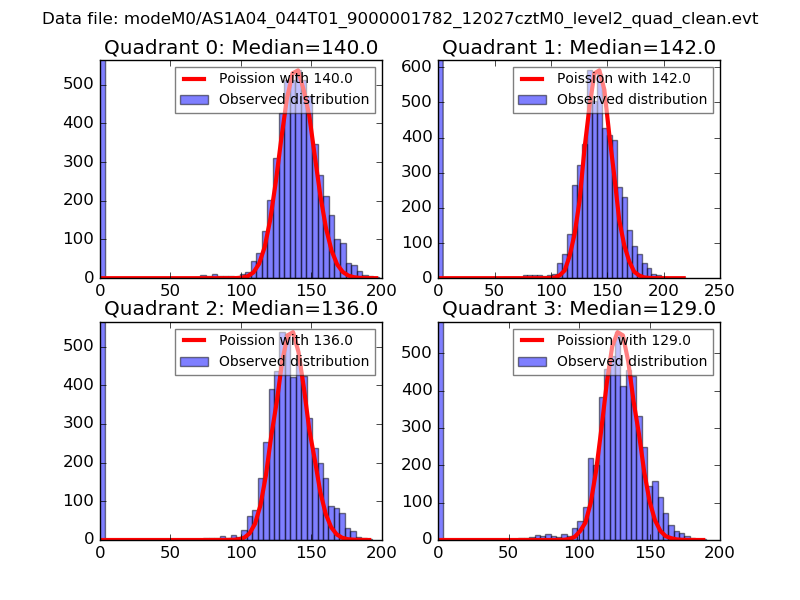
| Comparison with Poisson distribution Blue bars denote a histogram of data divided into 1 sec bins. Red curve is a Poisson curve with rate = median count rate of data. |
 |
 |
| Quadrant-wise count rates Data is divided into 100 sec bins |
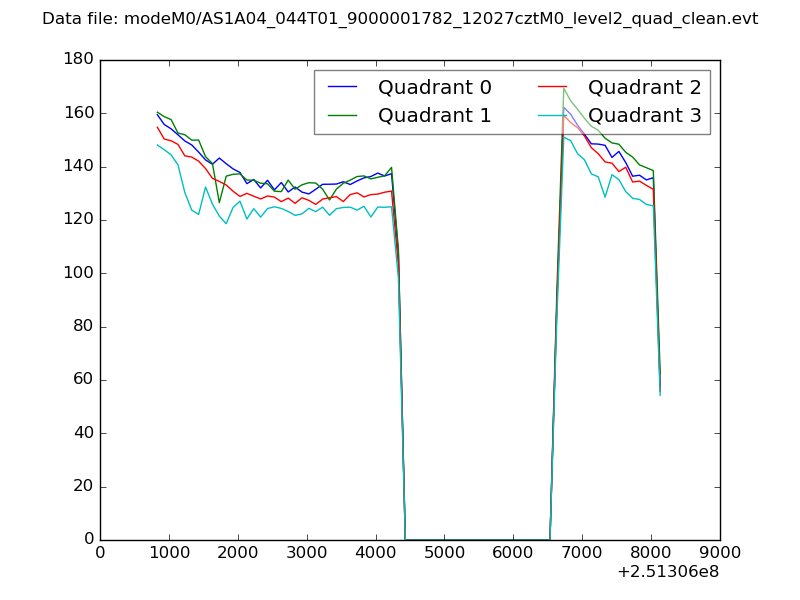 |
|
| Module-wise count rates for Quadrant A Data is divided into 100 sec bins |
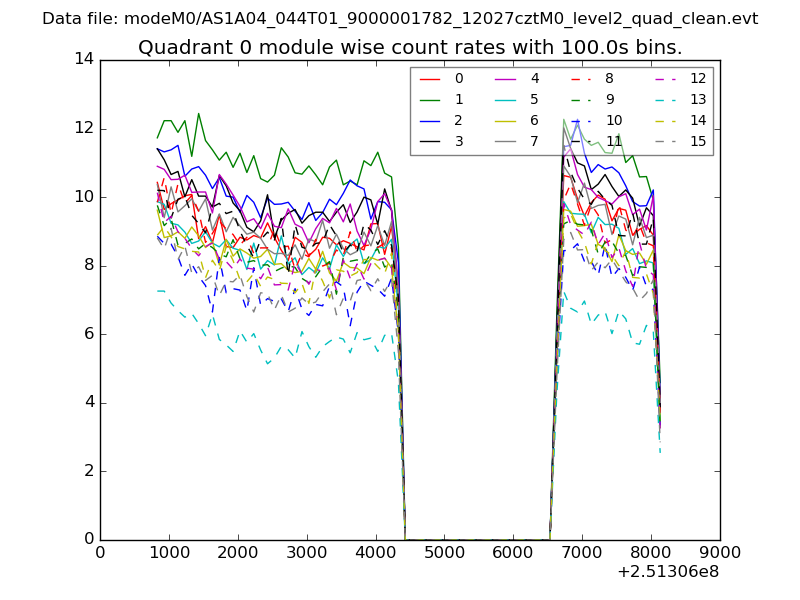 |
 |
| Module-wise count rates for Quadrant B Data is divided into 100 sec bins |
 |
 |
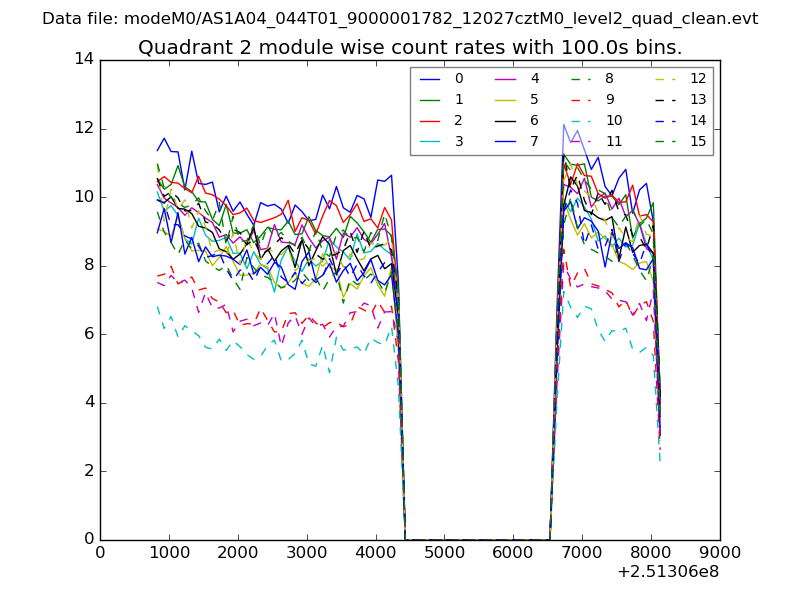
| Module-wise count rates for Quadrant C Data is divided into 100 sec bins |
 |
 |
| Module-wise count rates for Quadrant D Data is divided into 100 sec bins |
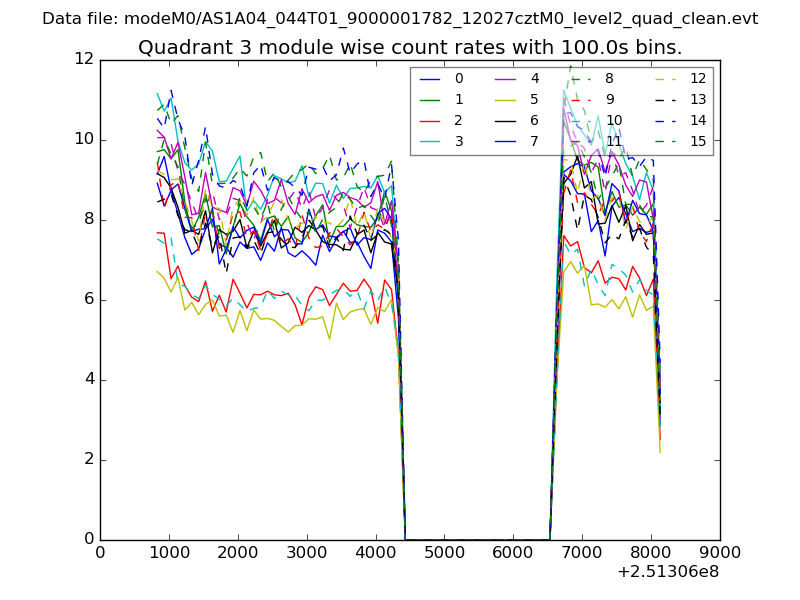 |
 |
| Parameter | Plot |
|---|---|
| CZT HV Monitor | 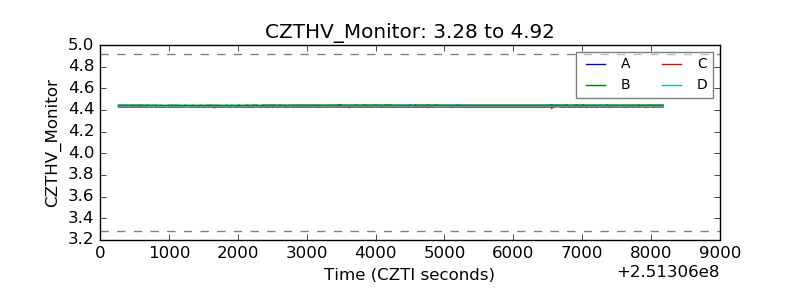 |
| D_VDD | 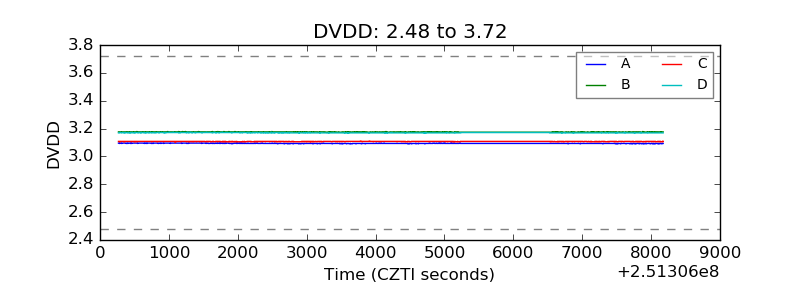 |
| Temperature 1 | 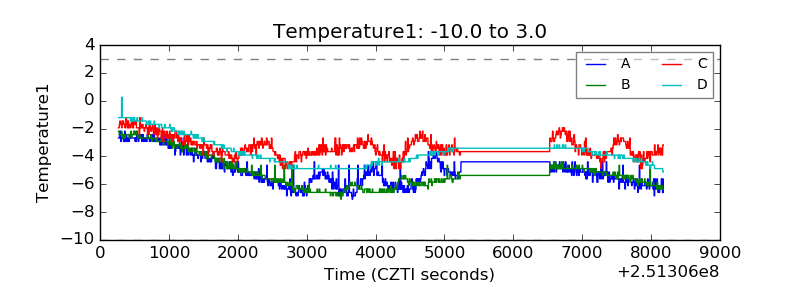 |
| Veto HV Monitor | 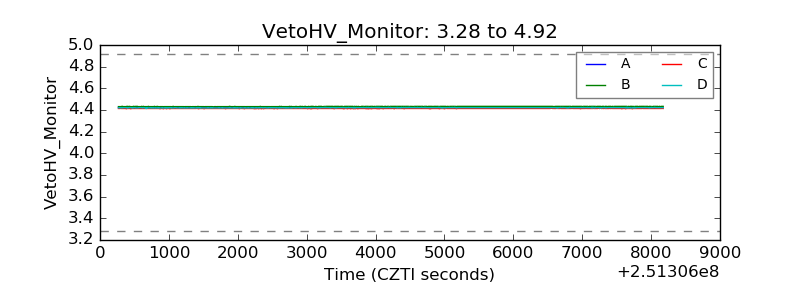 |
| Veto LLD | 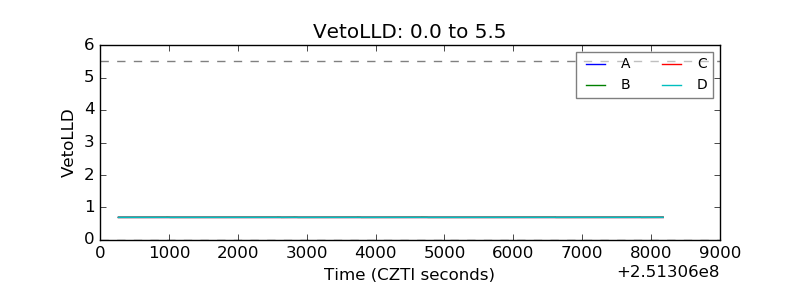 |
| Alpha Counter | 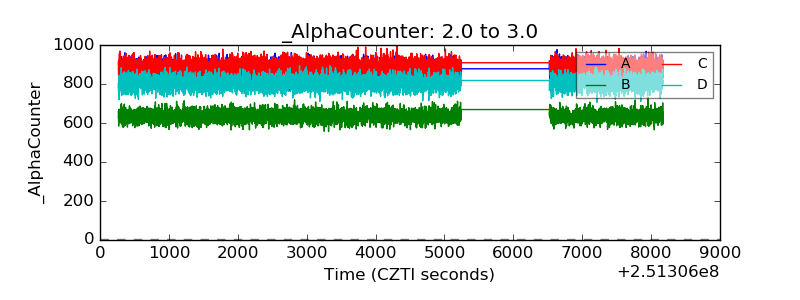 |
| _CPM_Rate | 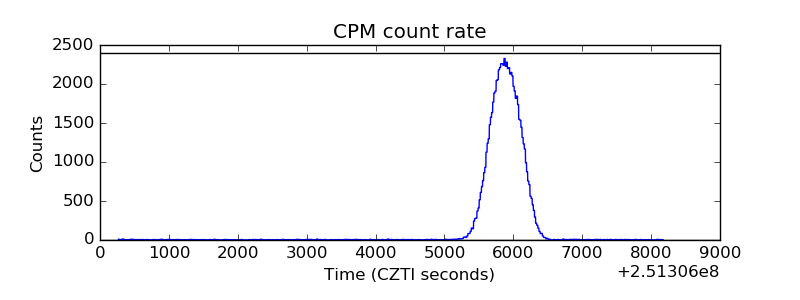 |
| CZT Counter | 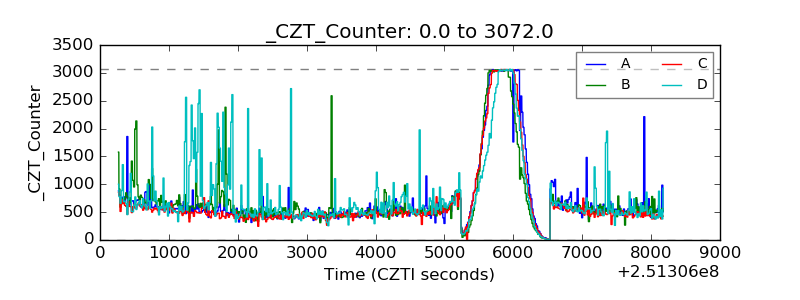 |
| +2.5 Volts monitor |  |
| +5 Volts monitor |  |
| _ROLL_ROT | 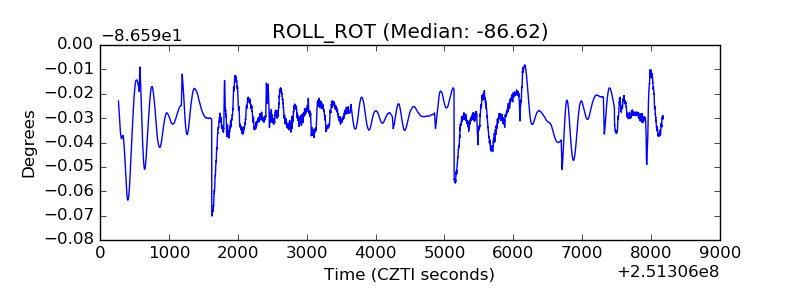 |
| _Roll_DEC | 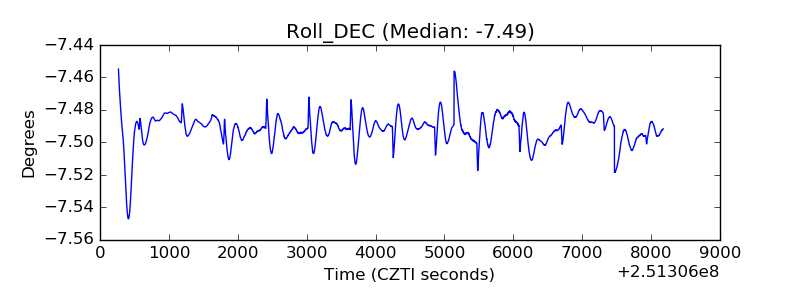 |
| _Roll_RA | 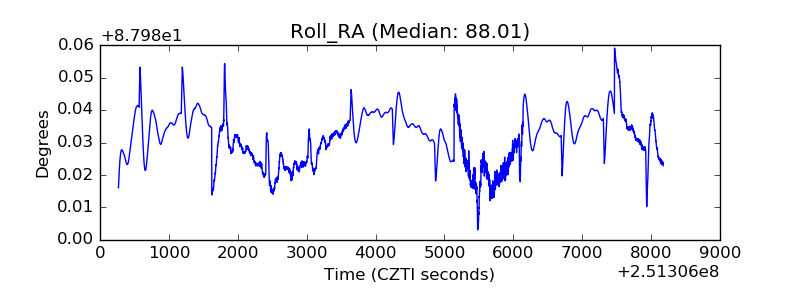 |
| Veto Counter | 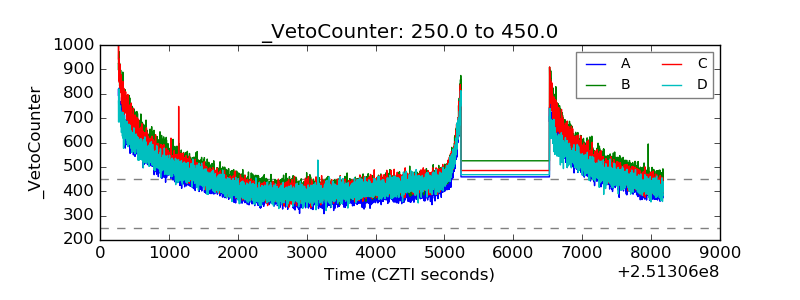 |