| Param | Original file | Final file |
|---|---|---|
| Filename | modeM0/AS1A04_044T01_9000001782_12028cztM0_level2.evt | modeM0/AS1A04_044T01_9000001782_12028cztM0_level2_quad_clean.evt |
| Size (bytes) | 450,014,400 | 106,689,600 |
| Size | 429.2 MB | 101.7 MB |
| Events in quadrant A | 3,397,147 | 711,378 |
| Events in quadrant B | 3,280,667 | 727,079 |
| Events in quadrant C | 2,998,142 | 692,047 |
| Events in quadrant D | 3,521,414 | 657,617 |
| Mode SS | |||
|---|---|---|---|
| Quadrant | BADHDUFLAG | Total packets | Discarded packets |
| A | 0 | 128 | 0 |
| B | 0 | 128 | 0 |
| C | 0 | 128 | 0 |
| D | 0 | 128 | 0 |
| Mode M0 | |||
|---|---|---|---|
| Quadrant | BADHDUFLAG | Total packets | Discarded packets |
| A | 0 | 14192 | 2 |
| B | 0 | 13699 | 1 |
| C | 0 | 13099 | 1 |
| D | 0 | 14638 | 1 |
| Mode M9 | |||
|---|---|---|---|
| Quadrant | BADHDUFLAG | Total packets | Discarded packets |
| A | 0 | 13 | 0 |
| B | 0 | 13 | 0 |
| C | 0 | 13 | 0 |
| D | 0 | 13 | 0 |
| Quadrant | Total seconds | Saturated seconds | Saturation percentage |
|---|---|---|---|
| A | 6353 | 84 | 1.322210% |
| B | 6353 | 63 | 0.991657% |
| C | 6353 | 30 | 0.472218% |
| D | 6353 | 90 | 1.416654% |
Noise dominated data is calculated using 1-second bins in cleaned event files. If a bin has >2000 counts, and if more than 50% of those come from <1% of pixels, then it is considered to be noise-dominated and hence unusable.
| Quadrant | # 1 sec bins | Bins with >0 counts | Bins with >2000 counts | High rate bins dominated by noise | Noise dominated (total time) | Noise dominated (detector-on time) | Marked lightcurve |
|---|---|---|---|---|---|---|---|
| A | 7664 | 6355 | 5 | 5 | 0.07% | 0.08% | 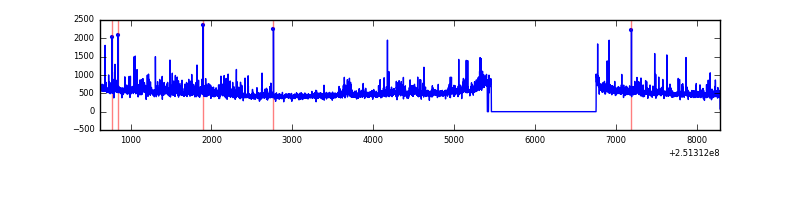 |
| B | 7664 | 6355 | 2 | 2 | 0.03% | 0.03% | 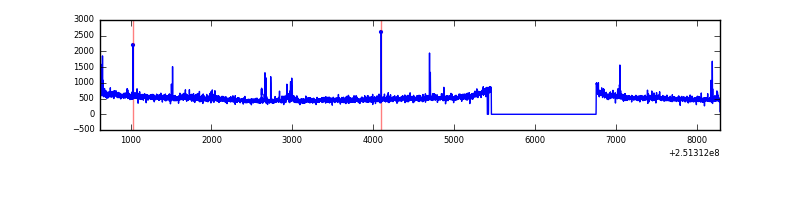 |
| C | 7664 | 6355 | 1 | 1 | 0.01% | 0.02% | 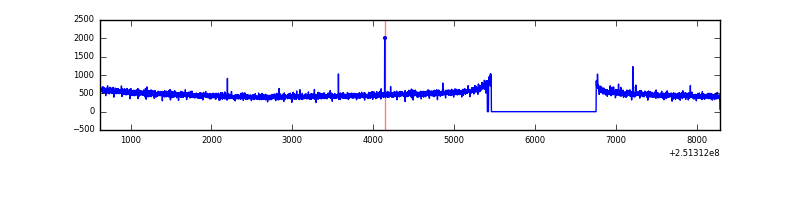 |
| D | 7664 | 6356 | 71 | 71 | 0.93% | 1.12% | 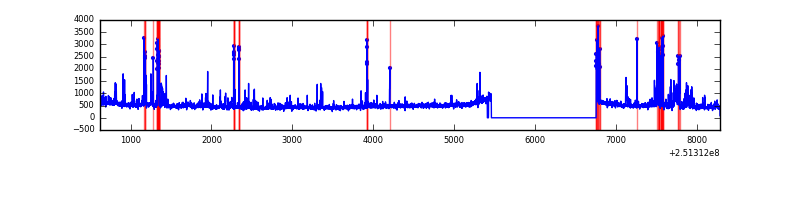 |
Top three noisy pixels from each quadrant. If the there are fewer than three noisy pixels in the level2.evt file, extra rows are filled as -1
| Pixel properties | Quadrant properties | ||||||
|---|---|---|---|---|---|---|---|
| Quadrant | DetID | PixID | Counts | Sigma | Mean | Median | Sigma |
| A | 1 | 162 | 111974 | 690.64 | 800 | 788 | 161.0 |
| A | 1 | 178 | 57284 | 350.93 | 800 | 788 | 161.0 |
| A | 1 | 161 | 50563 | 309.18 | 800 | 788 | 161.0 |
| B | 4 | 239 | 51187 | 331.56 | 804 | 787 | 152.0 |
| B | 15 | 204 | 40125 | 258.79 | 804 | 787 | 152.0 |
| B | 0 | 85 | 34023 | 218.65 | 804 | 787 | 152.0 |
| C | 13 | 61 | 5554 | 27.04 | 767 | 773 | 176.8 |
| C | 12 | 4 | 5338 | 25.82 | 767 | 773 | 176.8 |
| C | 14 | 234 | 4912 | 23.41 | 767 | 773 | 176.8 |
| D | 1 | 52 | 258131 | 1439.52 | 754 | 734 | 178.8 |
| D | 13 | 105 | 181262 | 1009.62 | 754 | 734 | 178.8 |
| D | 13 | 122 | 84338 | 467.56 | 754 | 734 | 178.8 |
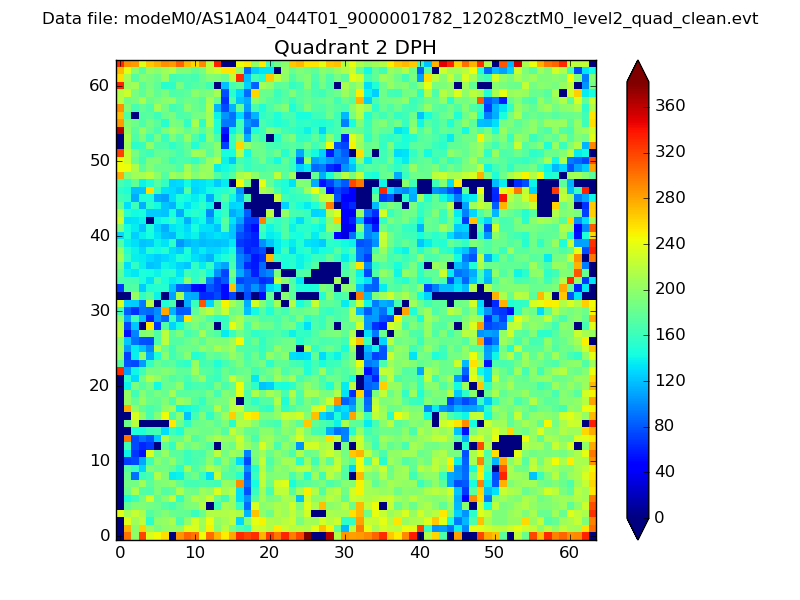
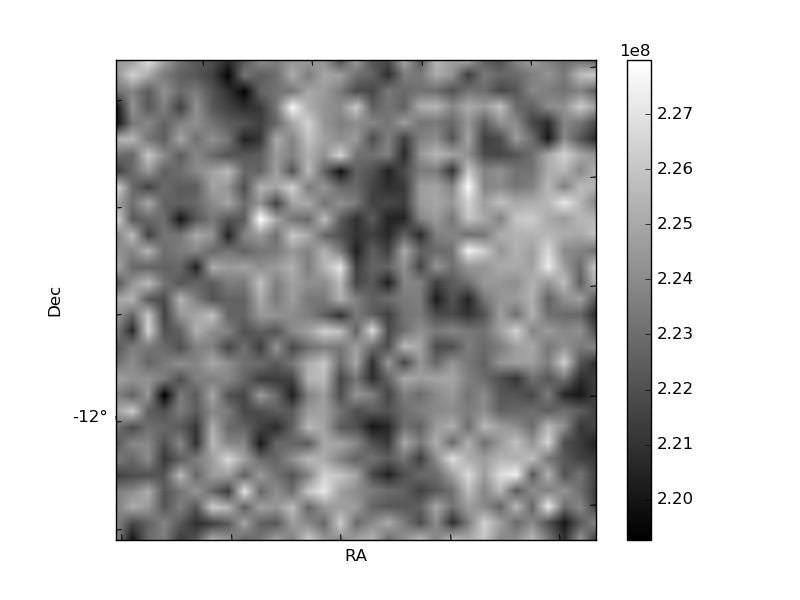
Histogram calculated using DETX and DETY for each event in the final _common_clean file
| Quadrant A | 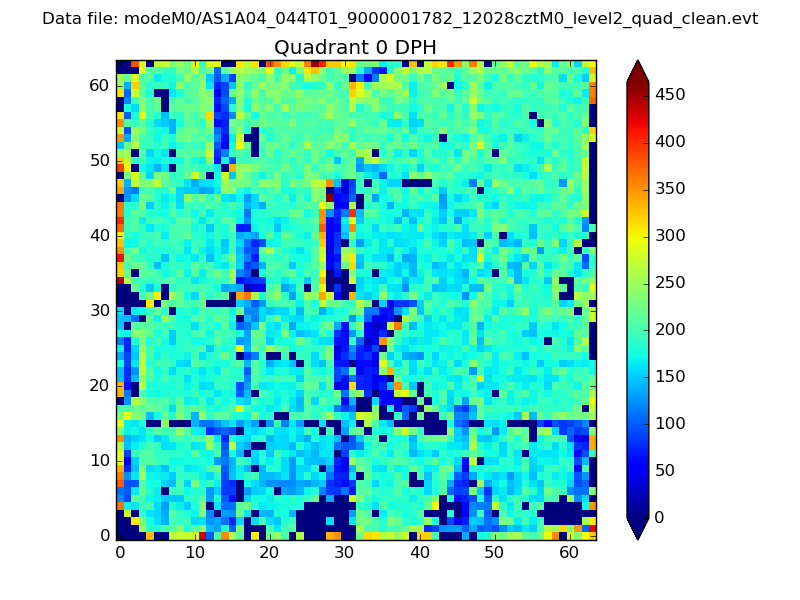 |
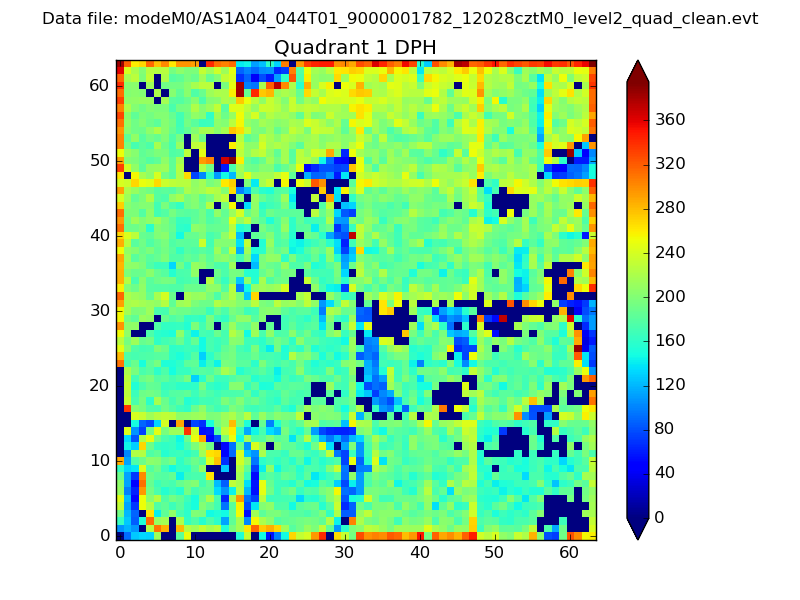 |
Quadrant B |
|---|---|---|---|
| Quadrant D | 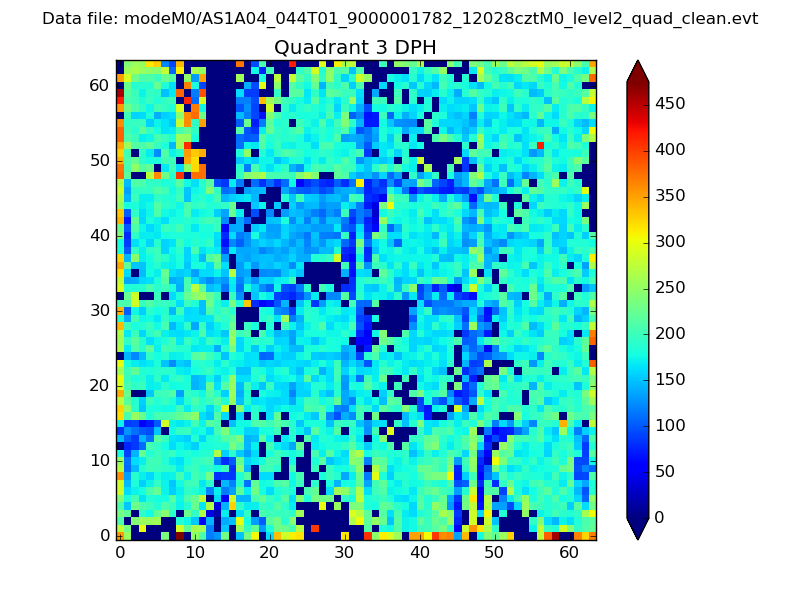 |
 |
Quadrant C |
| Plot type | Count rate plots | Images |
|---|---|---|
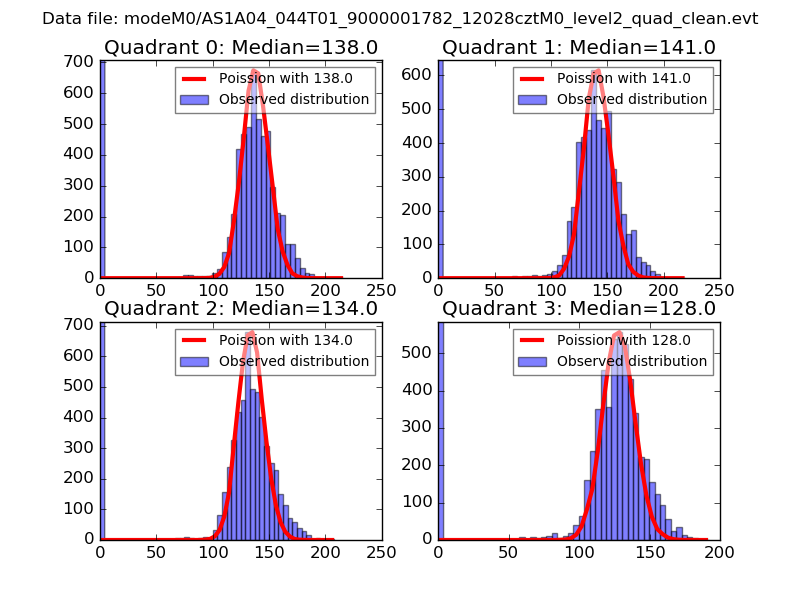
| Comparison with Poisson distribution Blue bars denote a histogram of data divided into 1 sec bins. Red curve is a Poisson curve with rate = median count rate of data. |
 |
 |
| Quadrant-wise count rates Data is divided into 100 sec bins |
 |
|
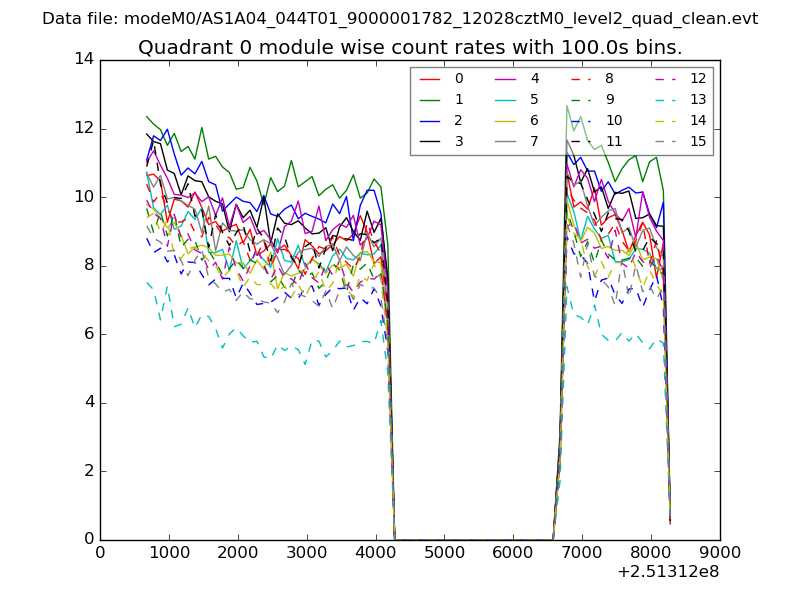
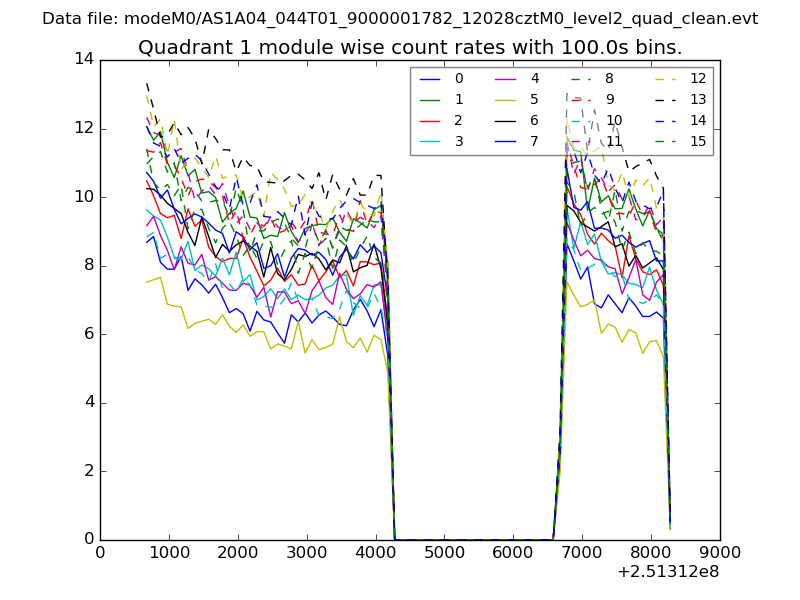
| Module-wise count rates for Quadrant A Data is divided into 100 sec bins |
 |
 |
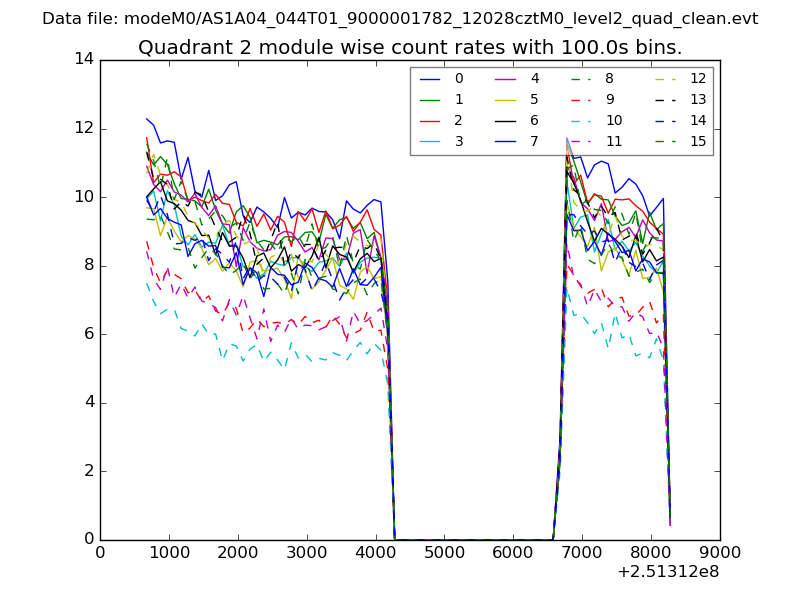
| Module-wise count rates for Quadrant B Data is divided into 100 sec bins |
 |
 |
| Module-wise count rates for Quadrant C Data is divided into 100 sec bins |
 |
 |
| Module-wise count rates for Quadrant D Data is divided into 100 sec bins |
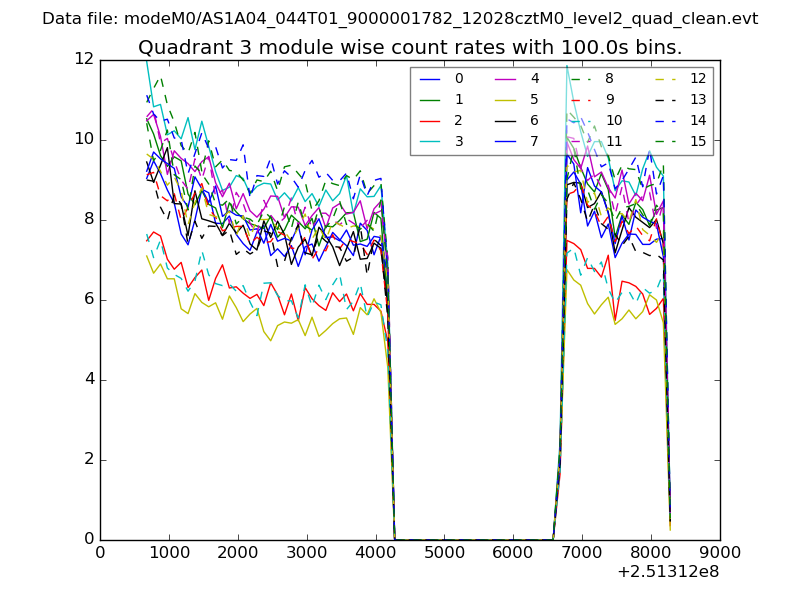 |
 |
| Parameter | Plot |
|---|---|
| CZT HV Monitor | 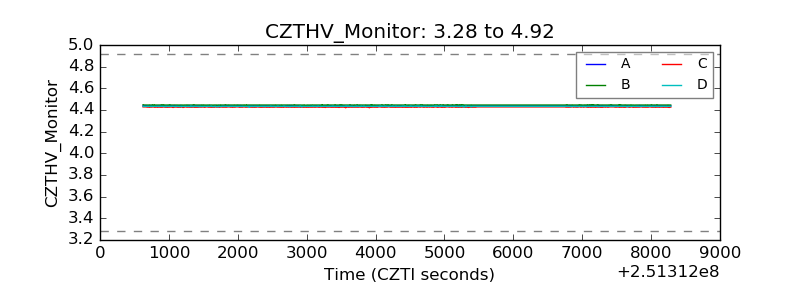 |
| D_VDD | 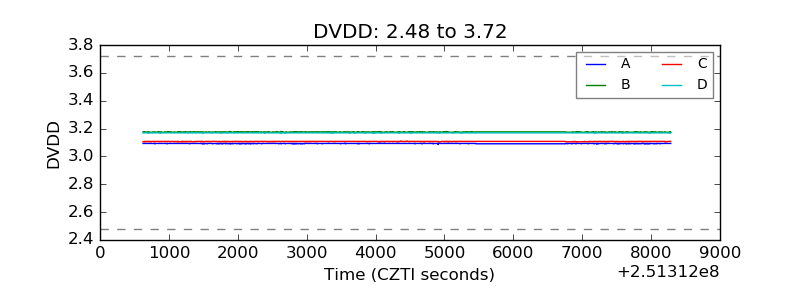 |
| Temperature 1 | 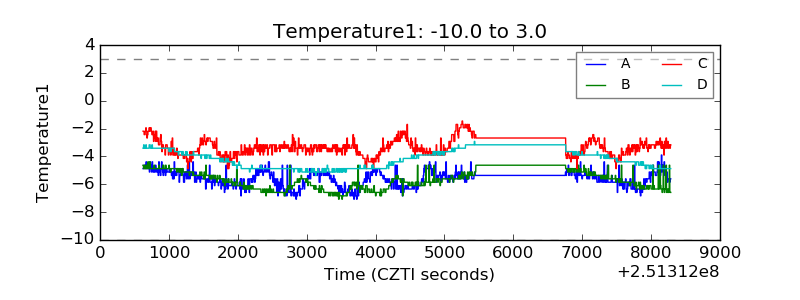 |
| Veto HV Monitor | 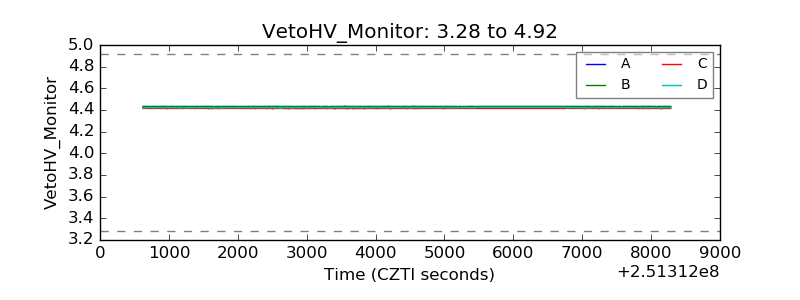 |
| Veto LLD | 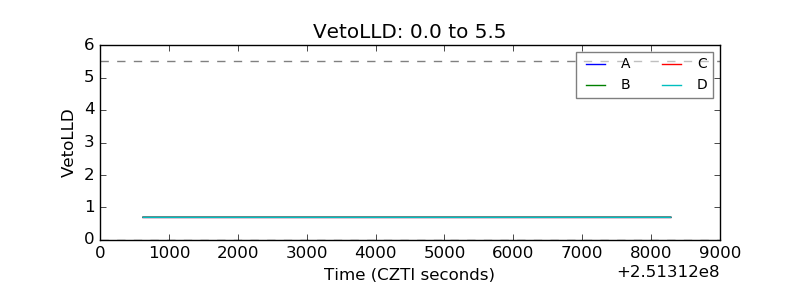 |
| Alpha Counter | 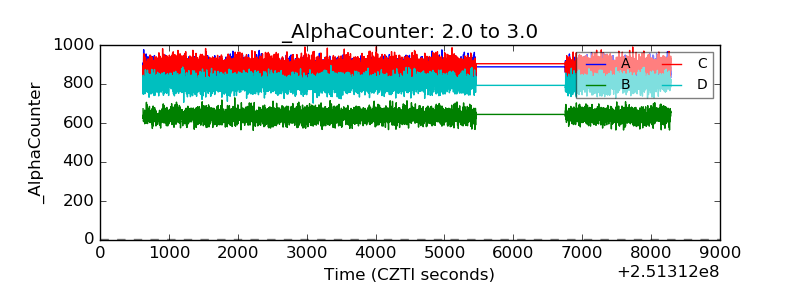 |
| _CPM_Rate | 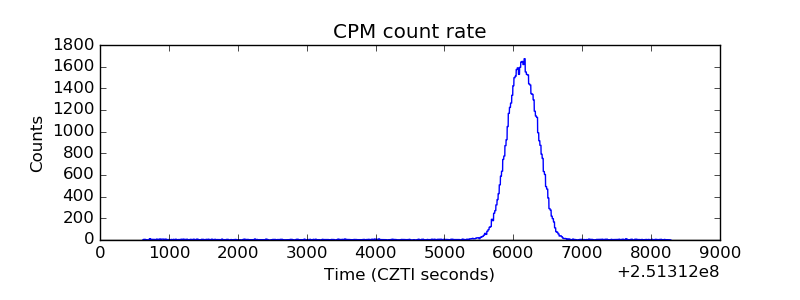 |
| CZT Counter | 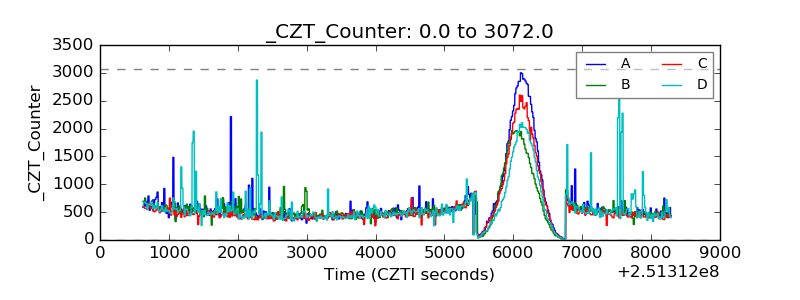 |
| +2.5 Volts monitor |  |
| +5 Volts monitor |  |
| _ROLL_ROT | 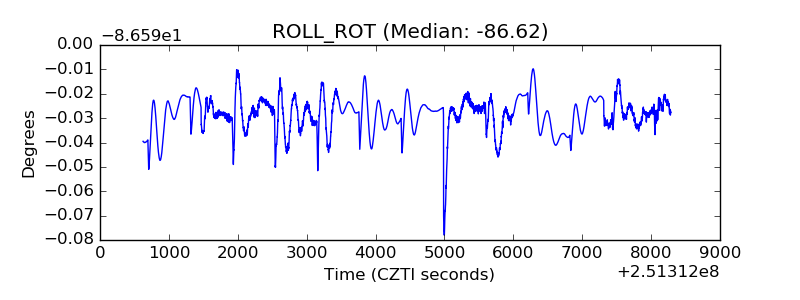 |
| _Roll_DEC | 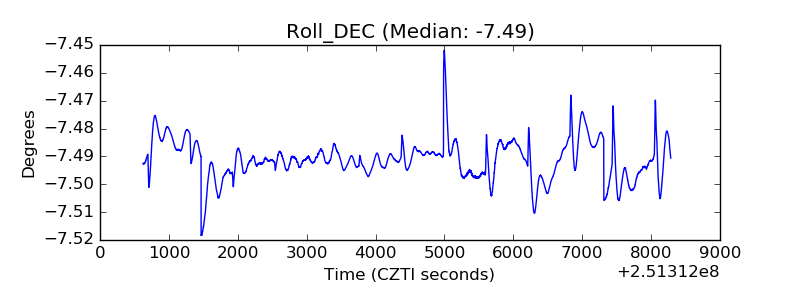 |
| _Roll_RA | 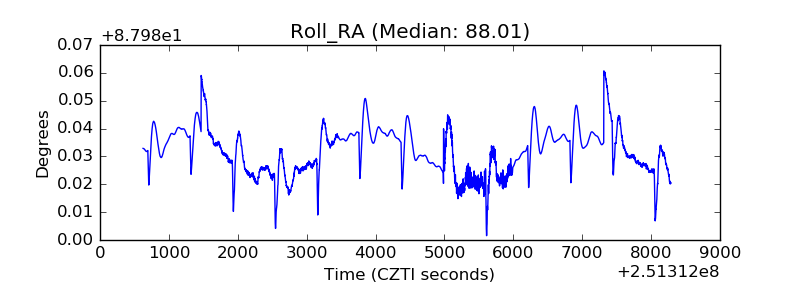 |
| Veto Counter | 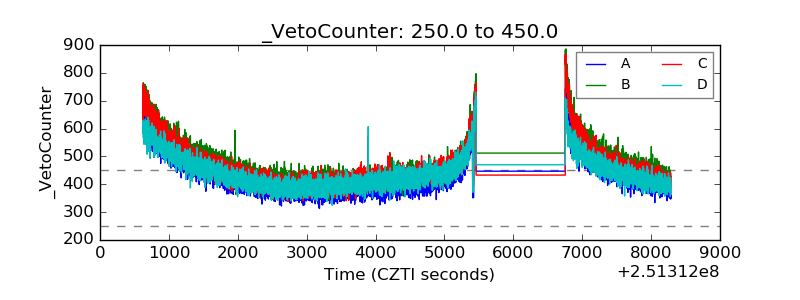 |