| Param | Original file | Final file |
|---|---|---|
| Filename | modeM0/AS1A04_044T01_9000001782_12029cztM0_level2.evt | modeM0/AS1A04_044T01_9000001782_12029cztM0_level2_quad_clean.evt |
| Size (bytes) | 501,825,600 | 97,781,760 |
| Size | 478.6 MB | 93.3 MB |
| Events in quadrant A | 3,411,596 | 642,467 |
| Events in quadrant B | 3,577,398 | 649,184 |
| Events in quadrant C | 3,006,505 | 625,762 |
| Events in quadrant D | 4,759,916 | 589,114 |
| Mode SS | |||
|---|---|---|---|
| Quadrant | BADHDUFLAG | Total packets | Discarded packets |
| A | 0 | 132 | 0 |
| B | 0 | 132 | 0 |
| C | 0 | 132 | 0 |
| D | 0 | 132 | 0 |
| Mode M0 | |||
|---|---|---|---|
| Quadrant | BADHDUFLAG | Total packets | Discarded packets |
| A | 0 | 14387 | 3 |
| B | 0 | 14752 | 2 |
| C | 0 | 13430 | 2 |
| D | 0 | 18617 | 2 |
| Mode M9 | |||
|---|---|---|---|
| Quadrant | BADHDUFLAG | Total packets | Discarded packets |
| A | 0 | 13 | 0 |
| B | 0 | 13 | 0 |
| C | 0 | 13 | 0 |
| D | 0 | 13 | 0 |
| Quadrant | Total seconds | Saturated seconds | Saturation percentage |
|---|---|---|---|
| A | 6520 | 58 | 0.889571% |
| B | 6520 | 113 | 1.733129% |
| C | 6520 | 16 | 0.245399% |
| D | 6520 | 371 | 5.690184% |
Noise dominated data is calculated using 1-second bins in cleaned event files. If a bin has >2000 counts, and if more than 50% of those come from <1% of pixels, then it is considered to be noise-dominated and hence unusable.
| Quadrant | # 1 sec bins | Bins with >0 counts | Bins with >2000 counts | High rate bins dominated by noise | Noise dominated (total time) | Noise dominated (detector-on time) | Marked lightcurve |
|---|---|---|---|---|---|---|---|
| A | 7731 | 6521 | 9 | 9 | 0.12% | 0.14% | 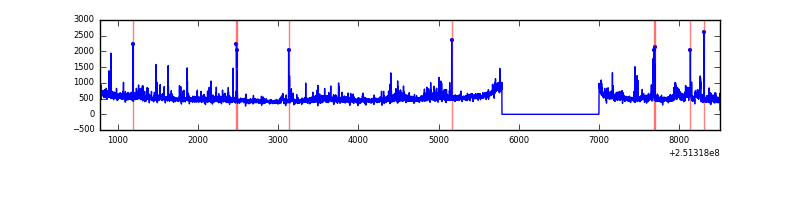 |
| B | 7731 | 6521 | 16 | 16 | 0.21% | 0.25% | 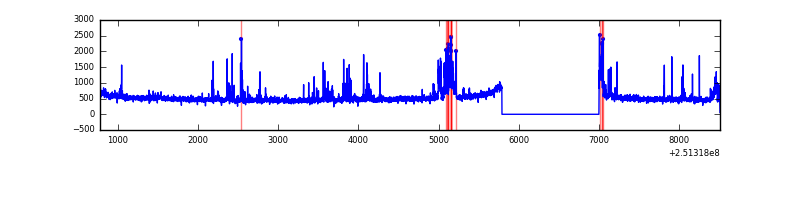 |
| C | 7731 | 6521 | 0 | 0 | 0.00% | 0.00% | 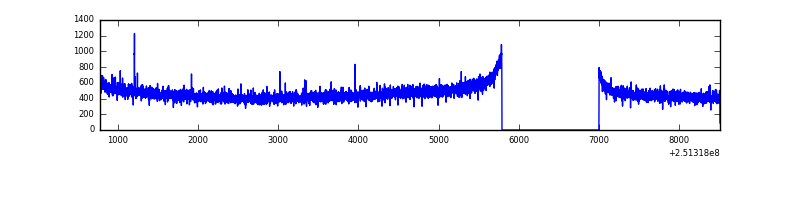 |
| D | 7731 | 6521 | 290 | 290 | 3.75% | 4.45% | 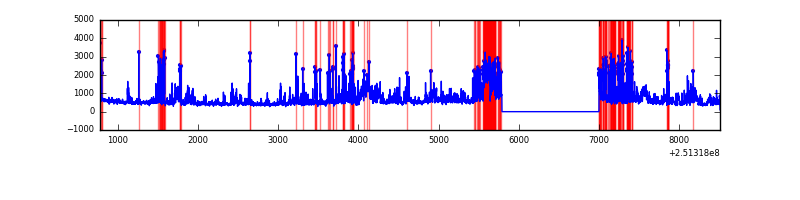 |
Top three noisy pixels from each quadrant. If the there are fewer than three noisy pixels in the level2.evt file, extra rows are filled as -1
| Pixel properties | Quadrant properties | ||||||
|---|---|---|---|---|---|---|---|
| Quadrant | DetID | PixID | Counts | Sigma | Mean | Median | Sigma |
| A | 7 | 16 | 104012 | 632.4 | 802 | 787 | 163.2 |
| A | 1 | 162 | 86364 | 524.28 | 802 | 787 | 163.2 |
| A | 1 | 178 | 42942 | 258.26 | 802 | 787 | 163.2 |
| B | 4 | 239 | 285903 | 1852.34 | 801 | 782 | 153.9 |
| B | 0 | 85 | 107987 | 696.48 | 801 | 782 | 153.9 |
| B | 15 | 204 | 52590 | 336.58 | 801 | 782 | 153.9 |
| C | 13 | 61 | 5700 | 27.62 | 769 | 774 | 178.3 |
| C | 12 | 4 | 3742 | 16.64 | 769 | 774 | 178.3 |
| C | 14 | 234 | 2717 | 10.89 | 769 | 774 | 178.3 |
| D | 1 | 52 | 1100935 | 6255.95 | 741 | 723 | 175.9 |
| D | 4 | 95 | 490938 | 2787.42 | 741 | 723 | 175.9 |
| D | 13 | 105 | 201296 | 1140.48 | 741 | 723 | 175.9 |
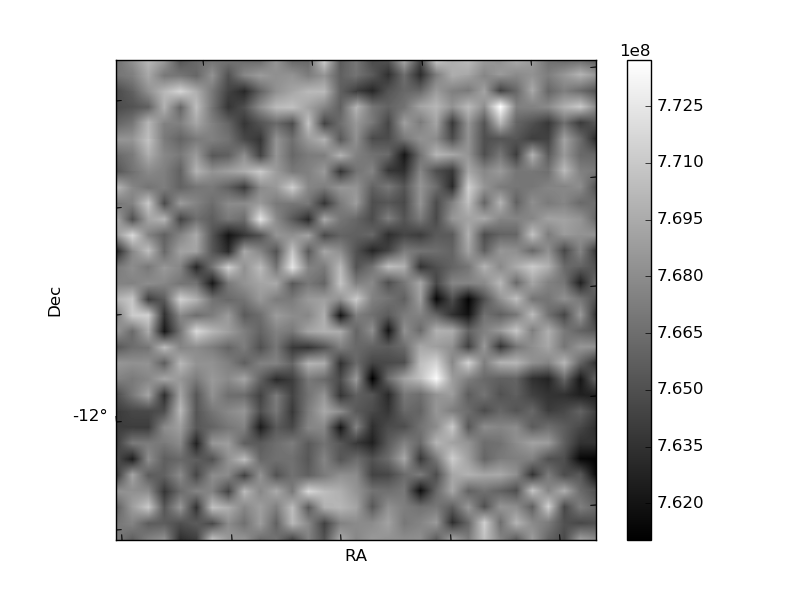
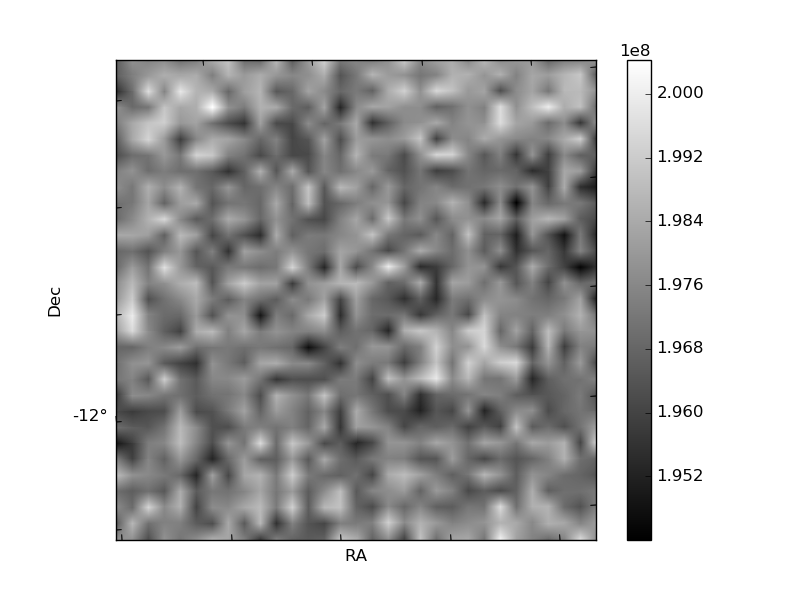
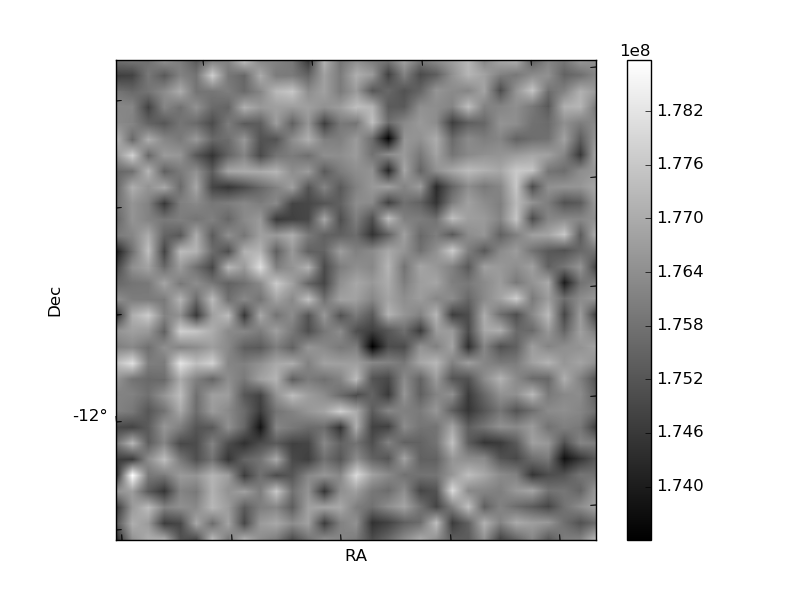
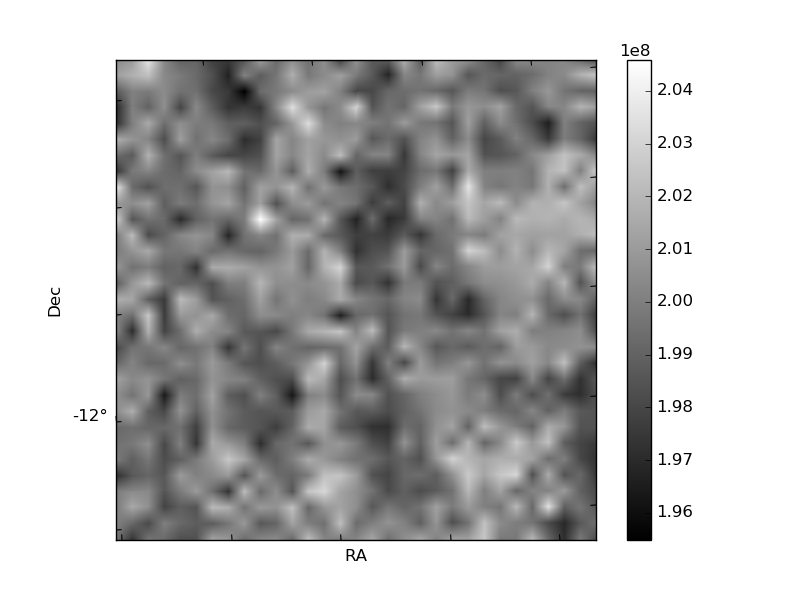
Histogram calculated using DETX and DETY for each event in the final _common_clean file
| Quadrant A | 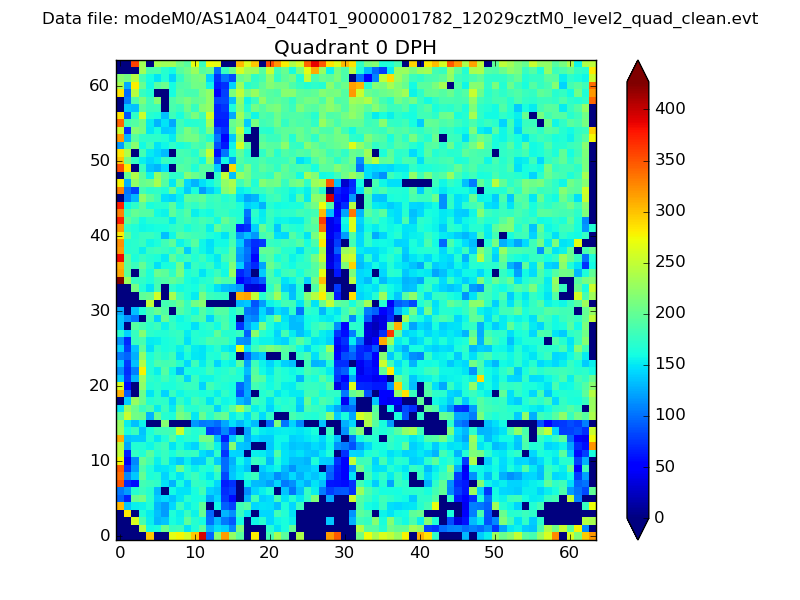 |
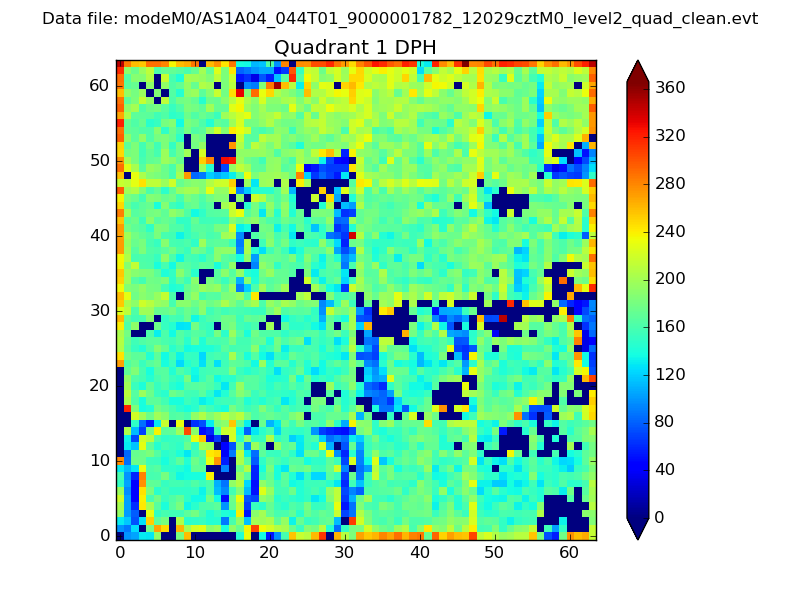 |
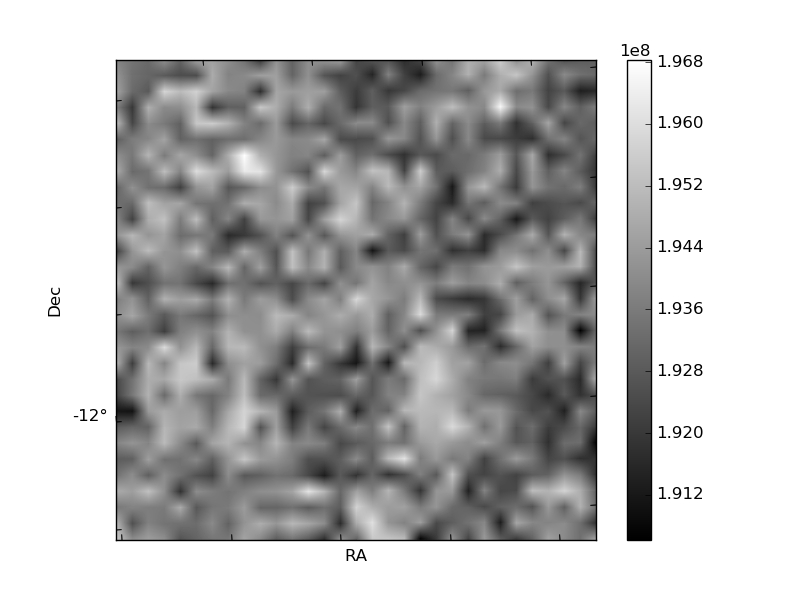
Quadrant B |
|---|---|---|---|
| Quadrant D | 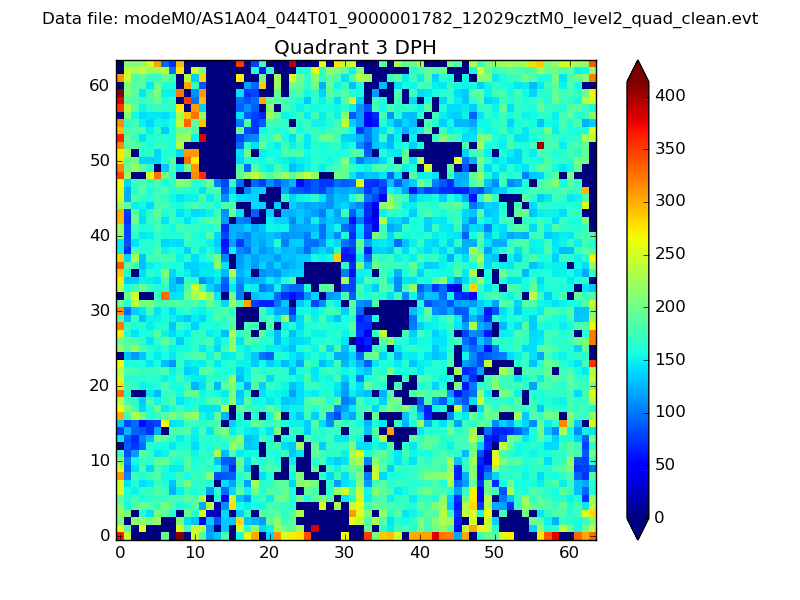 |
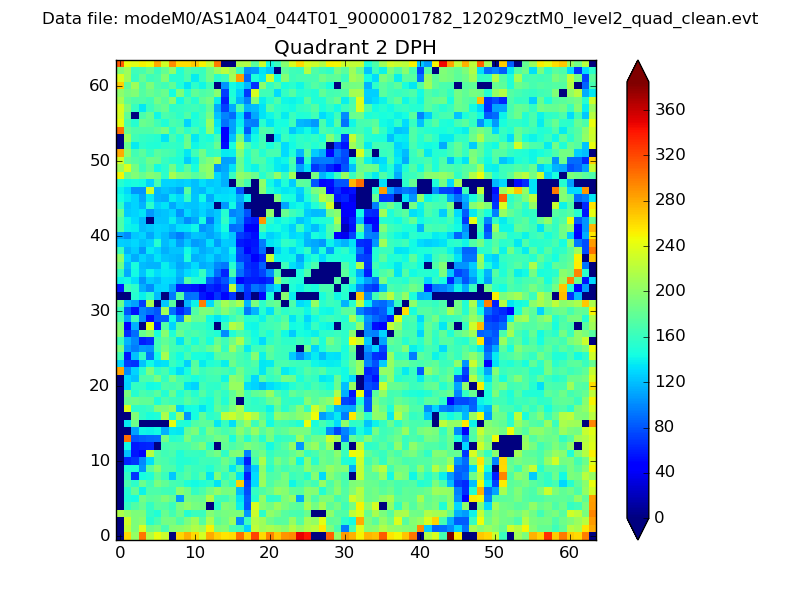 |
Quadrant C |
| Plot type | Count rate plots | Images |
|---|---|---|
| Comparison with Poisson distribution Blue bars denote a histogram of data divided into 1 sec bins. Red curve is a Poisson curve with rate = median count rate of data. |
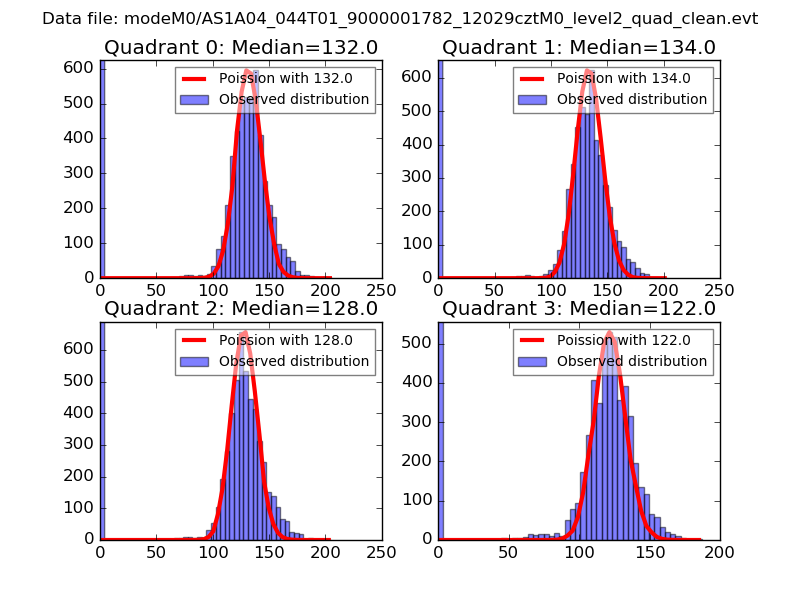 |
 |
| Quadrant-wise count rates Data is divided into 100 sec bins |
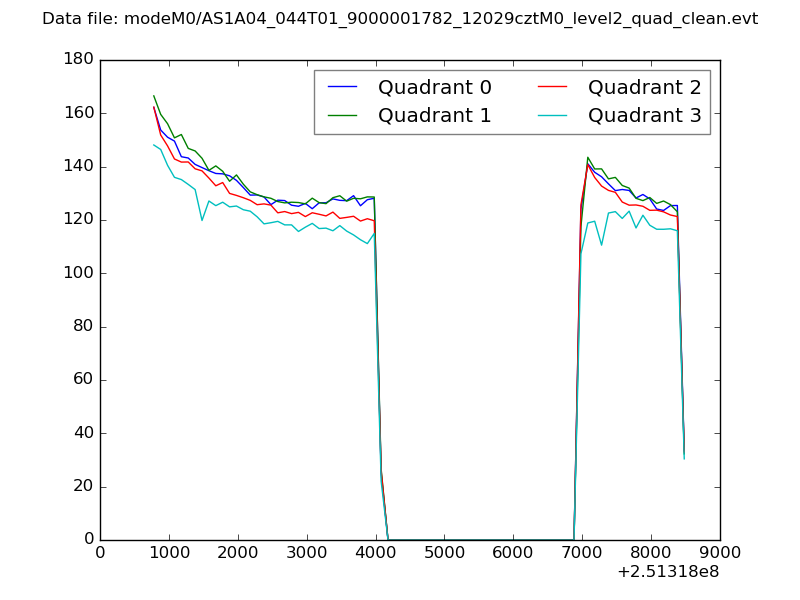 |
|
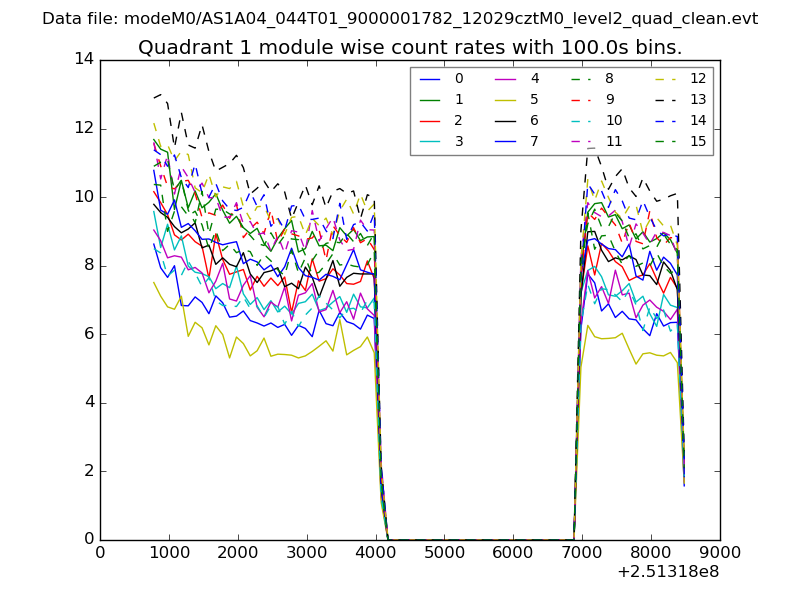
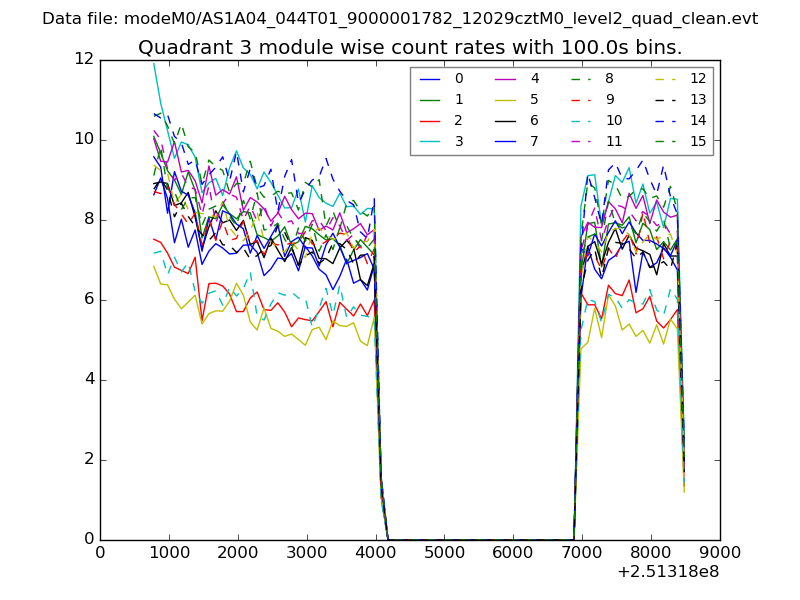
| Module-wise count rates for Quadrant A Data is divided into 100 sec bins |
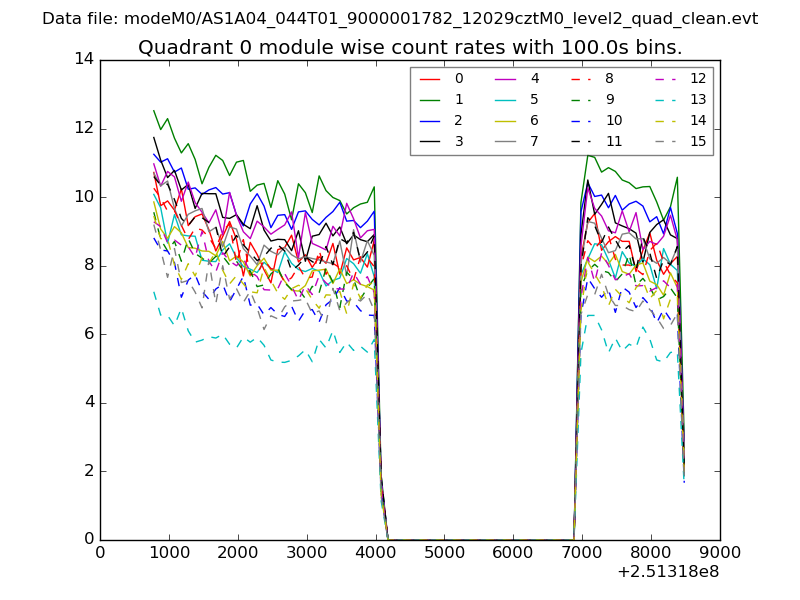 |
 |
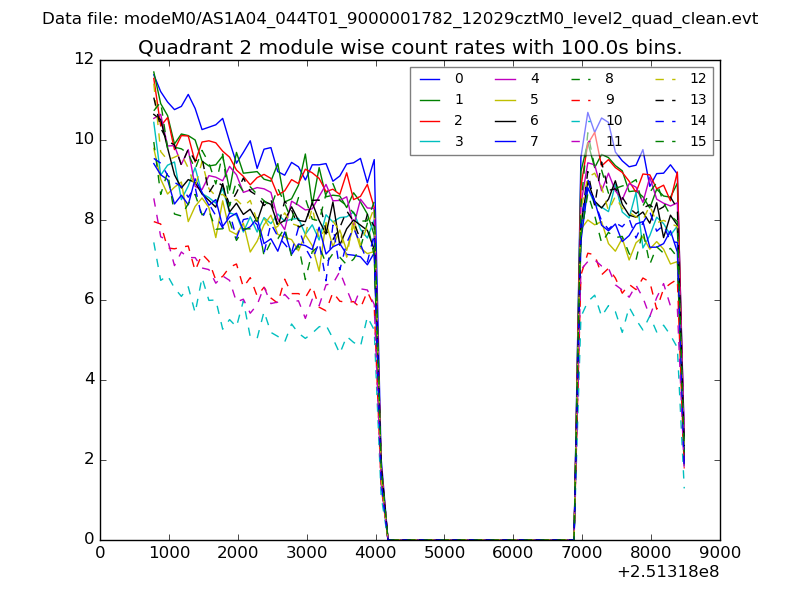
| Module-wise count rates for Quadrant B Data is divided into 100 sec bins |
 |
 |
| Module-wise count rates for Quadrant C Data is divided into 100 sec bins |
 |
 |
| Module-wise count rates for Quadrant D Data is divided into 100 sec bins |
 |
 |
| Parameter | Plot |
|---|---|
| CZT HV Monitor | 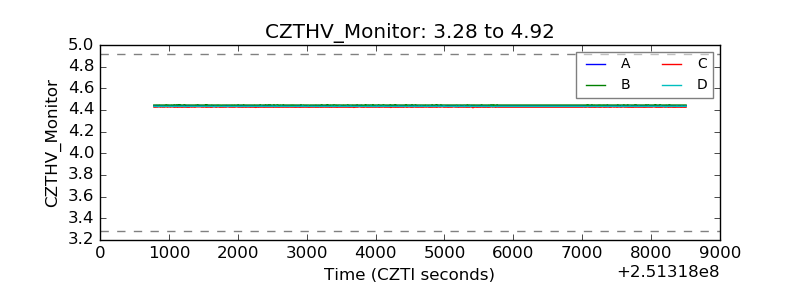 |
| D_VDD | 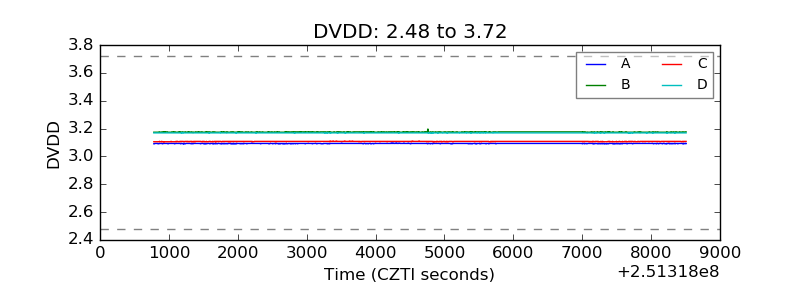 |
| Temperature 1 | 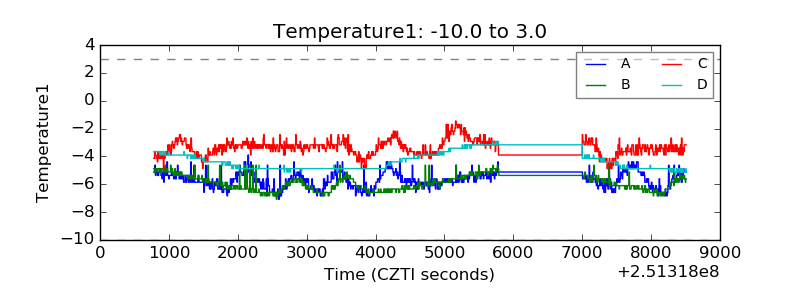 |
| Veto HV Monitor | 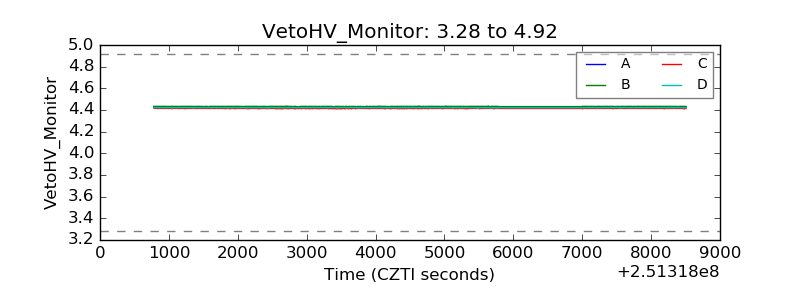 |
| Veto LLD | 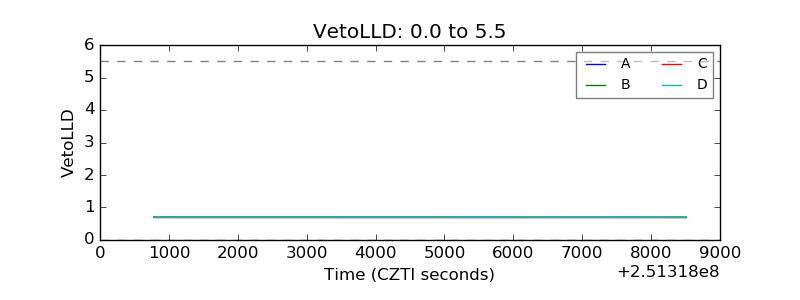 |
| Alpha Counter | 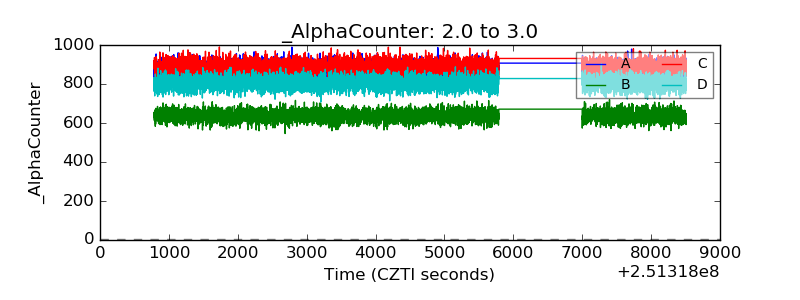 |
| _CPM_Rate | 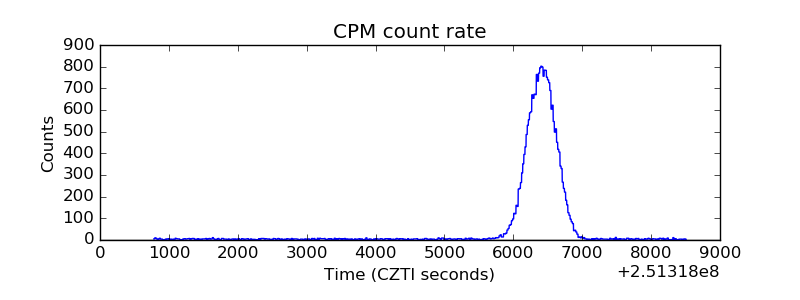 |
| CZT Counter | 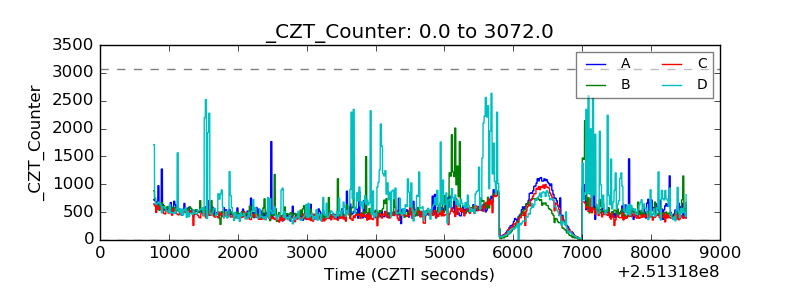 |
| +2.5 Volts monitor |  |
| +5 Volts monitor |  |
| _ROLL_ROT | 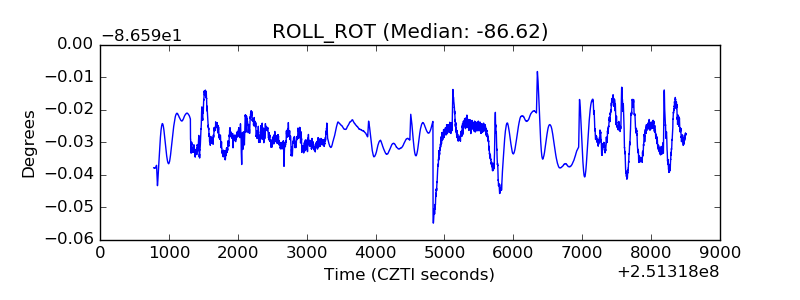 |
| _Roll_DEC | 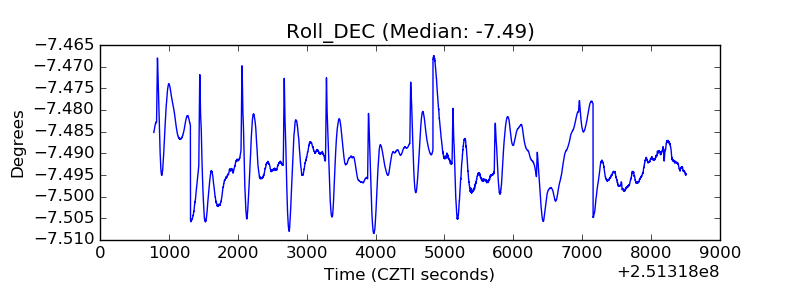 |
| _Roll_RA | 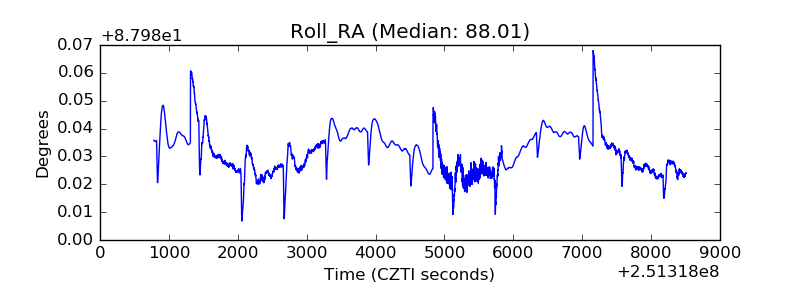 |
| Veto Counter | 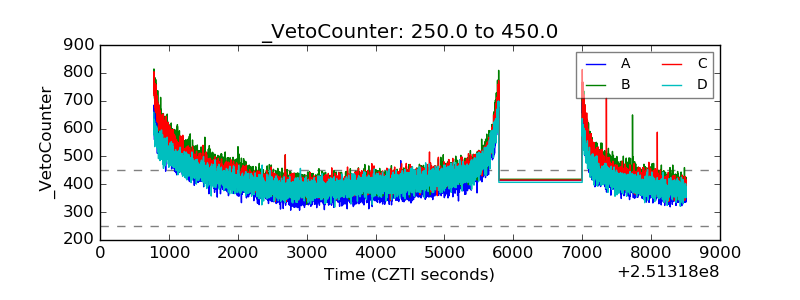 |