| Param | Original file | Final file |
|---|---|---|
| Filename | modeM0/AS1A04_044T01_9000001782_12030cztM0_level2.evt | modeM0/AS1A04_044T01_9000001782_12030cztM0_level2_quad_clean.evt |
| Size (bytes) | 532,486,080 | 89,432,640 |
| Size | 507.8 MB | 85.3 MB |
| Events in quadrant A | 3,908,694 | 567,274 |
| Events in quadrant B | 3,559,464 | 577,535 |
| Events in quadrant C | 3,077,803 | 560,949 |
| Events in quadrant D | 5,119,866 | 529,506 |
| Mode SS | |||
|---|---|---|---|
| Quadrant | BADHDUFLAG | Total packets | Discarded packets |
| A | 0 | 136 | 0 |
| B | 0 | 136 | 0 |
| C | 0 | 136 | 0 |
| D | 0 | 136 | 0 |
| Mode M0 | |||
|---|---|---|---|
| Quadrant | BADHDUFLAG | Total packets | Discarded packets |
| A | 0 | 16088 | 3 |
| B | 0 | 14983 | 2 |
| C | 0 | 13930 | 2 |
| D | 0 | 19993 | 2 |
| Mode M9 | |||
|---|---|---|---|
| Quadrant | BADHDUFLAG | Total packets | Discarded packets |
| A | 0 | 11 | 0 |
| B | 0 | 11 | 0 |
| C | 0 | 11 | 0 |
| D | 0 | 12 | 0 |
| Quadrant | Total seconds | Saturated seconds | Saturation percentage |
|---|---|---|---|
| A | 6791 | 245 | 3.607716% |
| B | 6791 | 129 | 1.899573% |
| C | 6791 | 18 | 0.265057% |
| D | 6791 | 531 | 7.819172% |
Noise dominated data is calculated using 1-second bins in cleaned event files. If a bin has >2000 counts, and if more than 50% of those come from <1% of pixels, then it is considered to be noise-dominated and hence unusable.
| Quadrant | # 1 sec bins | Bins with >0 counts | Bins with >2000 counts | High rate bins dominated by noise | Noise dominated (total time) | Noise dominated (detector-on time) | Marked lightcurve |
|---|---|---|---|---|---|---|---|
| A | 7727 | 6792 | 116 | 116 | 1.50% | 1.71% | 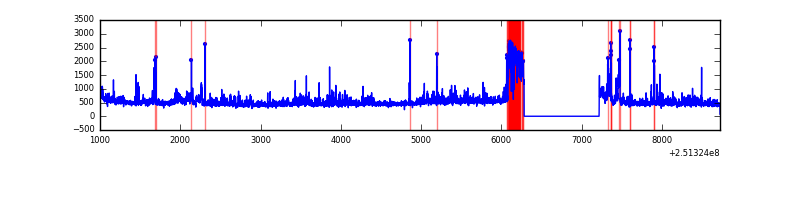 |
| B | 7727 | 6792 | 20 | 20 | 0.26% | 0.29% | 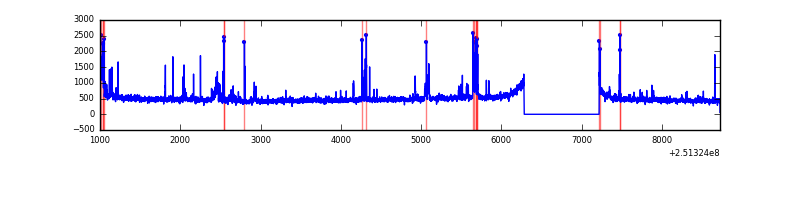 |
| C | 7727 | 6793 | 0 | 0 | 0.00% | 0.00% | 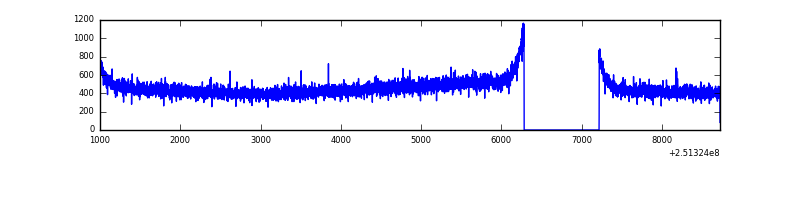 |
| D | 7727 | 6793 | 457 | 457 | 5.91% | 6.73% | 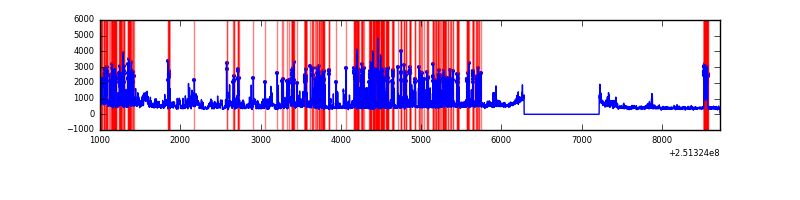 |
Top three noisy pixels from each quadrant. If the there are fewer than three noisy pixels in the level2.evt file, extra rows are filled as -1
| Pixel properties | Quadrant properties | ||||||
|---|---|---|---|---|---|---|---|
| Quadrant | DetID | PixID | Counts | Sigma | Mean | Median | Sigma |
| A | 13 | 248 | 383440 | 2342.57 | 800 | 787 | 163.3 |
| A | 7 | 16 | 119837 | 728.81 | 800 | 787 | 163.3 |
| A | 1 | 162 | 112180 | 681.94 | 800 | 787 | 163.3 |
| B | 4 | 239 | 244668 | 1551.9 | 816 | 796 | 157.1 |
| B | 0 | 85 | 72808 | 458.25 | 816 | 796 | 157.1 |
| B | 15 | 204 | 59708 | 374.89 | 816 | 796 | 157.1 |
| C | 13 | 61 | 5630 | 26.14 | 789 | 793 | 185.0 |
| C | 3 | 202 | 1907 | 6.02 | 789 | 793 | 185.0 |
| C | -1 | -1 | -1 | -1.0 | 789 | 793 | 185.0 |
| D | 1 | 52 | 2099874 | 11592.34 | 758 | 739 | 181.1 |
| D | 10 | 50 | 30890 | 166.51 | 758 | 739 | 181.1 |
| D | 13 | 122 | 29227 | 157.32 | 758 | 739 | 181.1 |
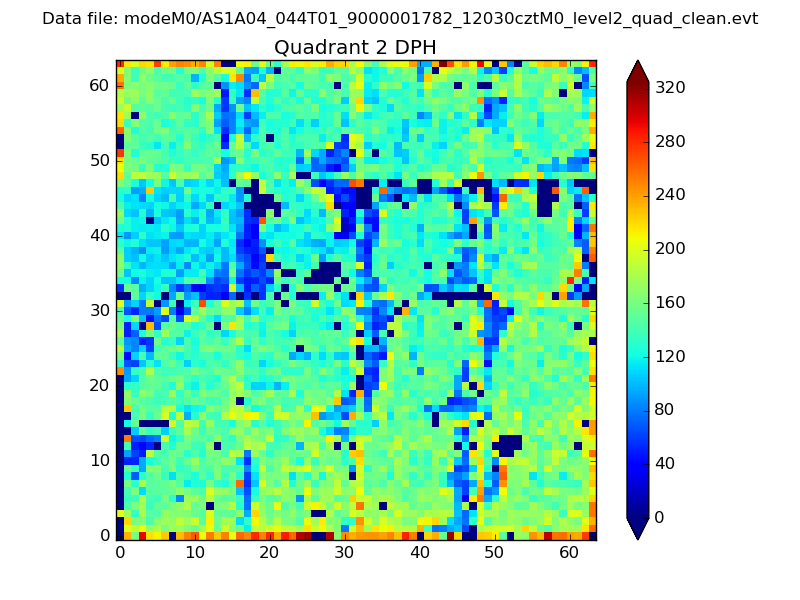
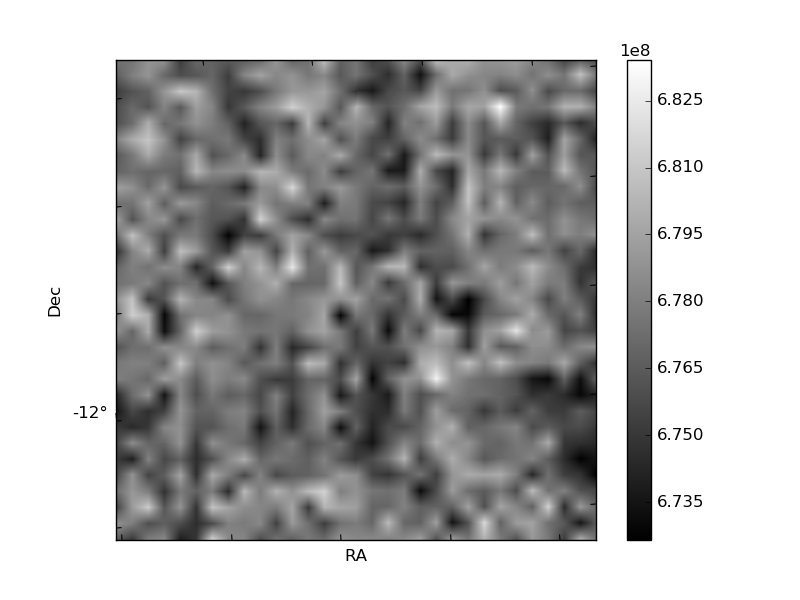
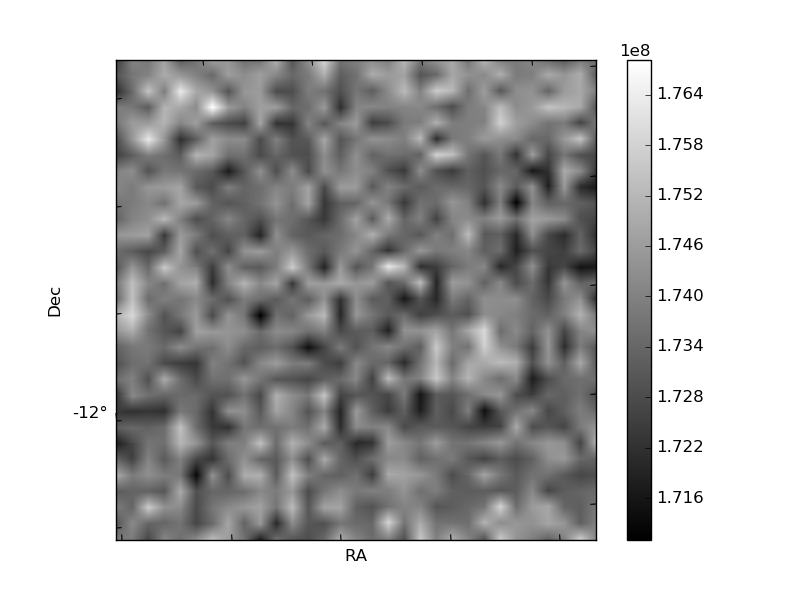
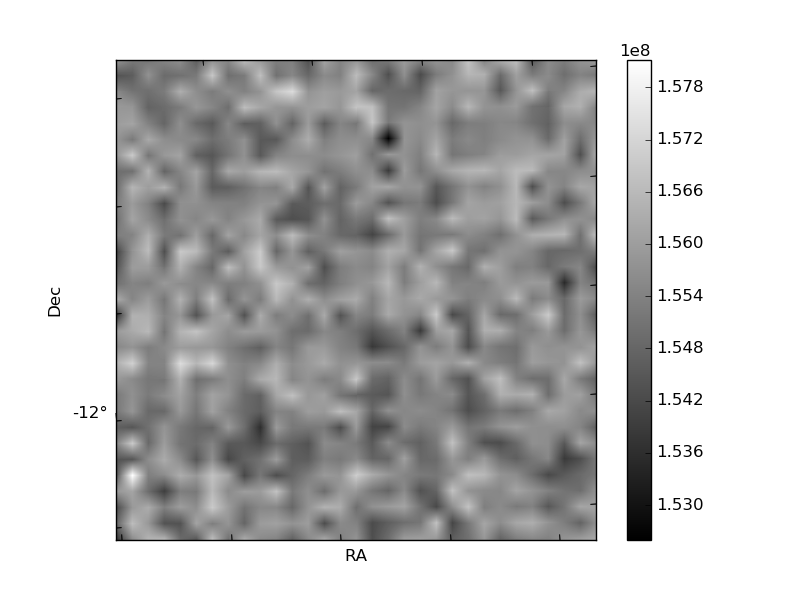
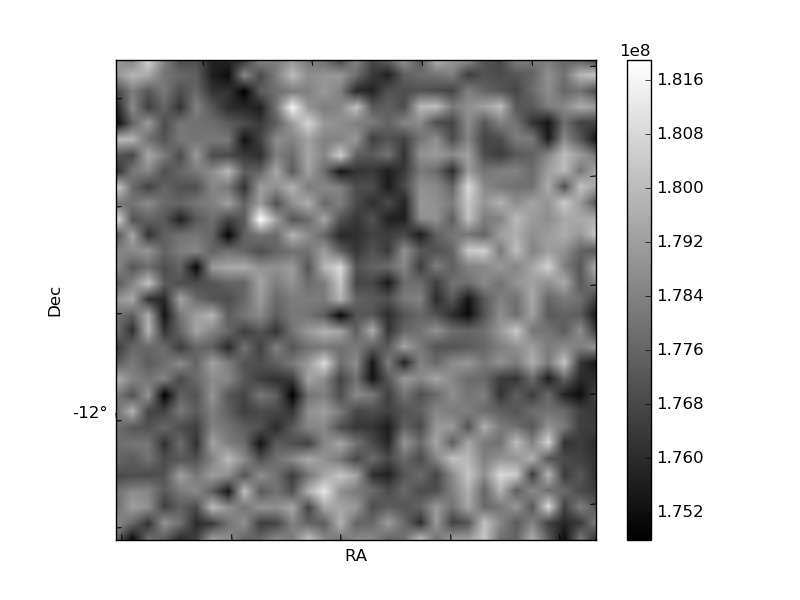
Histogram calculated using DETX and DETY for each event in the final _common_clean file
| Quadrant A | 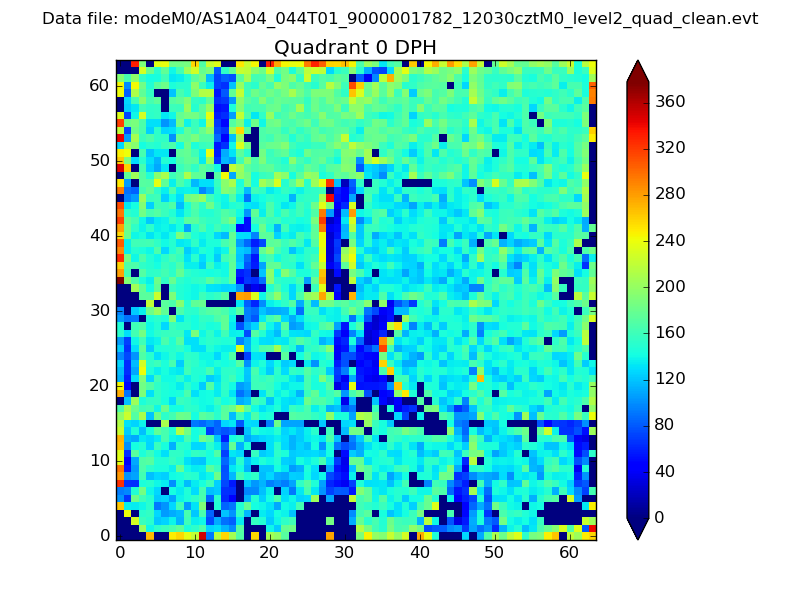 |
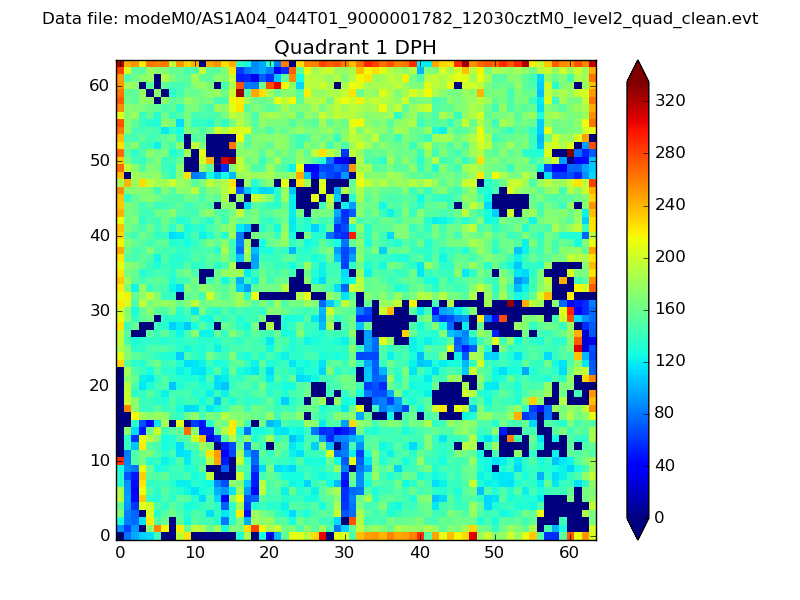 |
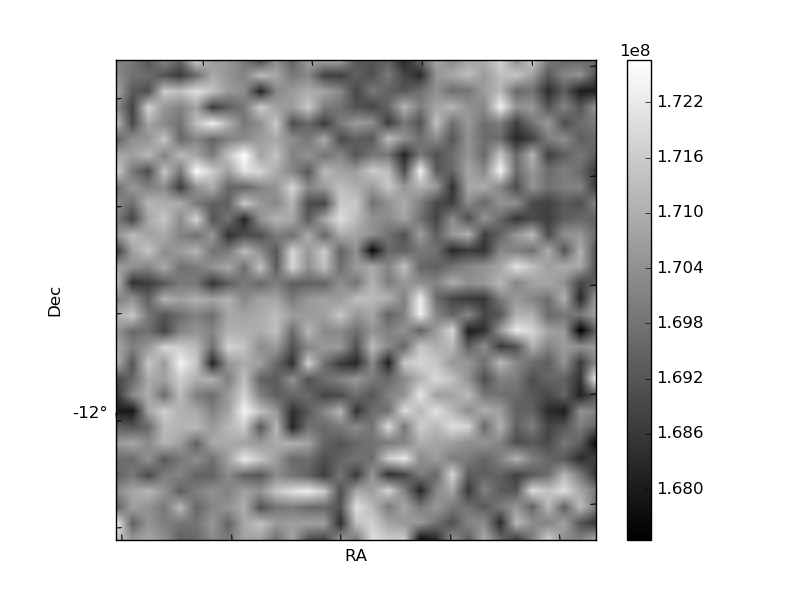
Quadrant B |
|---|---|---|---|
| Quadrant D | 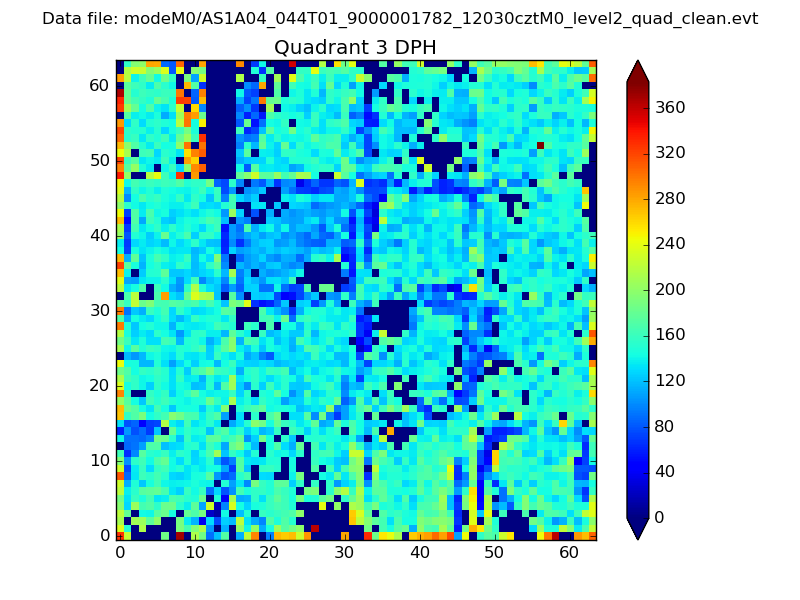 |
 |
Quadrant C |
| Plot type | Count rate plots | Images |
|---|---|---|
| Comparison with Poisson distribution Blue bars denote a histogram of data divided into 1 sec bins. Red curve is a Poisson curve with rate = median count rate of data. |
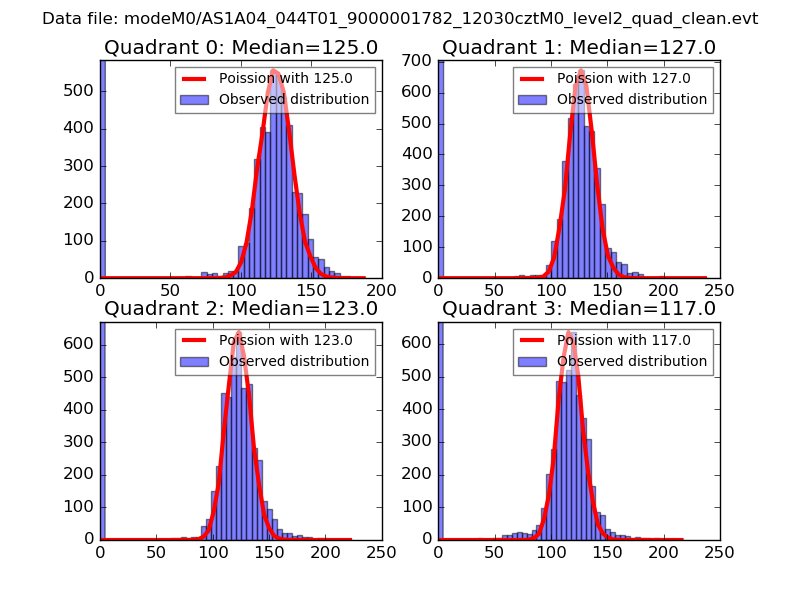 |
 |
| Quadrant-wise count rates Data is divided into 100 sec bins |
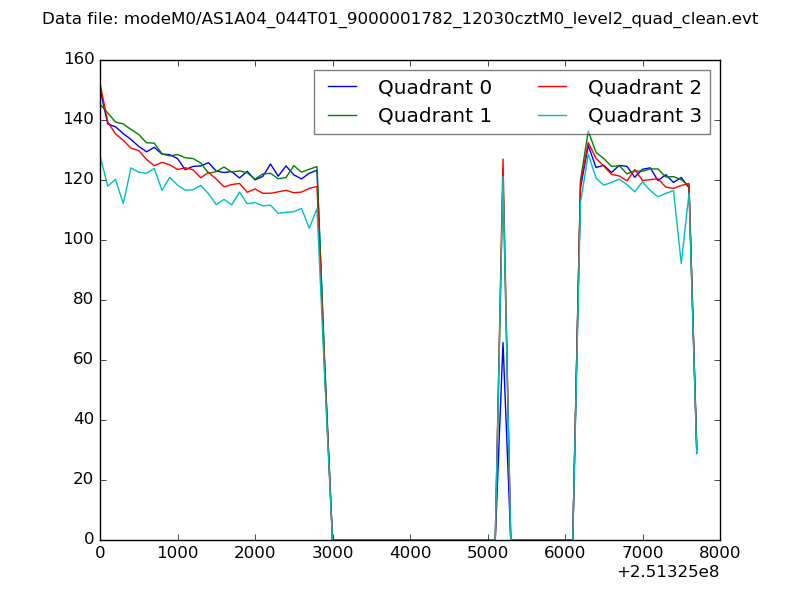 |
|
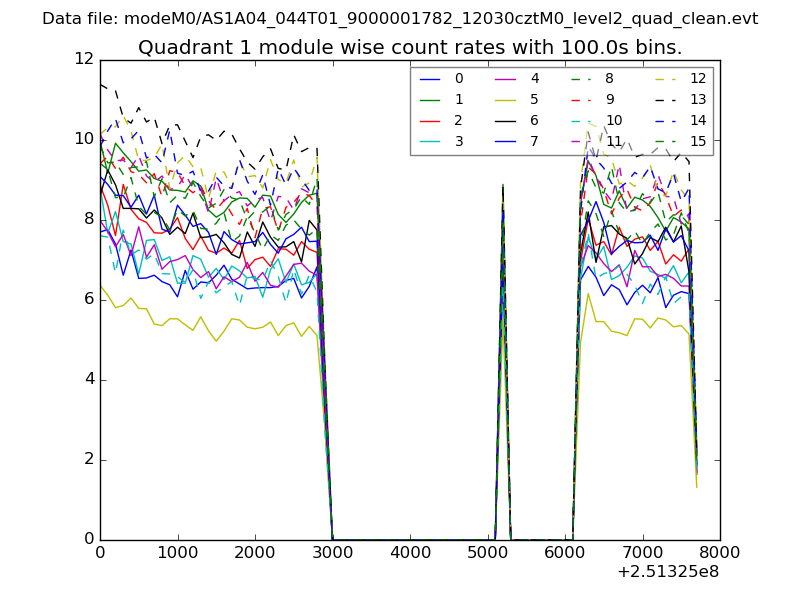
| Module-wise count rates for Quadrant A Data is divided into 100 sec bins |
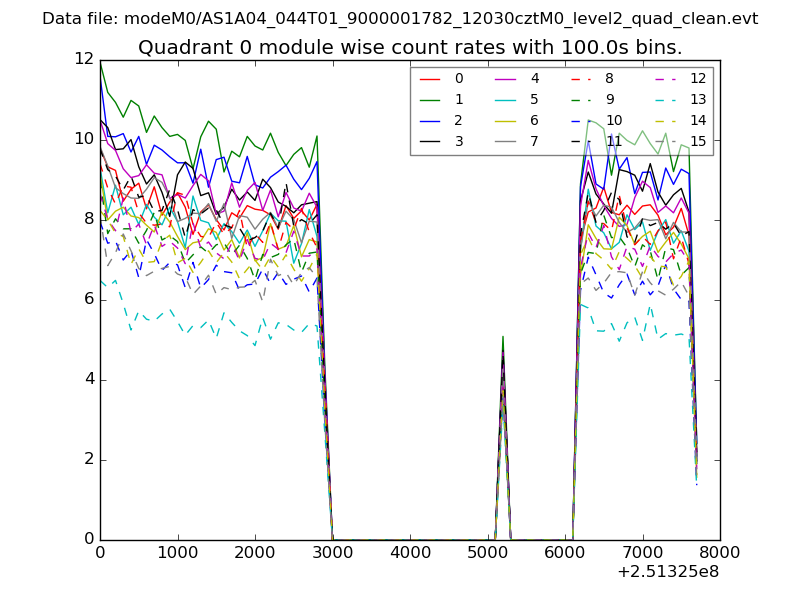 |
 |
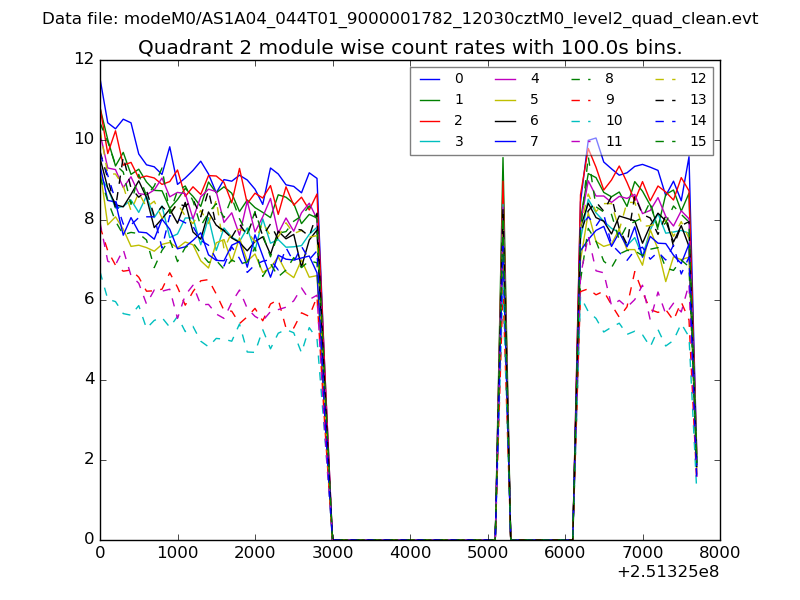
| Module-wise count rates for Quadrant B Data is divided into 100 sec bins |
 |
 |
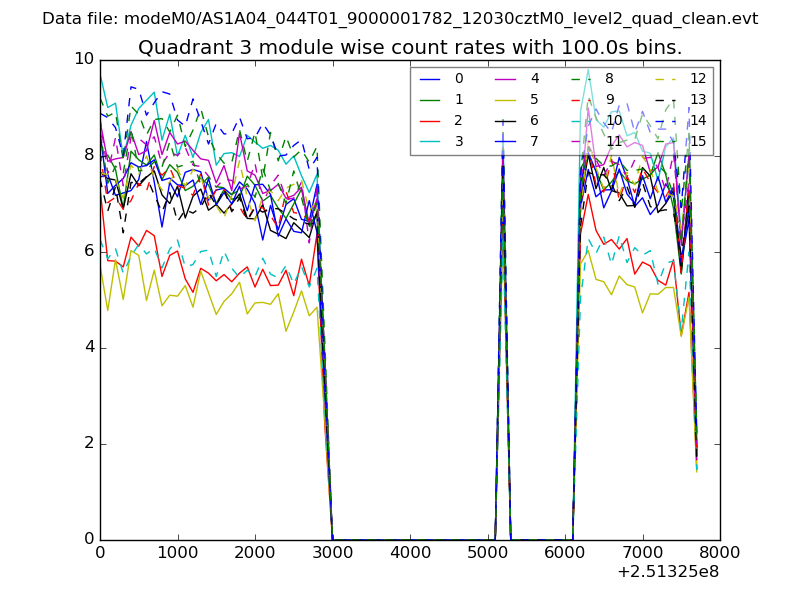
| Module-wise count rates for Quadrant C Data is divided into 100 sec bins |
 |
 |
| Module-wise count rates for Quadrant D Data is divided into 100 sec bins |
 |
 |
| Parameter | Plot |
|---|---|
| CZT HV Monitor | 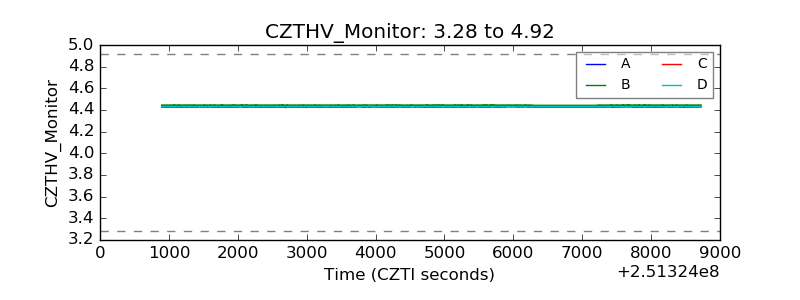 |
| D_VDD | 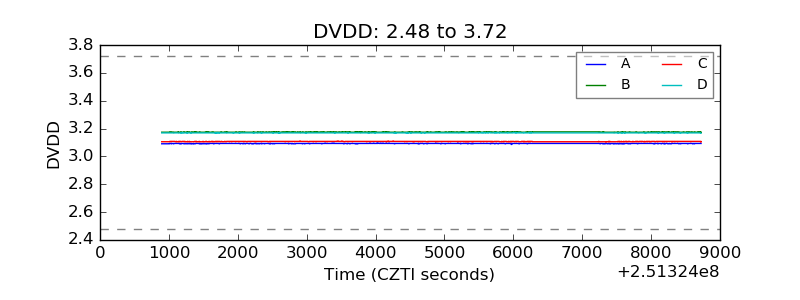 |
| Temperature 1 | 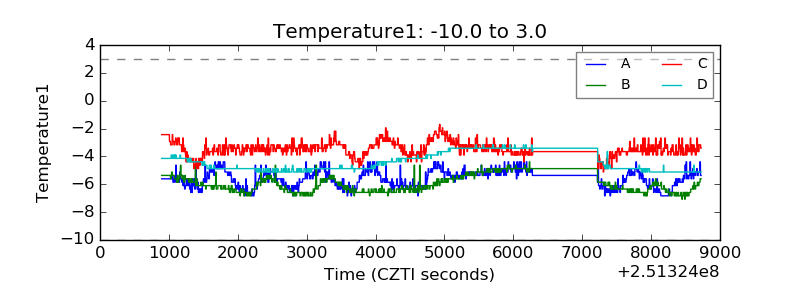 |
| Veto HV Monitor | 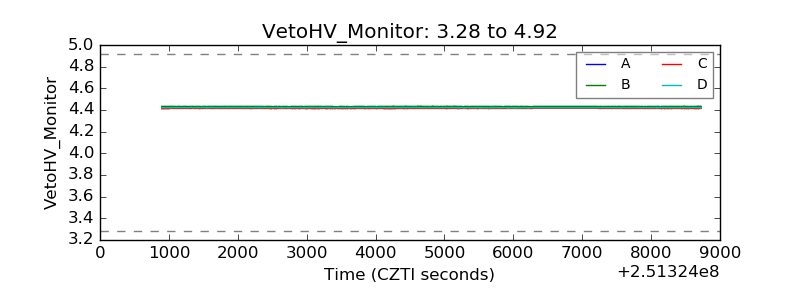 |
| Veto LLD | 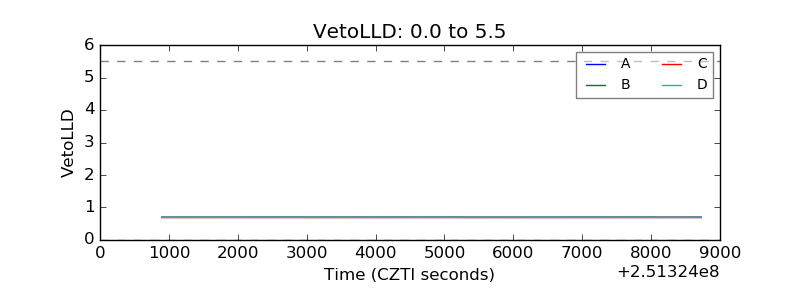 |
| Alpha Counter | 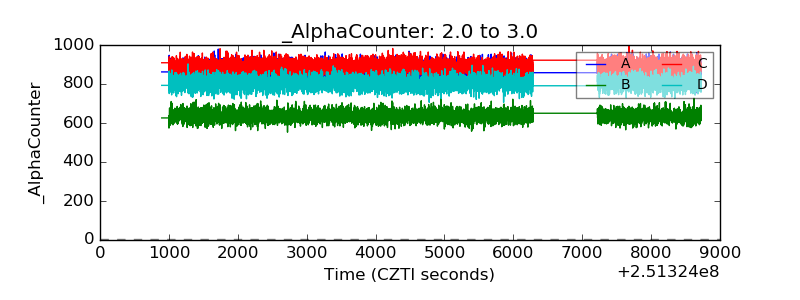 |
| _CPM_Rate | 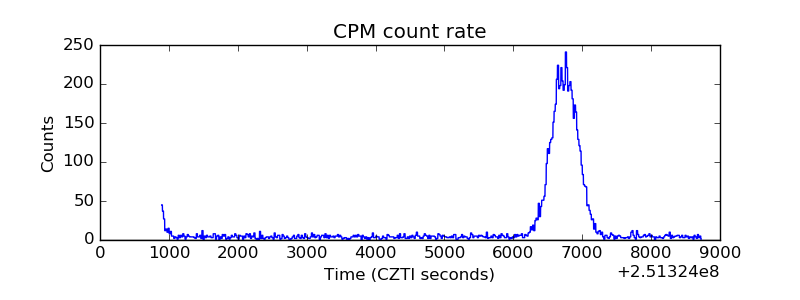 |
| CZT Counter | 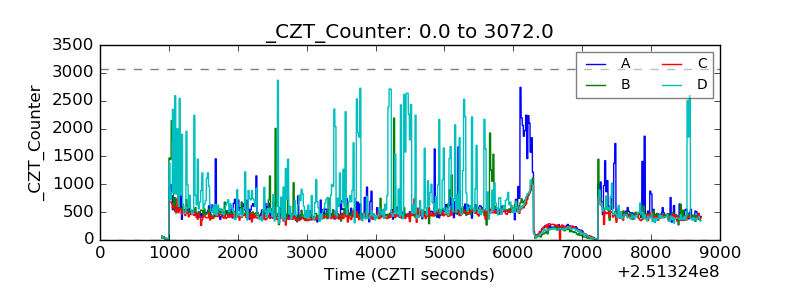 |
| +2.5 Volts monitor | 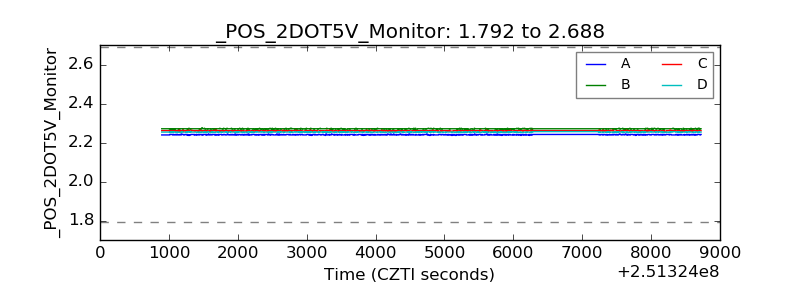 |
| +5 Volts monitor | 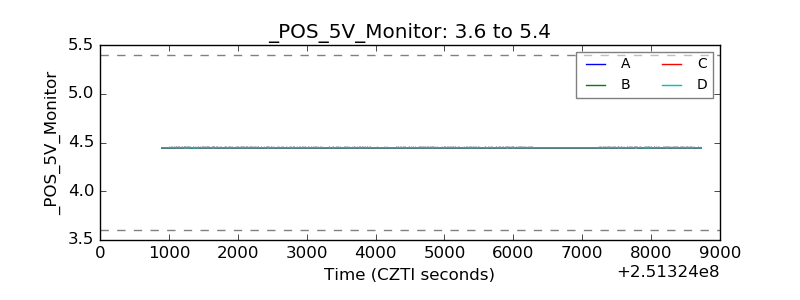 |
| _ROLL_ROT | 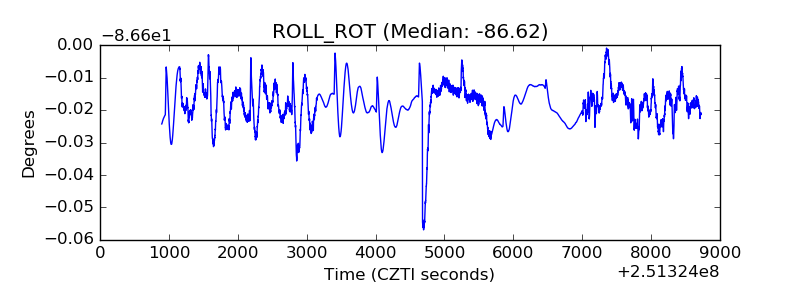 |
| _Roll_DEC | 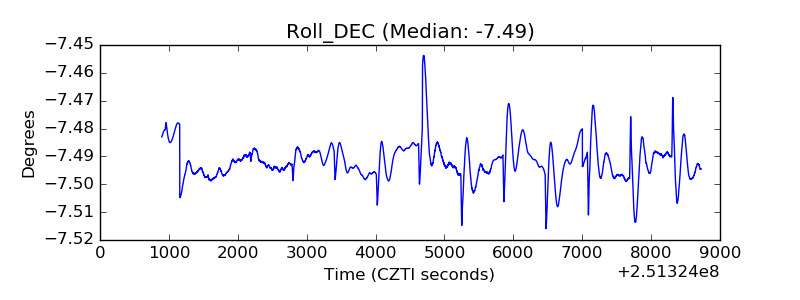 |
| _Roll_RA | 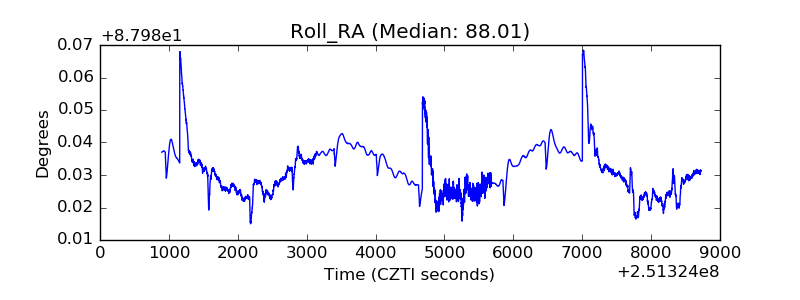 |
| Veto Counter | 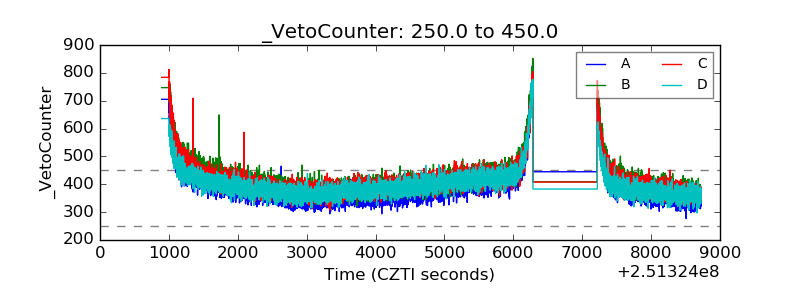 |