| Param | Original file | Final file |
|---|---|---|
| Filename | modeM0/AS1A04_044T01_9000001782_12031cztM0_level2.evt | modeM0/AS1A04_044T01_9000001782_12031cztM0_level2_quad_clean.evt |
| Size (bytes) | 478,728,000 | 95,569,920 |
| Size | 456.6 MB | 91.1 MB |
| Events in quadrant A | 3,891,451 | 606,019 |
| Events in quadrant B | 3,497,710 | 612,850 |
| Events in quadrant C | 3,229,025 | 597,156 |
| Events in quadrant D | 3,393,740 | 579,705 |
| Mode SS | |||
|---|---|---|---|
| Quadrant | BADHDUFLAG | Total packets | Discarded packets |
| A | 0 | 144 | 0 |
| B | 0 | 144 | 0 |
| C | 0 | 144 | 0 |
| D | 0 | 144 | 0 |
| Mode M0 | |||
|---|---|---|---|
| Quadrant | BADHDUFLAG | Total packets | Discarded packets |
| A | 0 | 16205 | 3 |
| B | 0 | 15101 | 2 |
| C | 0 | 14664 | 2 |
| D | 0 | 15297 | 2 |
| Mode M9 | |||
|---|---|---|---|
| Quadrant | BADHDUFLAG | Total packets | Discarded packets |
| A | 0 | 11 | 0 |
| B | 0 | 11 | 0 |
| C | 0 | 11 | 0 |
| D | 0 | 12 | 0 |
| Quadrant | Total seconds | Saturated seconds | Saturation percentage |
|---|---|---|---|
| A | 7164 | 84 | 1.172529% |
| B | 7164 | 72 | 1.005025% |
| C | 7164 | 20 | 0.279174% |
| D | 7164 | 64 | 0.893356% |
Noise dominated data is calculated using 1-second bins in cleaned event files. If a bin has >2000 counts, and if more than 50% of those come from <1% of pixels, then it is considered to be noise-dominated and hence unusable.
| Quadrant | # 1 sec bins | Bins with >0 counts | Bins with >2000 counts | High rate bins dominated by noise | Noise dominated (total time) | Noise dominated (detector-on time) | Marked lightcurve |
|---|---|---|---|---|---|---|---|
| A | 7710 | 7166 | 25 | 25 | 0.32% | 0.35% | 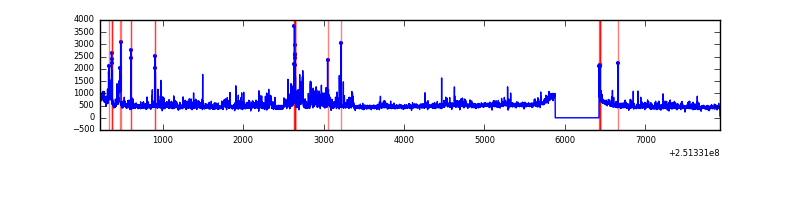 |
| B | 7710 | 7166 | 6 | 6 | 0.08% | 0.08% | 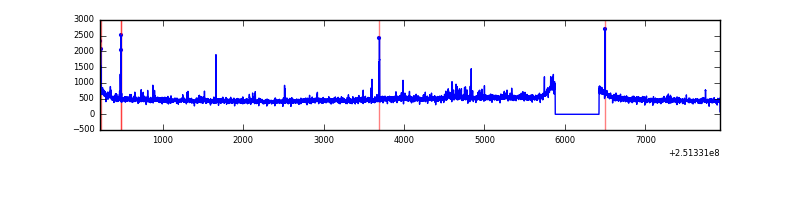 |
| C | 7710 | 7166 | 0 | 0 | 0.00% | 0.00% | 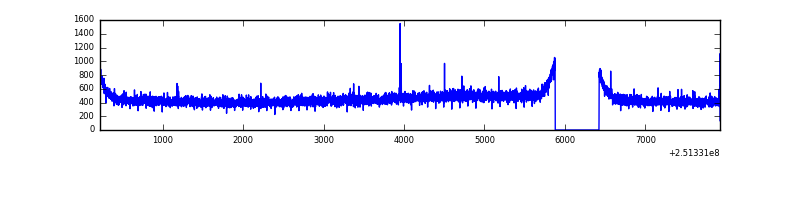 |
| D | 7710 | 7166 | 41 | 41 | 0.53% | 0.57% | 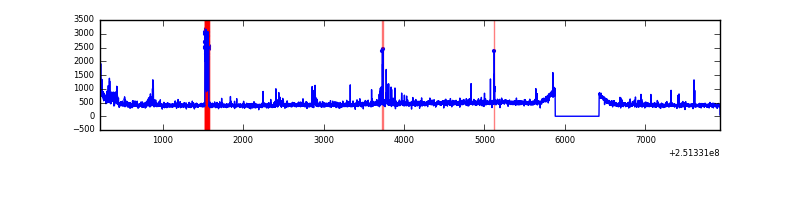 |
Top three noisy pixels from each quadrant. If the there are fewer than three noisy pixels in the level2.evt file, extra rows are filled as -1
| Pixel properties | Quadrant properties | ||||||
|---|---|---|---|---|---|---|---|
| Quadrant | DetID | PixID | Counts | Sigma | Mean | Median | Sigma |
| A | 13 | 248 | 309612 | 1783.45 | 850 | 833 | 173.1 |
| A | 1 | 162 | 95298 | 545.61 | 850 | 833 | 173.1 |
| A | 1 | 178 | 50131 | 284.74 | 850 | 833 | 173.1 |
| B | 15 | 204 | 56612 | 338.17 | 851 | 830 | 165.0 |
| B | 0 | 85 | 54273 | 323.99 | 851 | 830 | 165.0 |
| B | 4 | 239 | 51164 | 305.14 | 851 | 830 | 165.0 |
| C | 14 | 234 | 6103 | 27.32 | 826 | 829 | 193.0 |
| C | 13 | 61 | 5869 | 26.11 | 826 | 829 | 193.0 |
| C | 8 | 222 | 2682 | 9.6 | 826 | 829 | 193.0 |
| D | 1 | 52 | 220352 | 1128.85 | 819 | 799 | 194.5 |
| D | 10 | 50 | 25613 | 127.58 | 819 | 799 | 194.5 |
| D | 8 | 195 | 24107 | 119.84 | 819 | 799 | 194.5 |
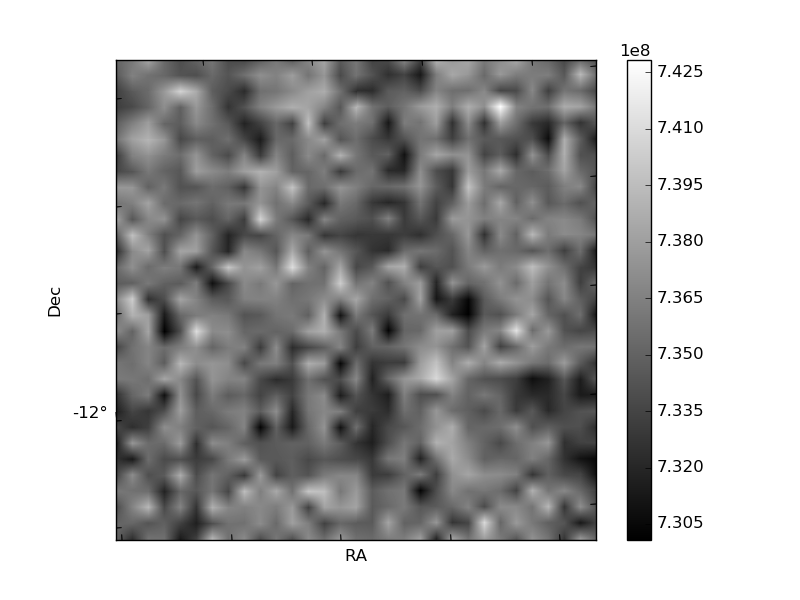
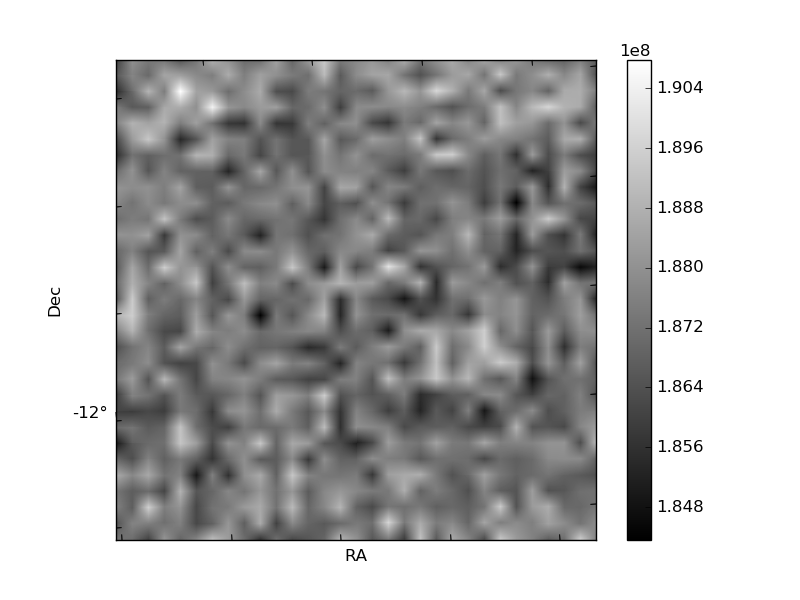
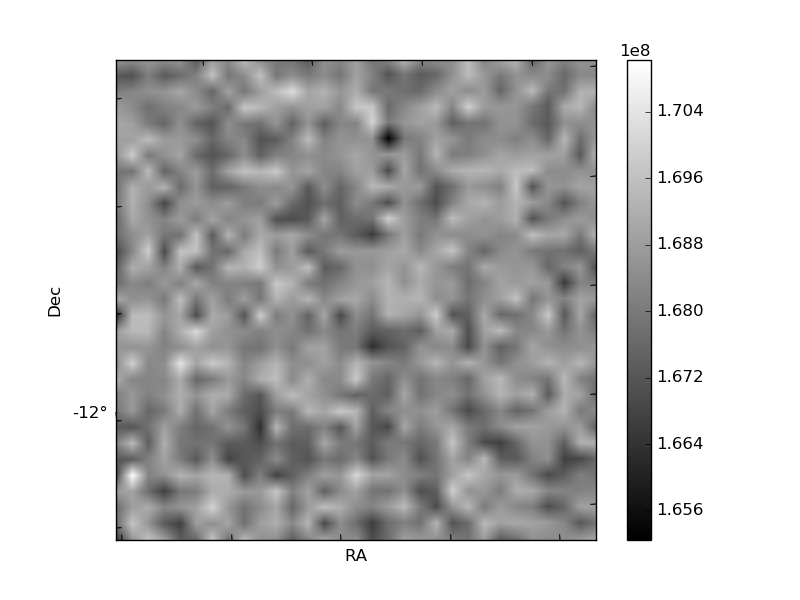
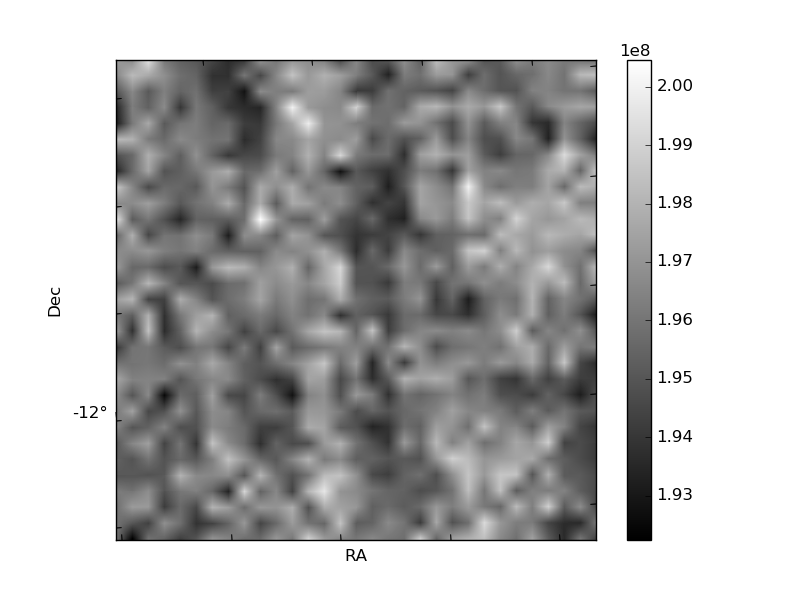
Histogram calculated using DETX and DETY for each event in the final _common_clean file
| Quadrant A | 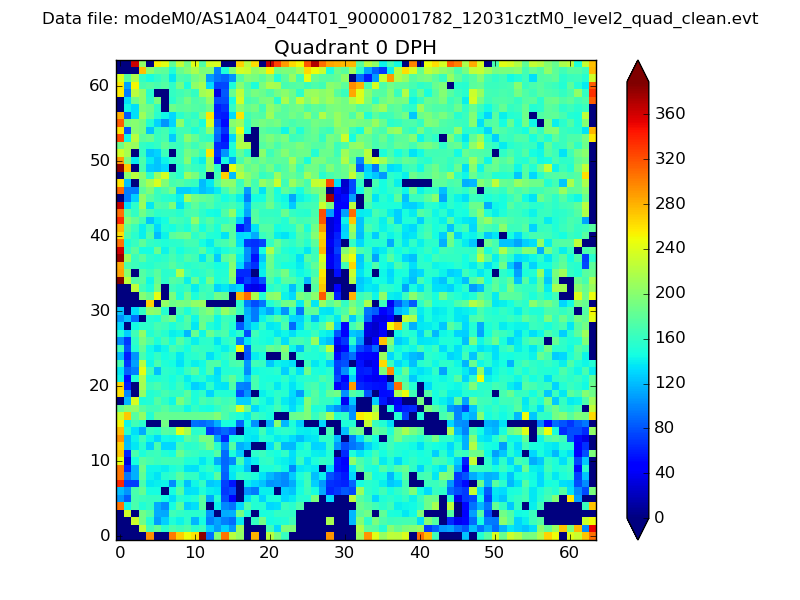 |
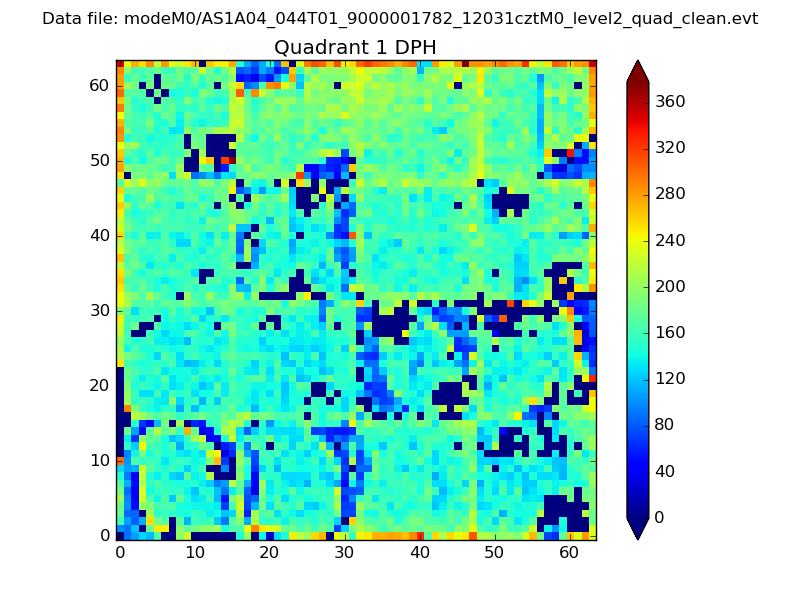 |
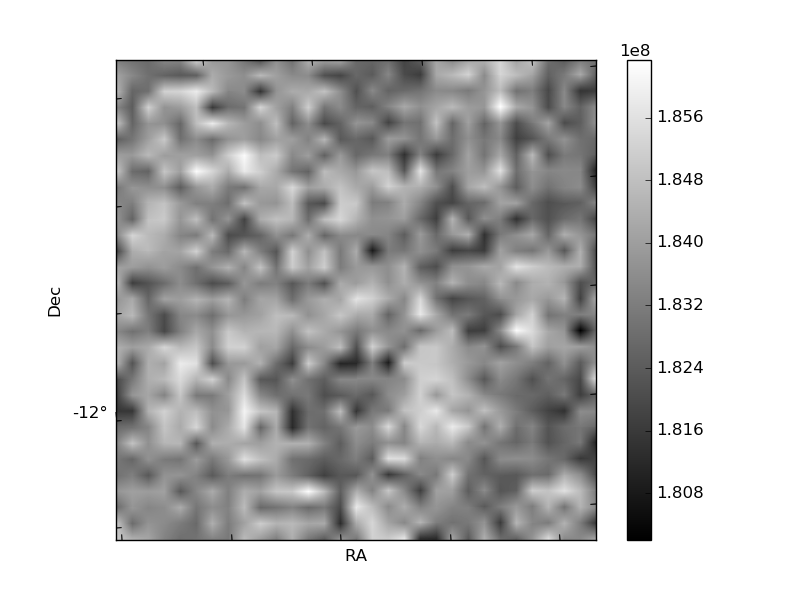
Quadrant B |
|---|---|---|---|
| Quadrant D | 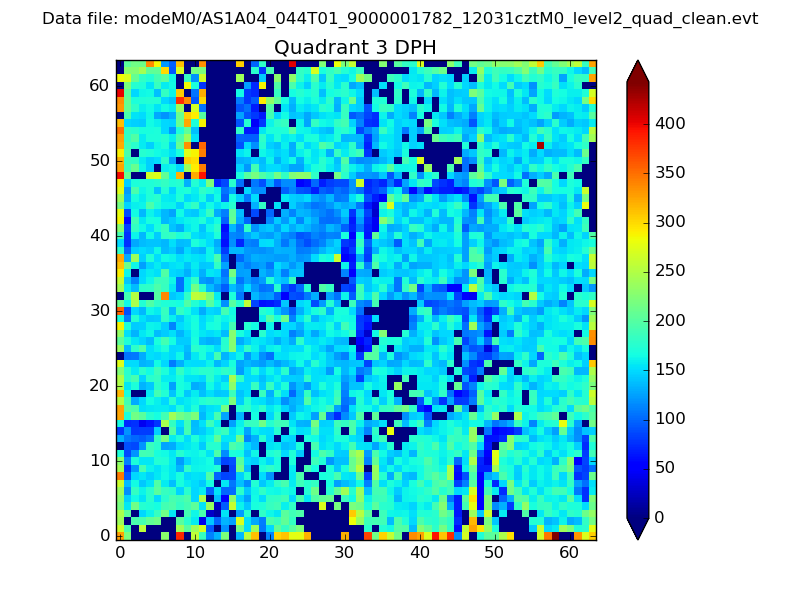 |
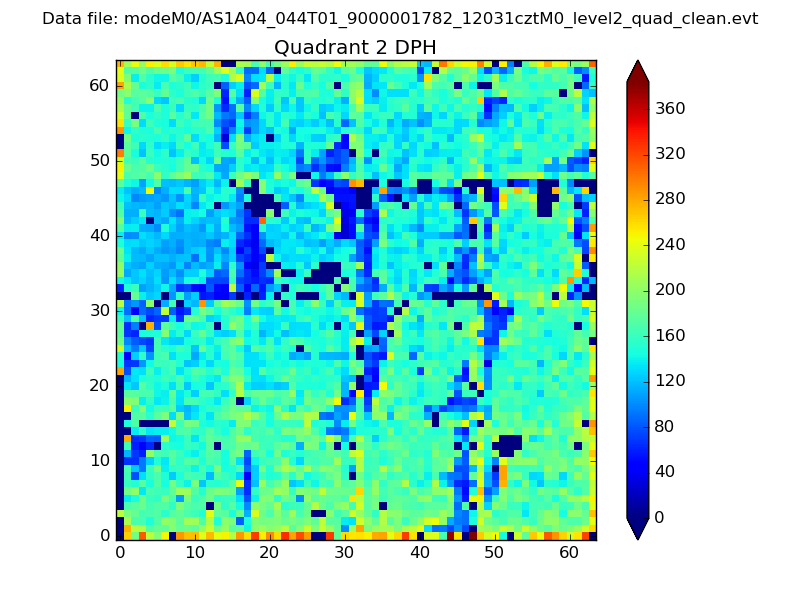 |
Quadrant C |
| Plot type | Count rate plots | Images |
|---|---|---|
| Comparison with Poisson distribution Blue bars denote a histogram of data divided into 1 sec bins. Red curve is a Poisson curve with rate = median count rate of data. |
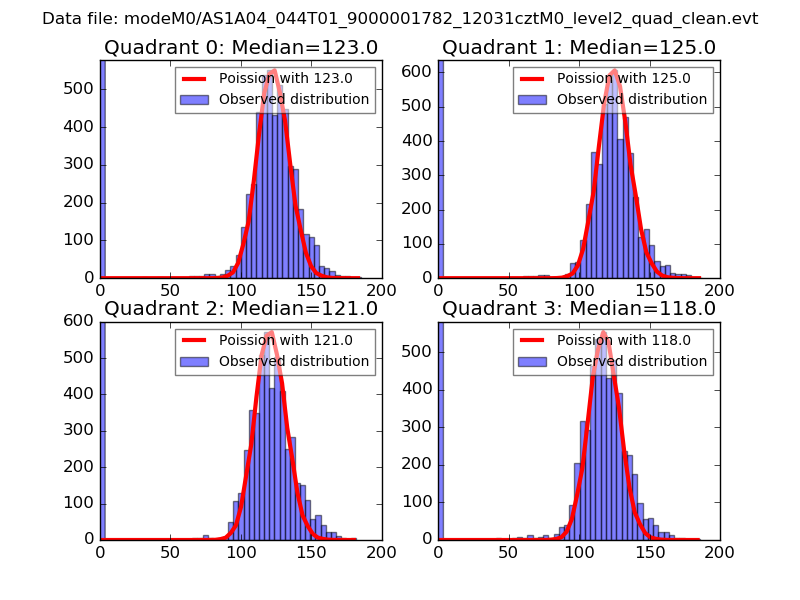 |
 |
| Quadrant-wise count rates Data is divided into 100 sec bins |
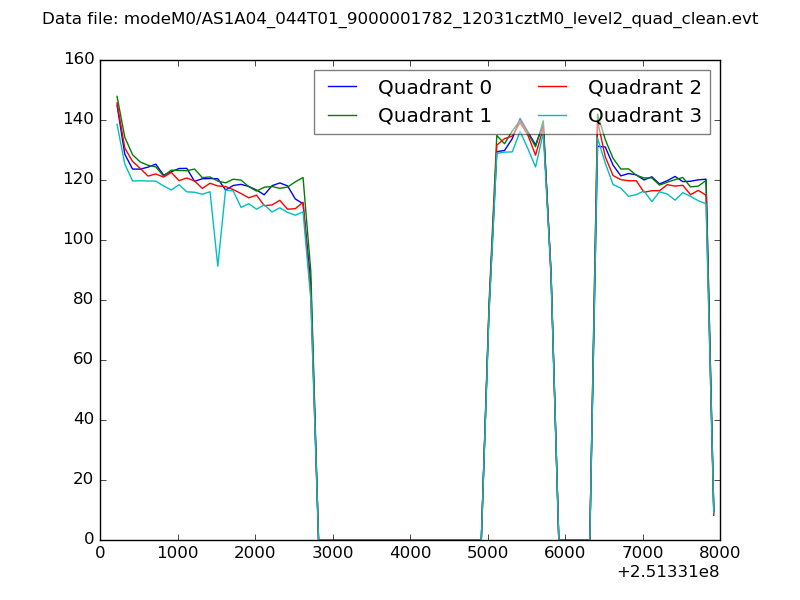 |
|
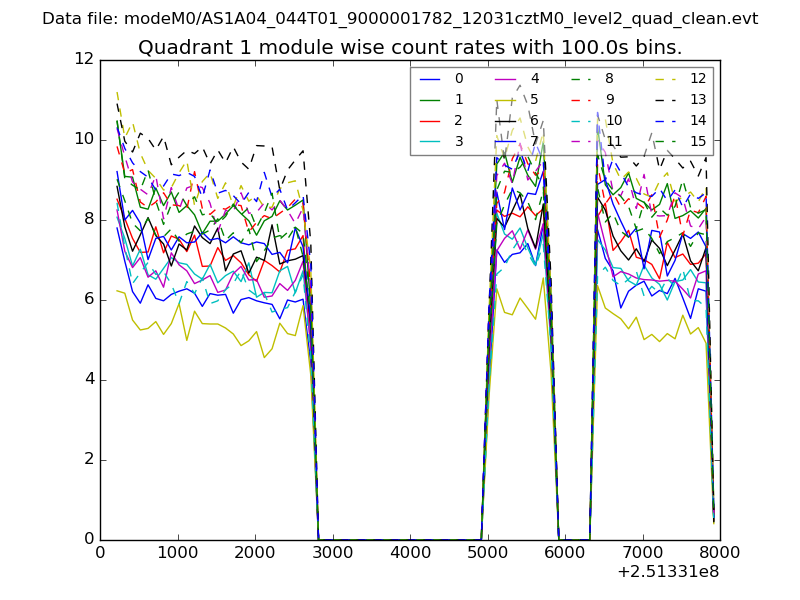
| Module-wise count rates for Quadrant A Data is divided into 100 sec bins |
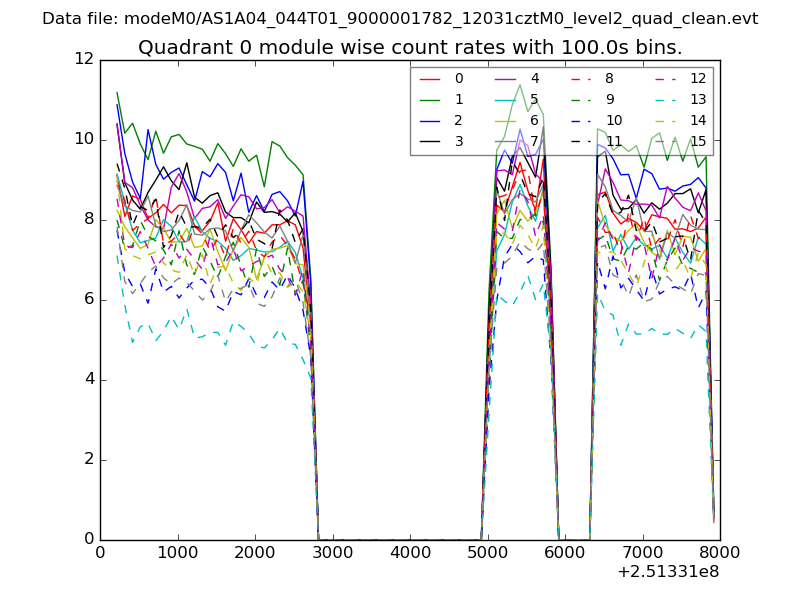 |
 |
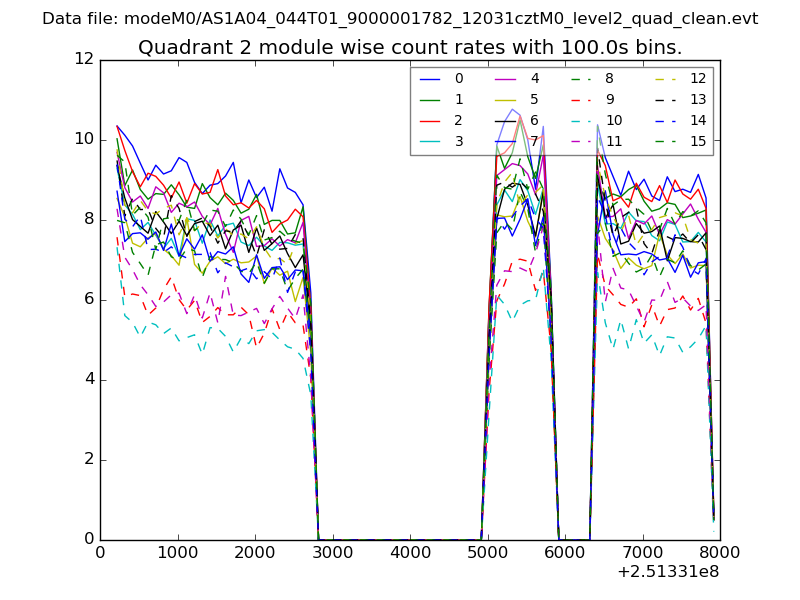
| Module-wise count rates for Quadrant B Data is divided into 100 sec bins |
 |
 |
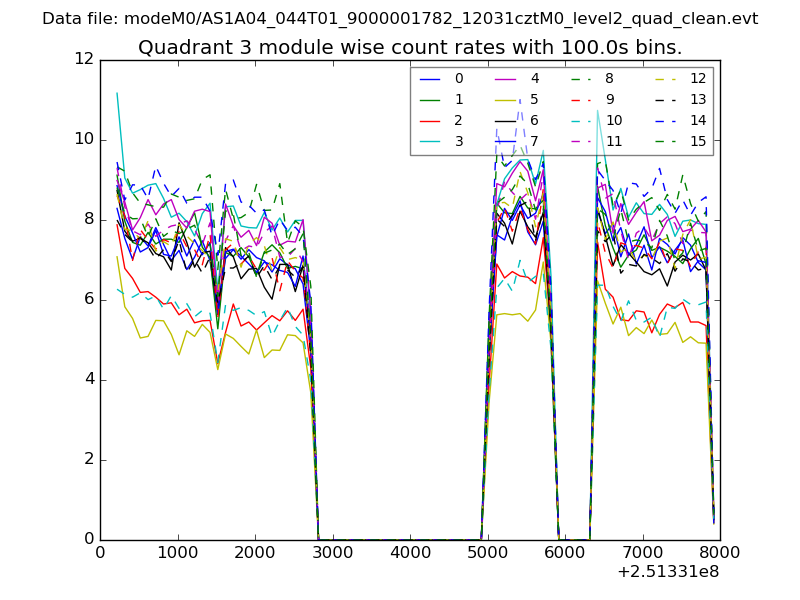
| Module-wise count rates for Quadrant C Data is divided into 100 sec bins |
 |
 |
| Module-wise count rates for Quadrant D Data is divided into 100 sec bins |
 |
 |
| Parameter | Plot |
|---|---|
| CZT HV Monitor | 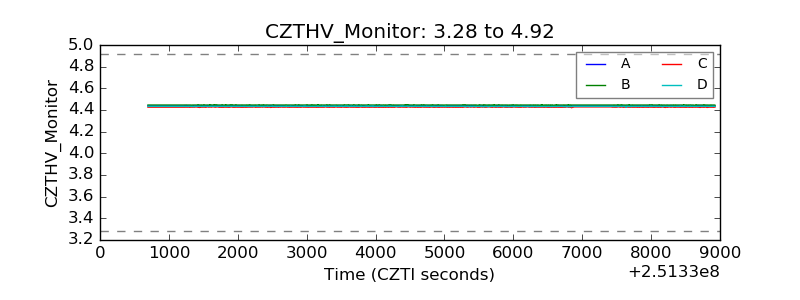 |
| D_VDD | 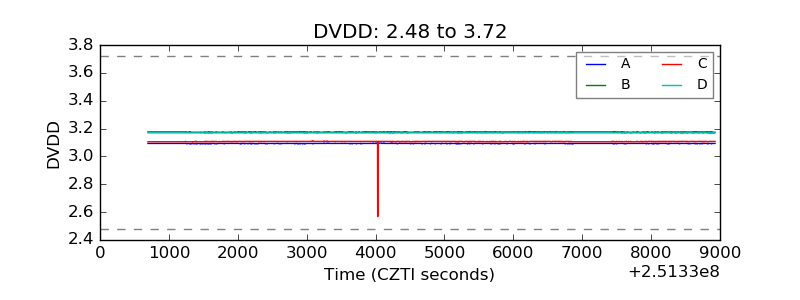 |
| Temperature 1 |  |
| Veto HV Monitor |  |
| Veto LLD | 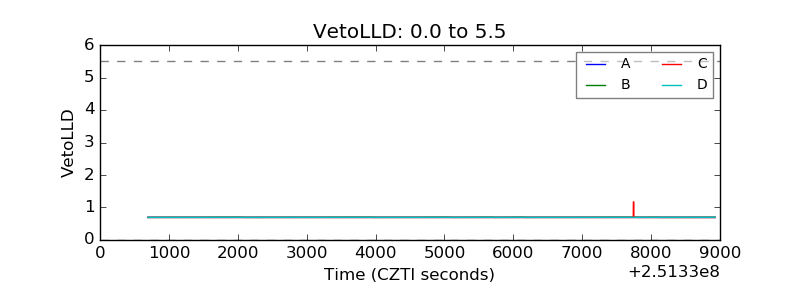 |
| Alpha Counter | 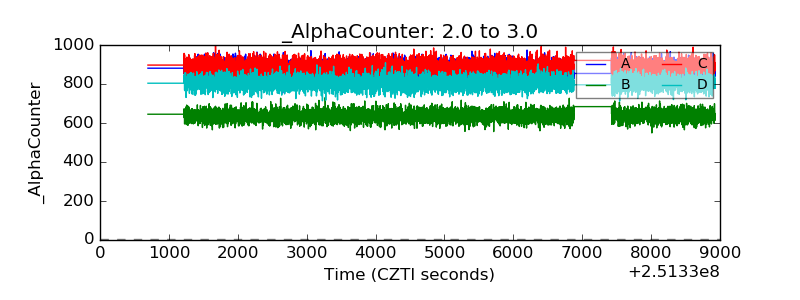 |
| _CPM_Rate | 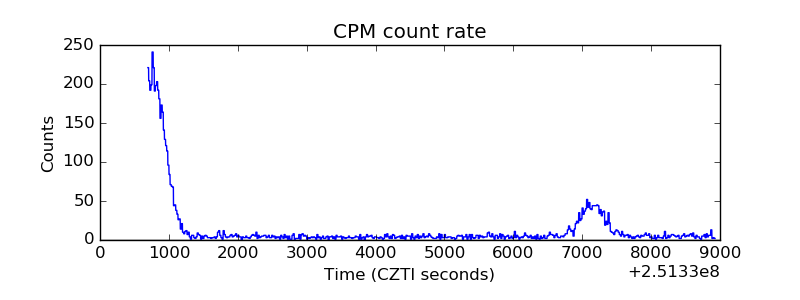 |
| CZT Counter | 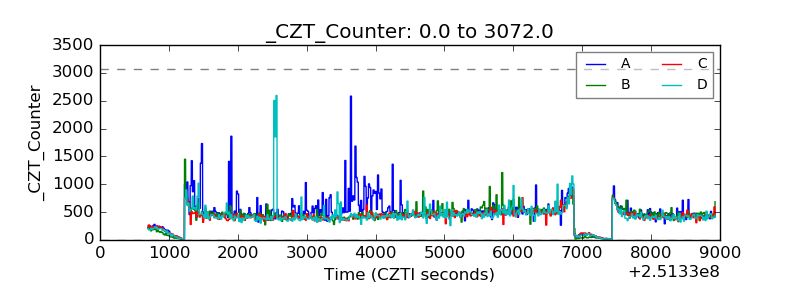 |
| +2.5 Volts monitor |  |
| +5 Volts monitor | 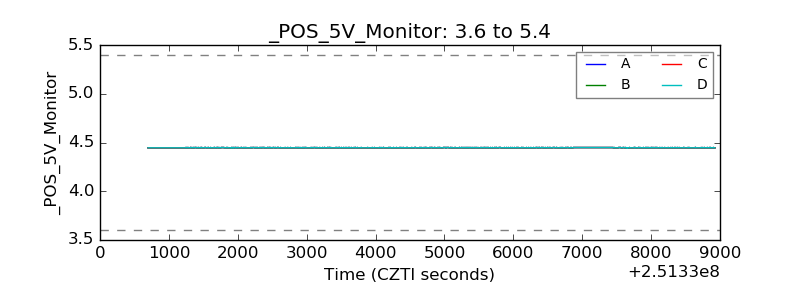 |
| _ROLL_ROT | 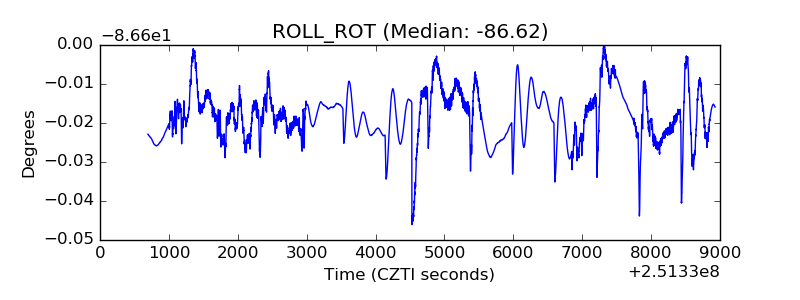 |
| _Roll_DEC | 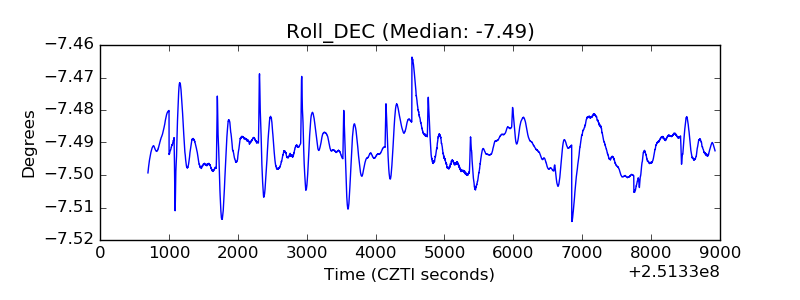 |
| _Roll_RA | 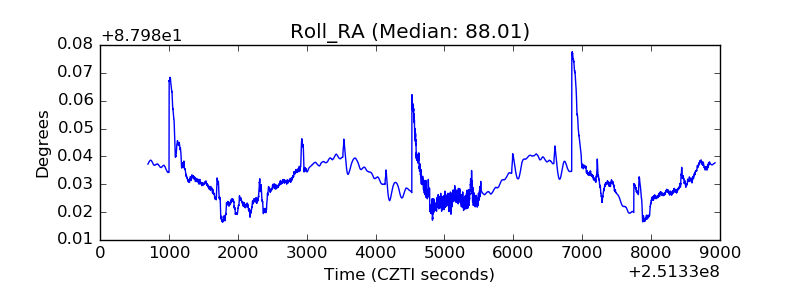 |
| Veto Counter | 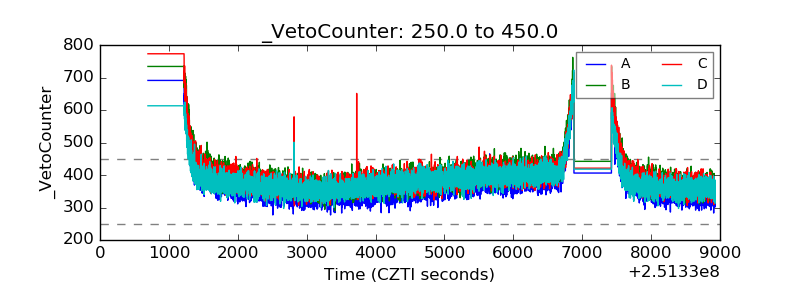 |