| Param | Original file | Final file |
|---|---|---|
| Filename | modeM0/AS1A04_044T01_9000001782_12032cztM0_level2.evt | modeM0/AS1A04_044T01_9000001782_12032cztM0_level2_quad_clean.evt |
| Size (bytes) | 505,088,640 | 105,675,840 |
| Size | 481.7 MB | 100.8 MB |
| Events in quadrant A | 3,765,641 | 675,908 |
| Events in quadrant B | 3,785,204 | 680,895 |
| Events in quadrant C | 3,528,706 | 662,163 |
| Events in quadrant D | 3,692,239 | 644,119 |
| Mode SS | |||
|---|---|---|---|
| Quadrant | BADHDUFLAG | Total packets | Discarded packets |
| A | 0 | 158 | 0 |
| B | 0 | 158 | 0 |
| C | 0 | 158 | 0 |
| D | 0 | 158 | 0 |
| Mode M0 | |||
|---|---|---|---|
| Quadrant | BADHDUFLAG | Total packets | Discarded packets |
| A | 0 | 16350 | 3 |
| B | 0 | 16280 | 2 |
| C | 0 | 15983 | 2 |
| D | 0 | 16645 | 2 |
| Mode M9 | |||
|---|---|---|---|
| Quadrant | BADHDUFLAG | Total packets | Discarded packets |
| A | 0 | 8 | 0 |
| B | 0 | 8 | 0 |
| C | 0 | 8 | 0 |
| D | 0 | 8 | 0 |
| Quadrant | Total seconds | Saturated seconds | Saturation percentage |
|---|---|---|---|
| A | 7727 | 95 | 1.229455% |
| B | 7727 | 127 | 1.643587% |
| C | 7727 | 56 | 0.724731% |
| D | 7727 | 72 | 0.931798% |
Noise dominated data is calculated using 1-second bins in cleaned event files. If a bin has >2000 counts, and if more than 50% of those come from <1% of pixels, then it is considered to be noise-dominated and hence unusable.
| Quadrant | # 1 sec bins | Bins with >0 counts | Bins with >2000 counts | High rate bins dominated by noise | Noise dominated (total time) | Noise dominated (detector-on time) | Marked lightcurve |
|---|---|---|---|---|---|---|---|
| A | 8493 | 7729 | 8 | 8 | 0.09% | 0.10% | 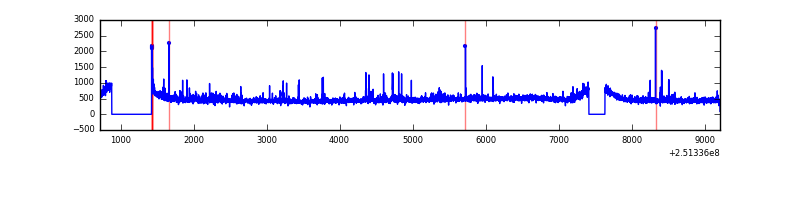 |
| B | 8493 | 7729 | 1 | 1 | 0.01% | 0.01% | 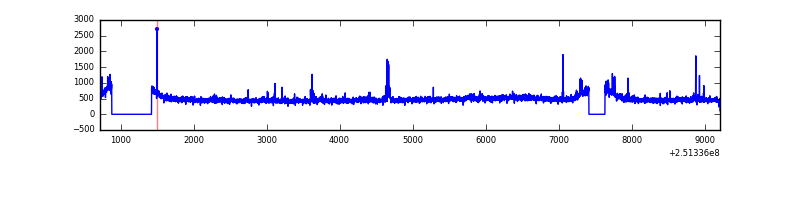 |
| C | 8493 | 7730 | 1 | 1 | 0.01% | 0.01% | 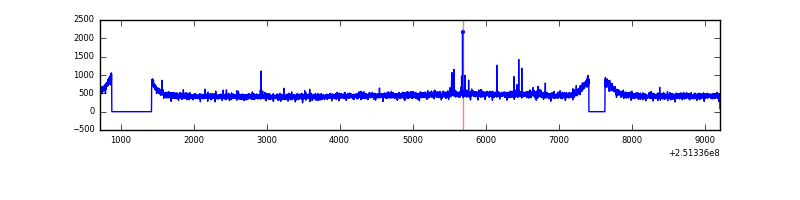 |
| D | 8493 | 7729 | 26 | 26 | 0.31% | 0.34% | 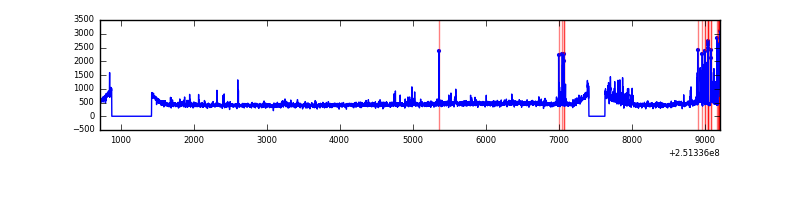 |
Top three noisy pixels from each quadrant. If the there are fewer than three noisy pixels in the level2.evt file, extra rows are filled as -1
| Pixel properties | Quadrant properties | ||||||
|---|---|---|---|---|---|---|---|
| Quadrant | DetID | PixID | Counts | Sigma | Mean | Median | Sigma |
| A | 1 | 162 | 66659 | 348.88 | 924 | 903 | 188.5 |
| A | 1 | 178 | 30942 | 159.38 | 924 | 903 | 188.5 |
| A | 1 | 161 | 27528 | 141.26 | 924 | 903 | 188.5 |
| B | 4 | 239 | 75042 | 413.03 | 925 | 900 | 179.5 |
| B | 15 | 204 | 72329 | 397.92 | 925 | 900 | 179.5 |
| B | 12 | 111 | 22243 | 118.9 | 925 | 900 | 179.5 |
| C | 14 | 234 | 20991 | 95.2 | 900 | 904 | 211.0 |
| C | 13 | 61 | 6438 | 26.23 | 900 | 904 | 211.0 |
| C | 8 | 222 | 2295 | 6.59 | 900 | 904 | 211.0 |
| D | 13 | 104 | 142654 | 663.47 | 893 | 867 | 213.7 |
| D | 1 | 52 | 116240 | 539.87 | 893 | 867 | 213.7 |
| D | 8 | 195 | 39818 | 182.27 | 893 | 867 | 213.7 |
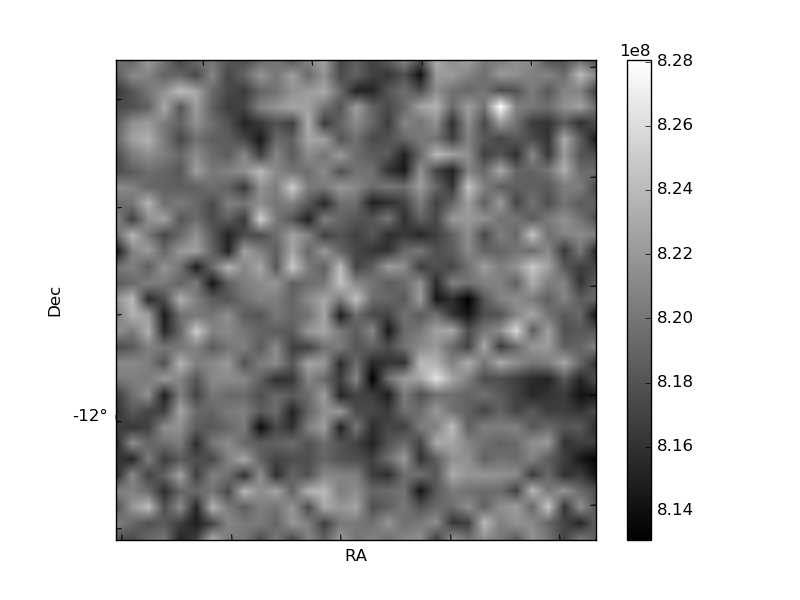
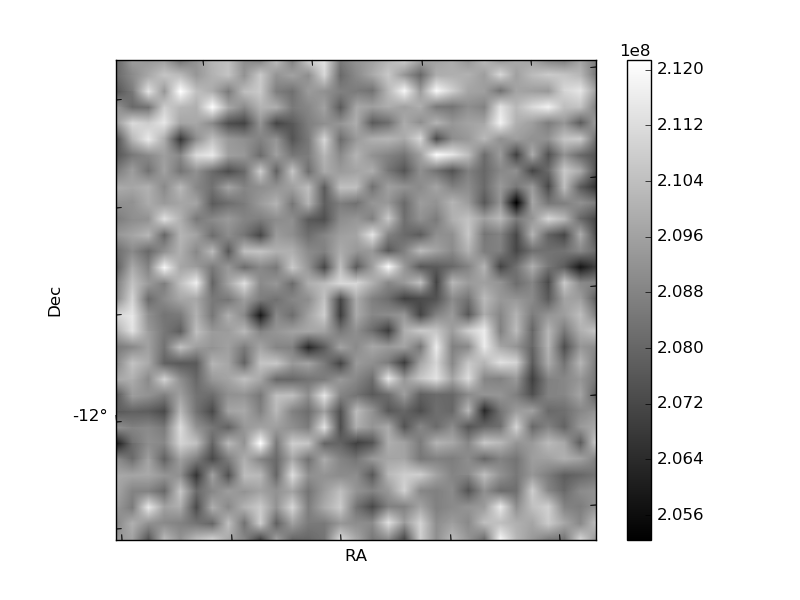
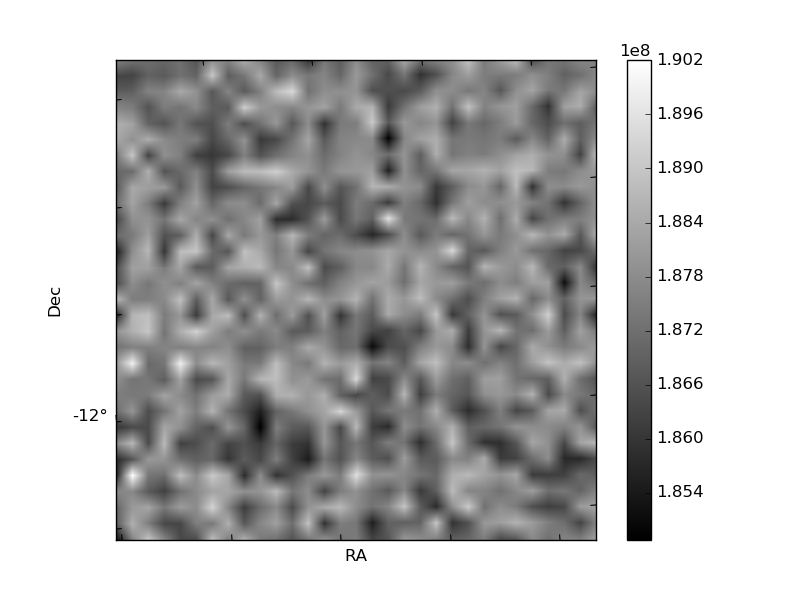
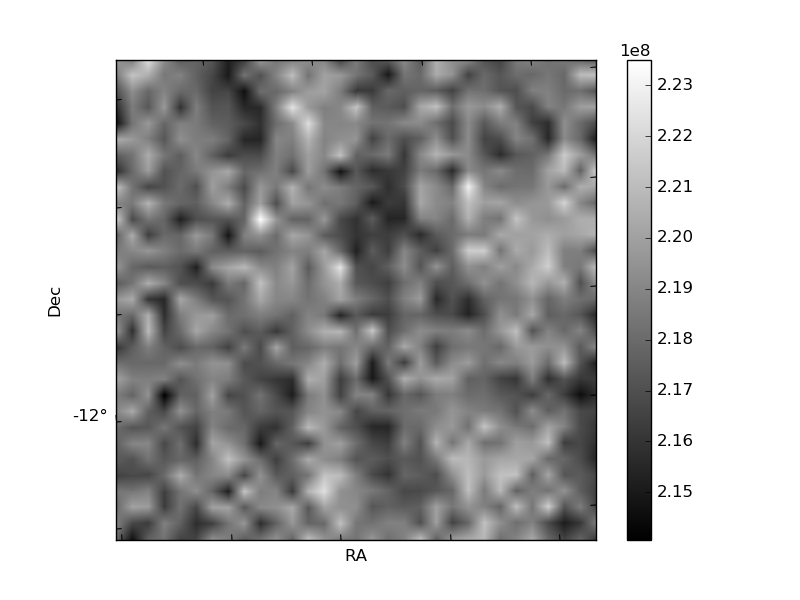
Histogram calculated using DETX and DETY for each event in the final _common_clean file
| Quadrant A | 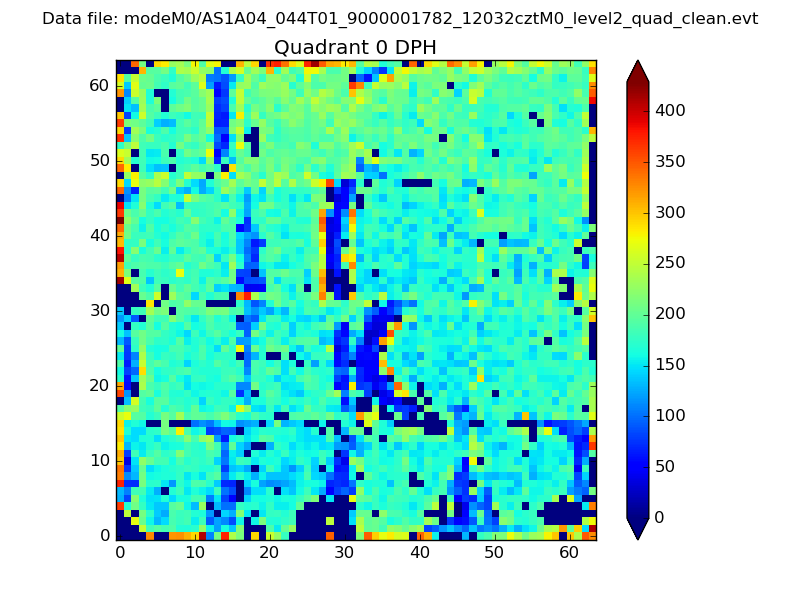 |
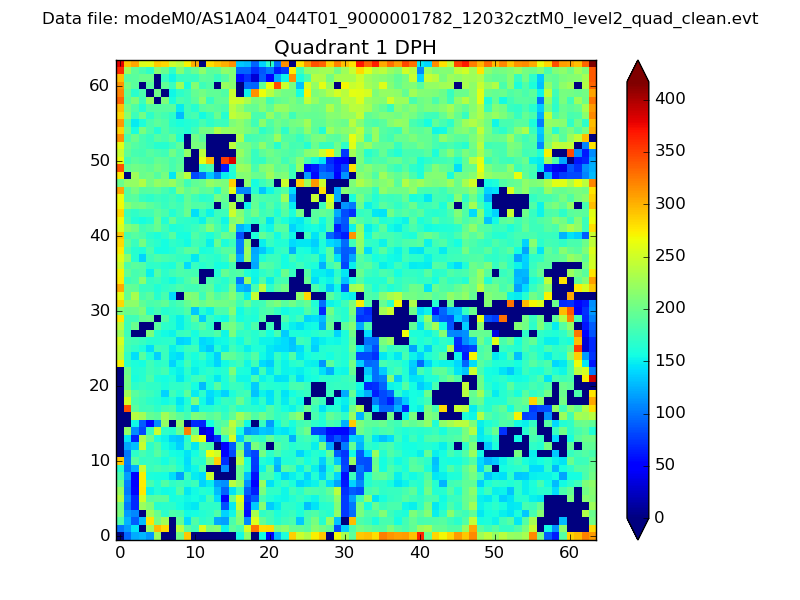 |
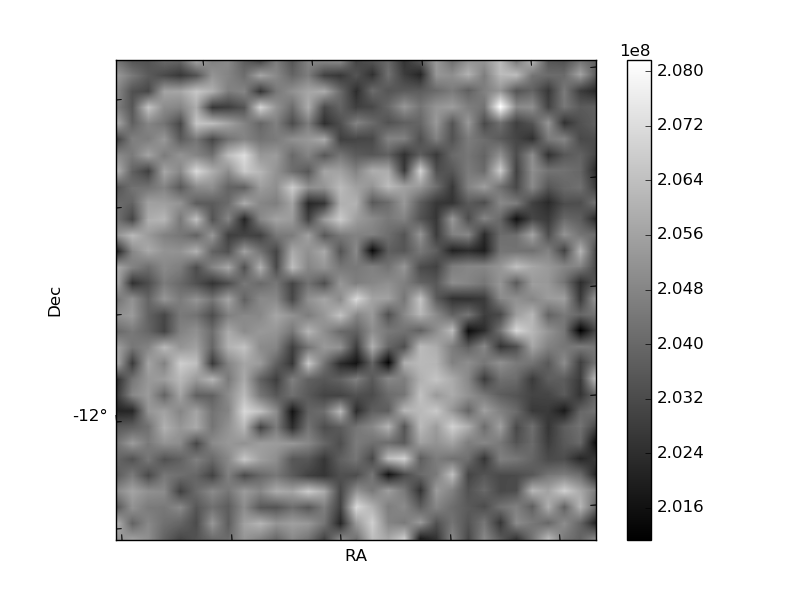
Quadrant B |
|---|---|---|---|
| Quadrant D | 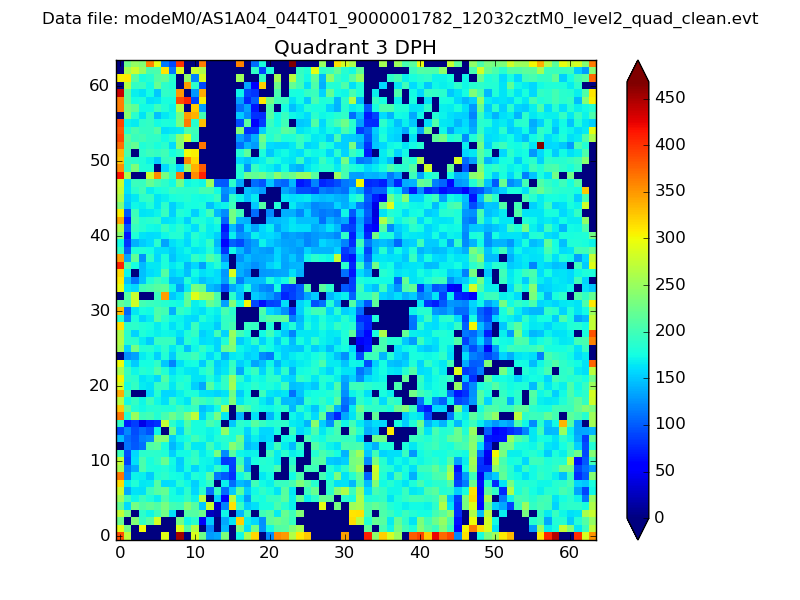 |
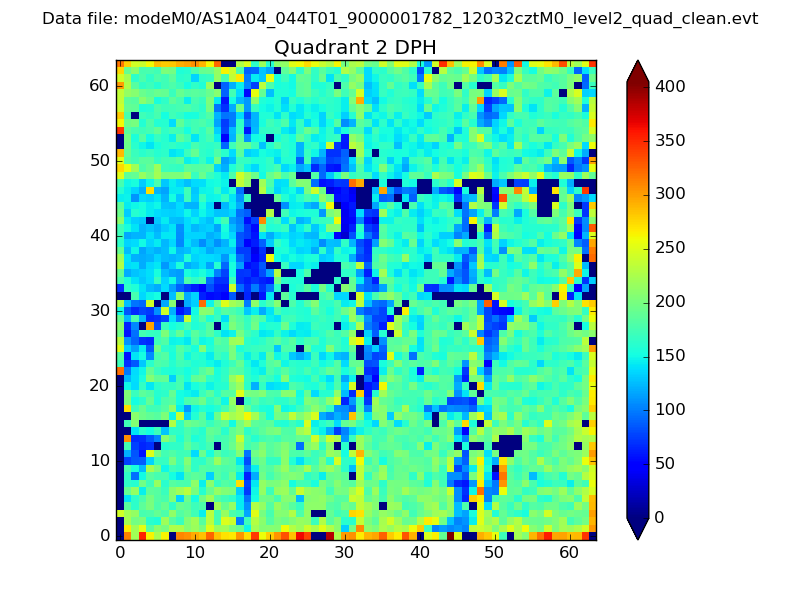 |
Quadrant C |
| Plot type | Count rate plots | Images |
|---|---|---|
| Comparison with Poisson distribution Blue bars denote a histogram of data divided into 1 sec bins. Red curve is a Poisson curve with rate = median count rate of data. |
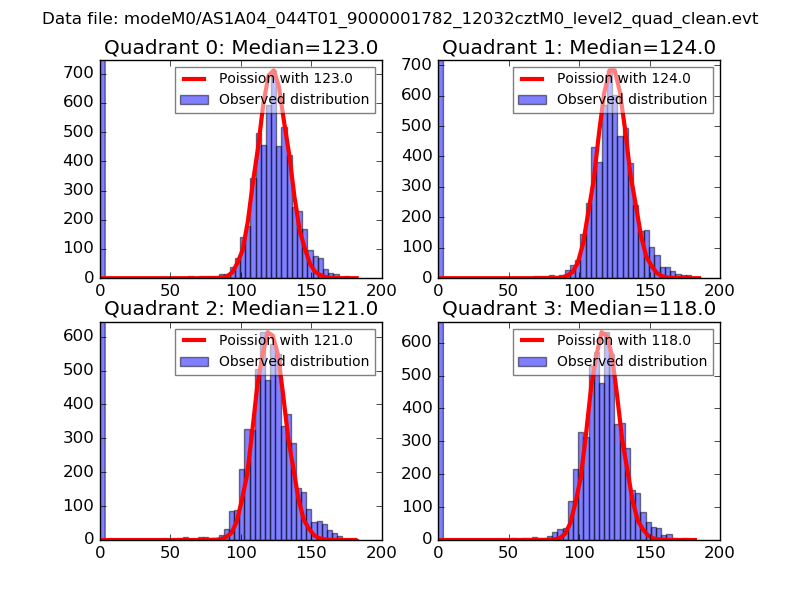 |
 |
| Quadrant-wise count rates Data is divided into 100 sec bins |
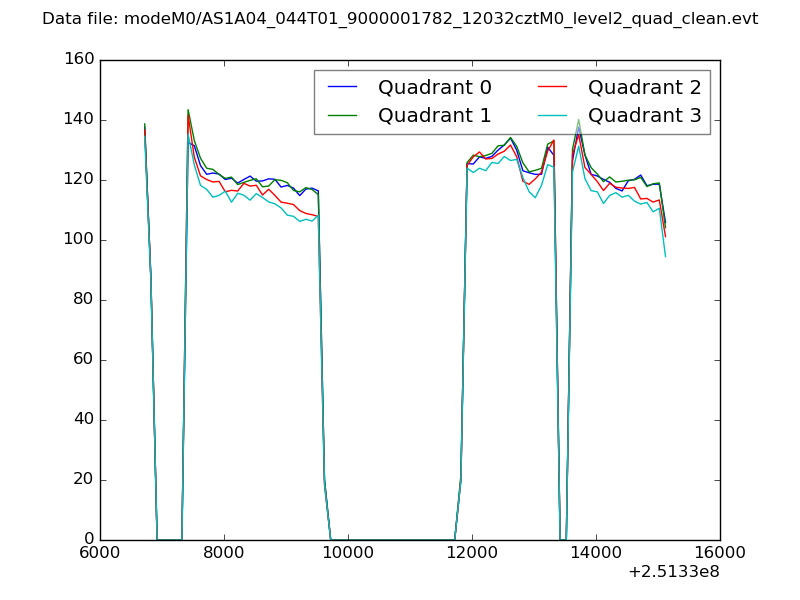 |
|
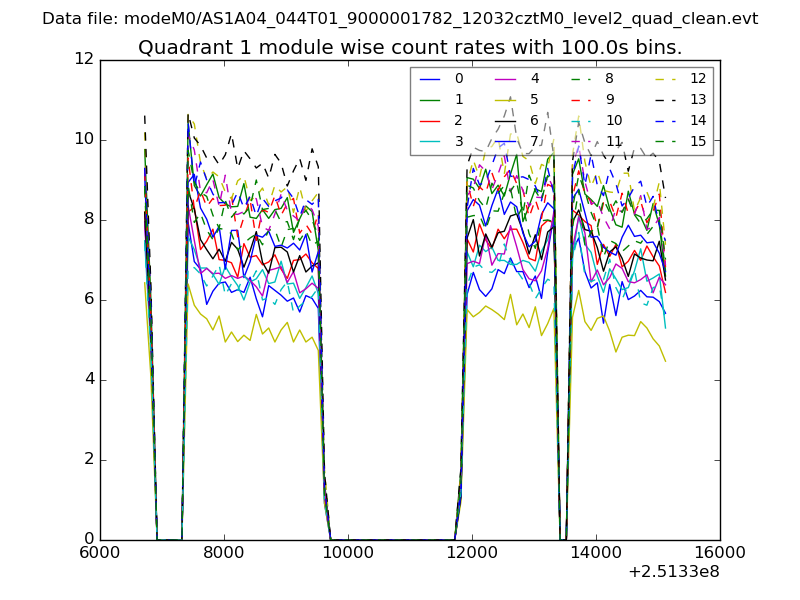
| Module-wise count rates for Quadrant A Data is divided into 100 sec bins |
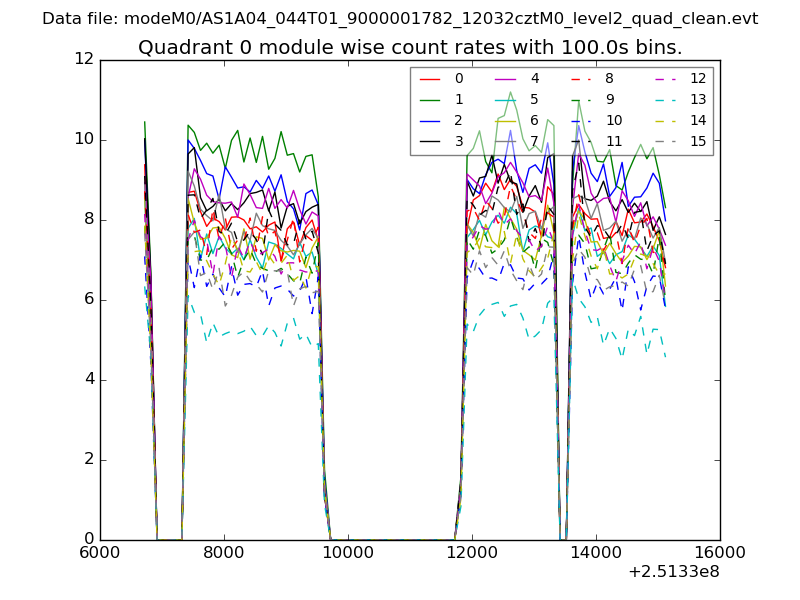 |
 |
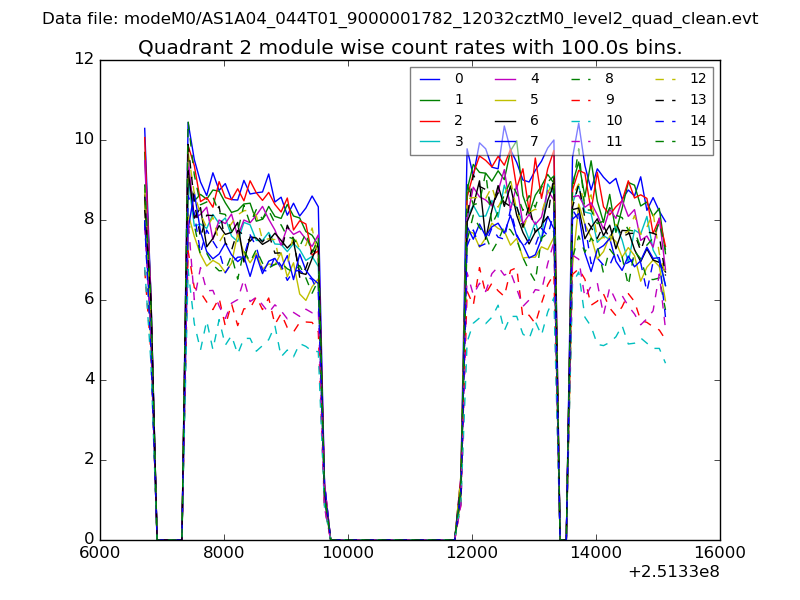
| Module-wise count rates for Quadrant B Data is divided into 100 sec bins |
 |
 |
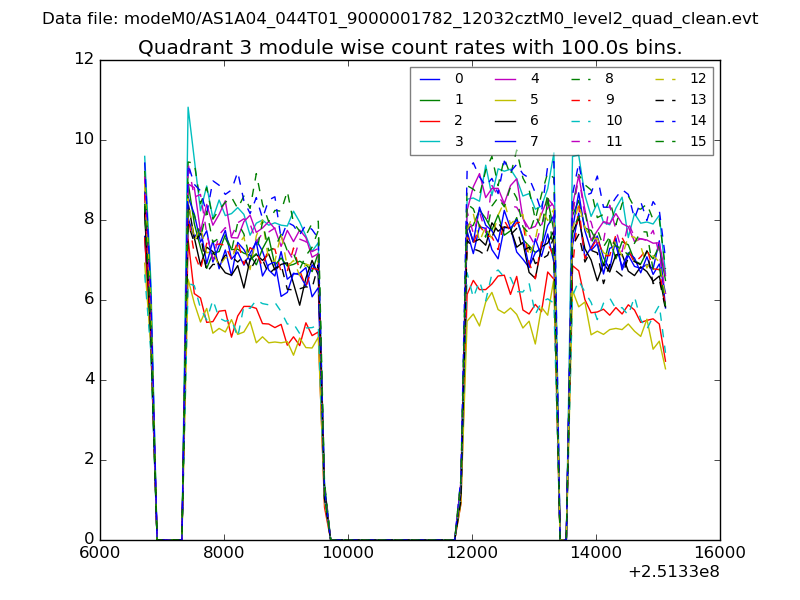
| Module-wise count rates for Quadrant C Data is divided into 100 sec bins |
 |
 |
| Module-wise count rates for Quadrant D Data is divided into 100 sec bins |
 |
 |
| Parameter | Plot |
|---|---|
| CZT HV Monitor | 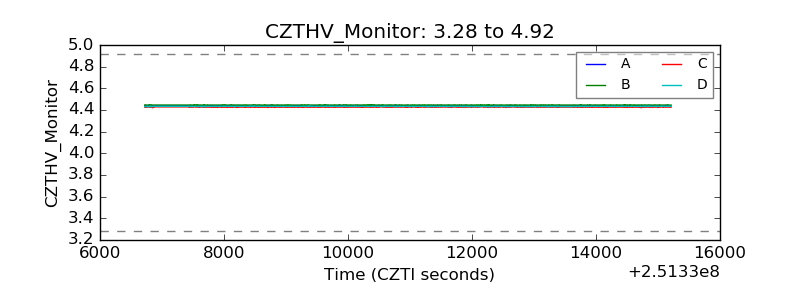 |
| D_VDD | 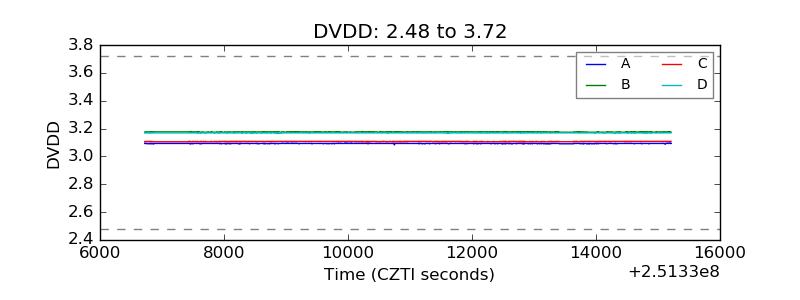 |
| Temperature 1 | 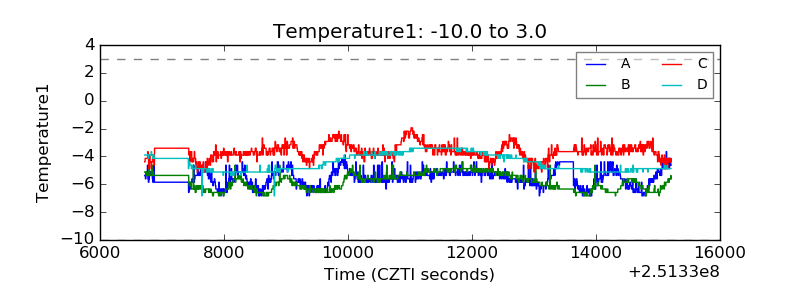 |
| Veto HV Monitor | 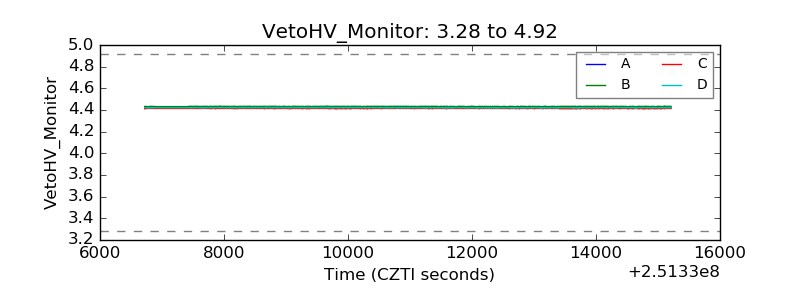 |
| Veto LLD | 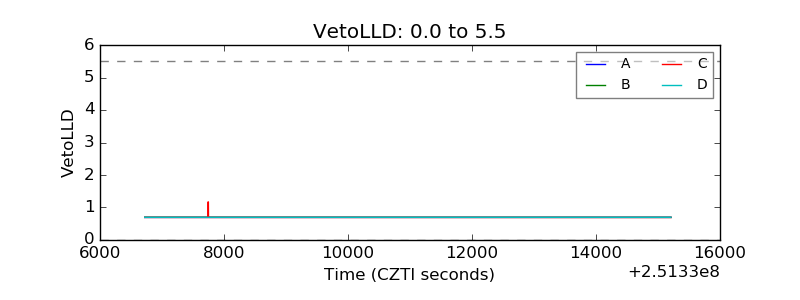 |
| Alpha Counter | 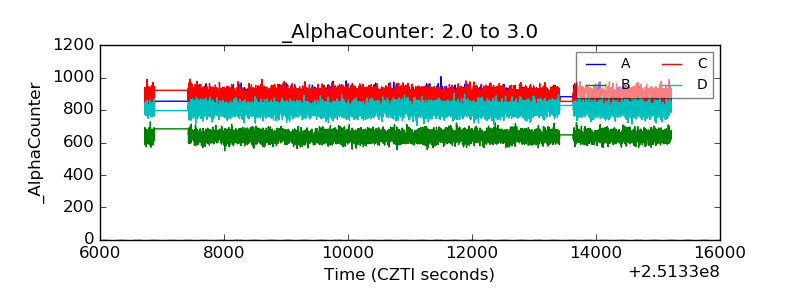 |
| _CPM_Rate | 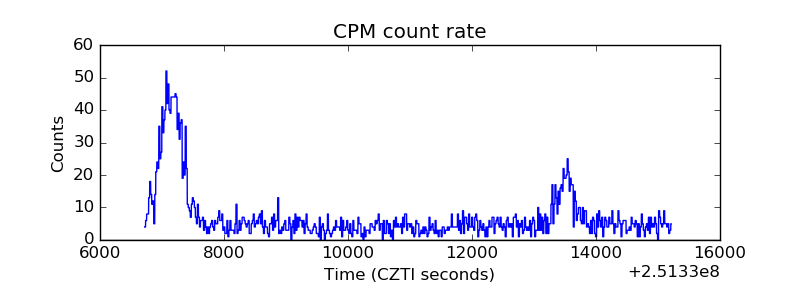 |
| CZT Counter | 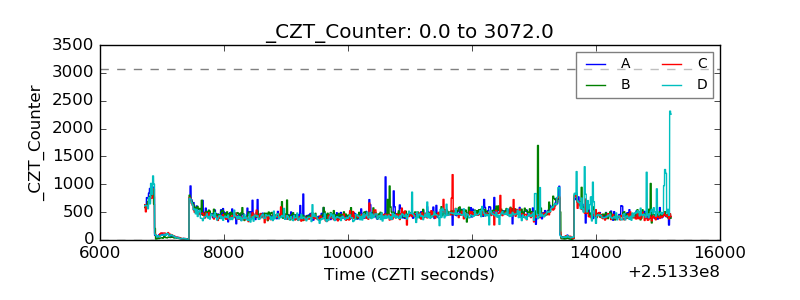 |
| +2.5 Volts monitor |  |
| +5 Volts monitor |  |
| _ROLL_ROT | 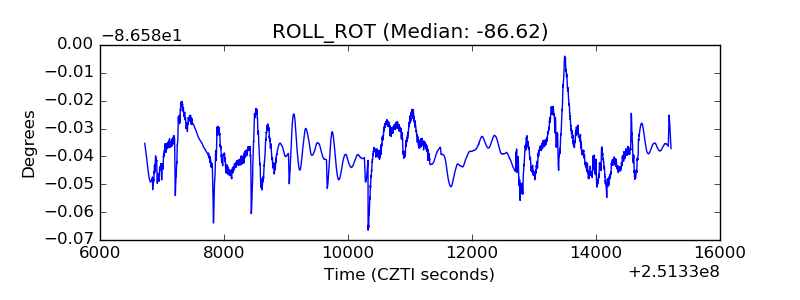 |
| _Roll_DEC | 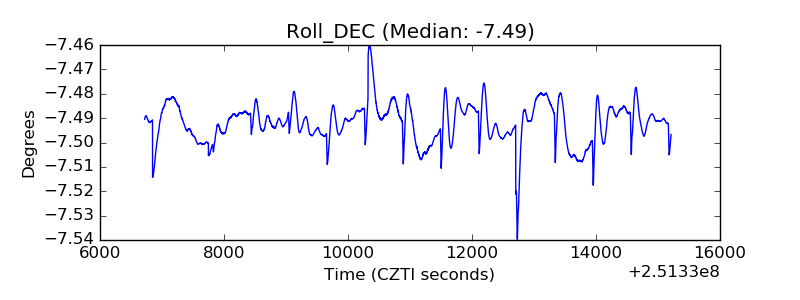 |
| _Roll_RA | 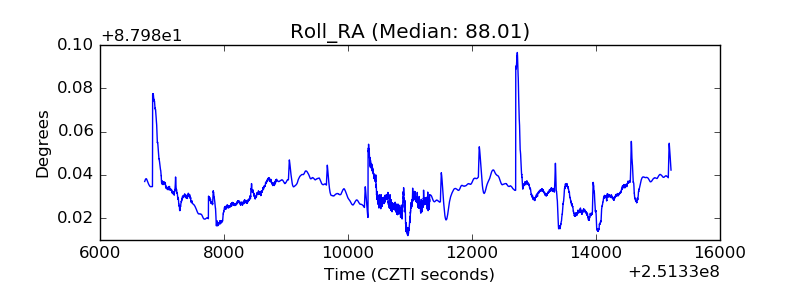 |
| Veto Counter | 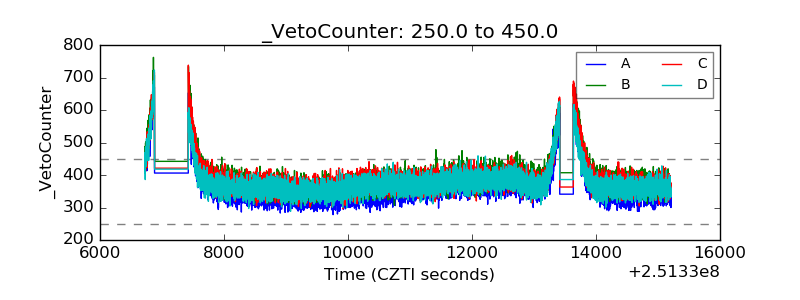 |