| Param | Original file | Final file |
|---|---|---|
| Filename | modeM0/AS1A04_044T01_9000001782_12036cztM0_level2.evt | modeM0/AS1A04_044T01_9000001782_12036cztM0_level2_quad_clean.evt |
| Size (bytes) | 1,461,720,960 | 219,568,320 |
| Size | 1.4 GB | 209.4 MB |
| Events in quadrant A | 12,209,457 | 1,288,648 |
| Events in quadrant B | 9,589,788 | 1,377,213 |
| Events in quadrant C | 8,818,840 | 1,350,938 |
| Events in quadrant D | 12,341,530 | 1,298,274 |
| Mode SS | |||
|---|---|---|---|
| Quadrant | BADHDUFLAG | Total packets | Discarded packets |
| A | 0 | 396 | 0 |
| B | 0 | 396 | 0 |
| C | 0 | 396 | 0 |
| D | 0 | 396 | 0 |
| Mode M0 | |||
|---|---|---|---|
| Quadrant | BADHDUFLAG | Total packets | Discarded packets |
| A | 0 | 48972 | 5 |
| B | 0 | 41020 | 4 |
| C | 0 | 39725 | 4 |
| D | 0 | 48794 | 4 |
| Mode M9 | |||
|---|---|---|---|
| Quadrant | BADHDUFLAG | Total packets | Discarded packets |
| A | 0 | 21 | 0 |
| B | 0 | 21 | 0 |
| C | 0 | 21 | 0 |
| D | 0 | 21 | 0 |
| Quadrant | Total seconds | Saturated seconds | Saturation percentage |
|---|---|---|---|
| A | 19364 | 1532 | 7.911589% |
| B | 19364 | 388 | 2.003718% |
| C | 19364 | 210 | 1.084487% |
| D | 19364 | 721 | 3.723404% |
Noise dominated data is calculated using 1-second bins in cleaned event files. If a bin has >2000 counts, and if more than 50% of those come from <1% of pixels, then it is considered to be noise-dominated and hence unusable.
| Quadrant | # 1 sec bins | Bins with >0 counts | Bins with >2000 counts | High rate bins dominated by noise | Noise dominated (total time) | Noise dominated (detector-on time) | Marked lightcurve |
|---|---|---|---|---|---|---|---|
| A | 21515 | 19366 | 1113 | 1113 | 5.17% | 5.75% |  |
| B | 21515 | 19367 | 51 | 51 | 0.24% | 0.26% |  |
| C | 21515 | 19367 | 7 | 7 | 0.03% | 0.04% |  |
| D | 21515 | 19367 | 524 | 524 | 2.44% | 2.71% |  |
Top three noisy pixels from each quadrant. If the there are fewer than three noisy pixels in the level2.evt file, extra rows are filled as -1
| Pixel properties | Quadrant properties | ||||||
|---|---|---|---|---|---|---|---|
| Quadrant | DetID | PixID | Counts | Sigma | Mean | Median | Sigma |
| A | 5 | 16 | 3248918 | 7306.63 | 2197 | 2147 | 444.4 |
| A | 1 | 162 | 166918 | 370.81 | 2197 | 2147 | 444.4 |
| A | 9 | 143 | 92466 | 203.26 | 2197 | 2147 | 444.4 |
| B | 4 | 239 | 393754 | 889.85 | 2289 | 2227 | 440.0 |
| B | 15 | 204 | 154971 | 347.15 | 2289 | 2227 | 440.0 |
| B | 0 | 85 | 93352 | 207.11 | 2289 | 2227 | 440.0 |
| C | 14 | 234 | 59559 | 109.94 | 2241 | 2252 | 521.2 |
| C | 13 | 61 | 16380 | 27.1 | 2241 | 2252 | 521.2 |
| C | 8 | 128 | 13698 | 21.96 | 2241 | 2252 | 521.2 |
| D | 1 | 52 | 2556752 | 4840.8 | 2202 | 2142 | 527.7 |
| D | 8 | 195 | 905897 | 1712.55 | 2202 | 2142 | 527.7 |
| D | 7 | 80 | 204177 | 382.84 | 2202 | 2142 | 527.7 |
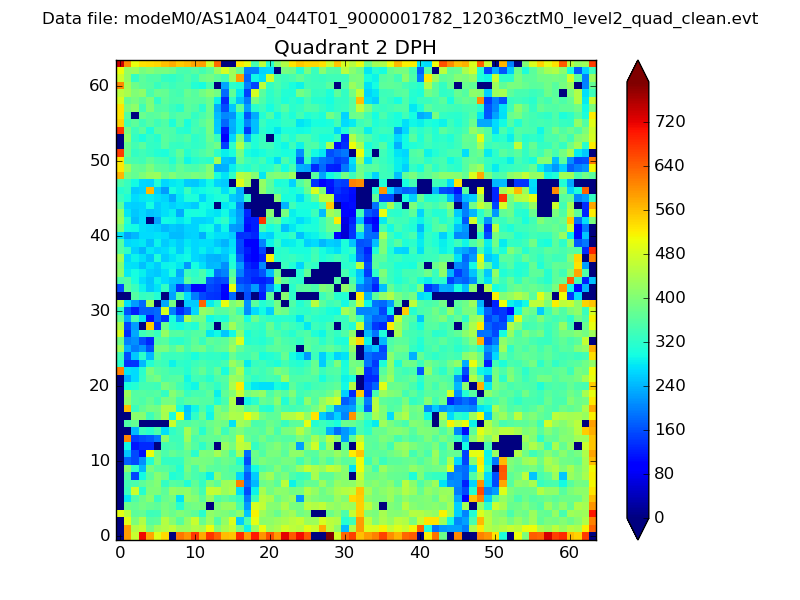
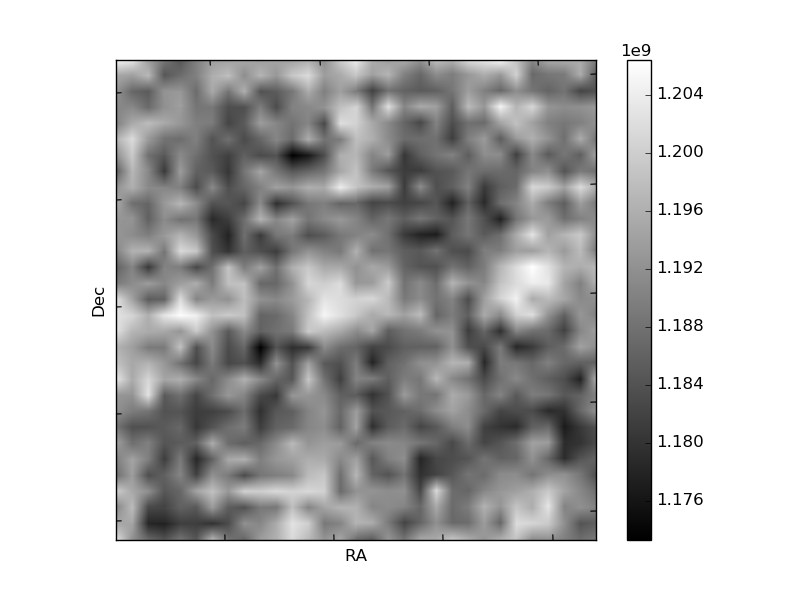
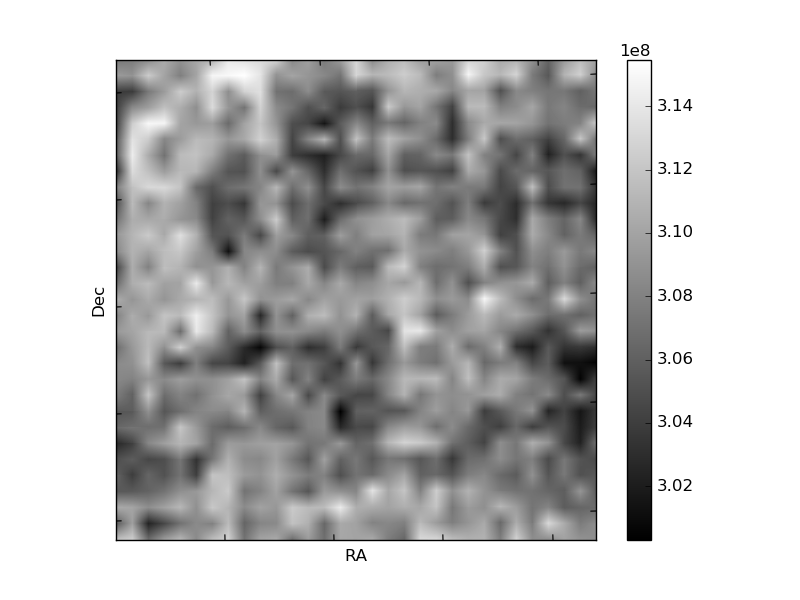
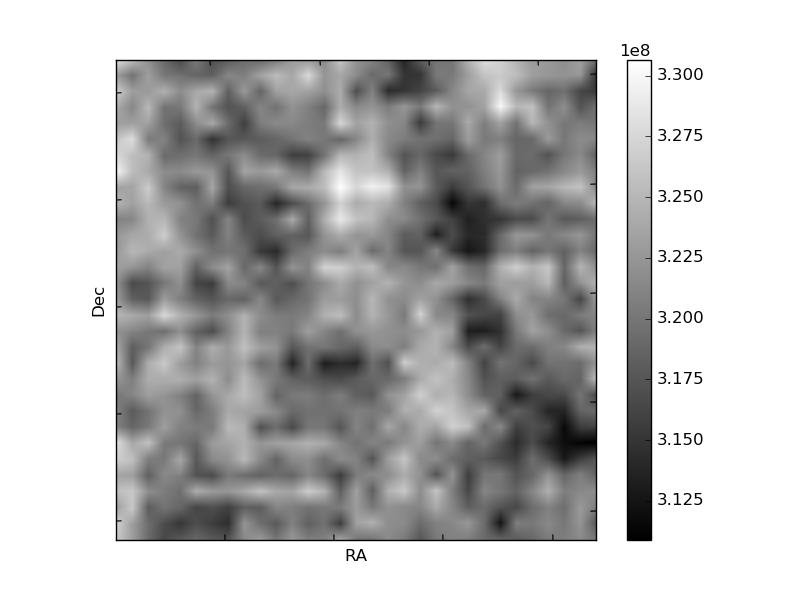
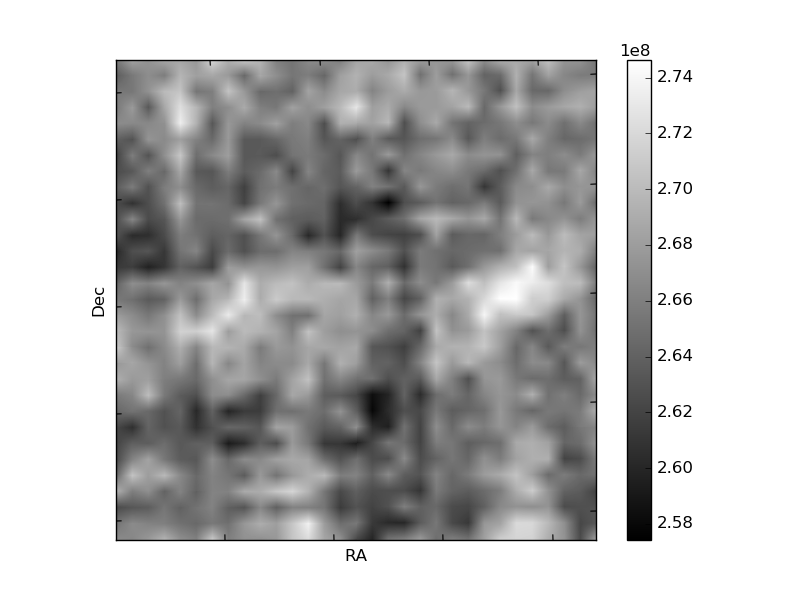
Histogram calculated using DETX and DETY for each event in the final _common_clean file
| Quadrant A | 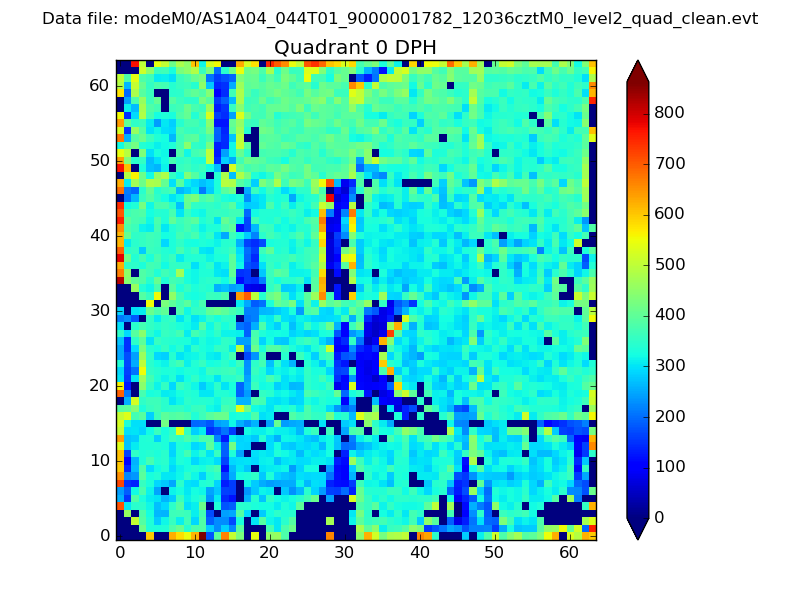 |
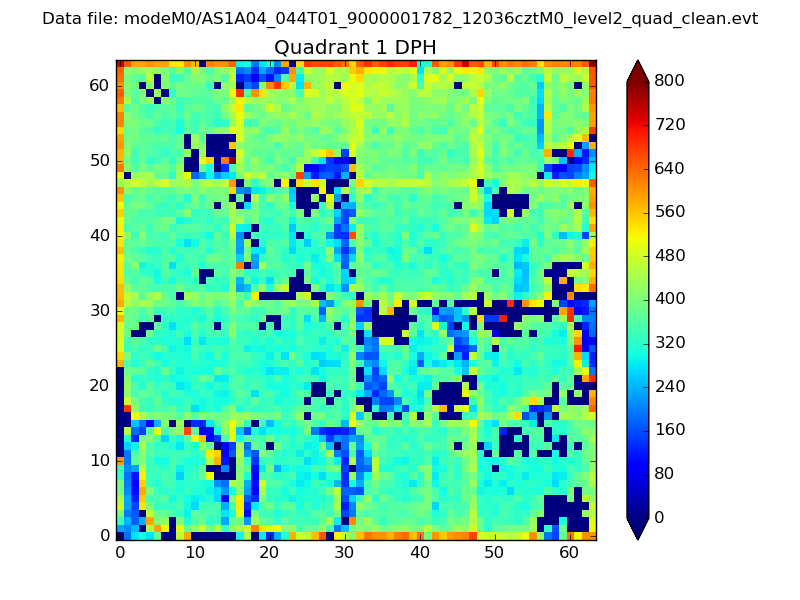 |
Quadrant B |
|---|---|---|---|
| Quadrant D | 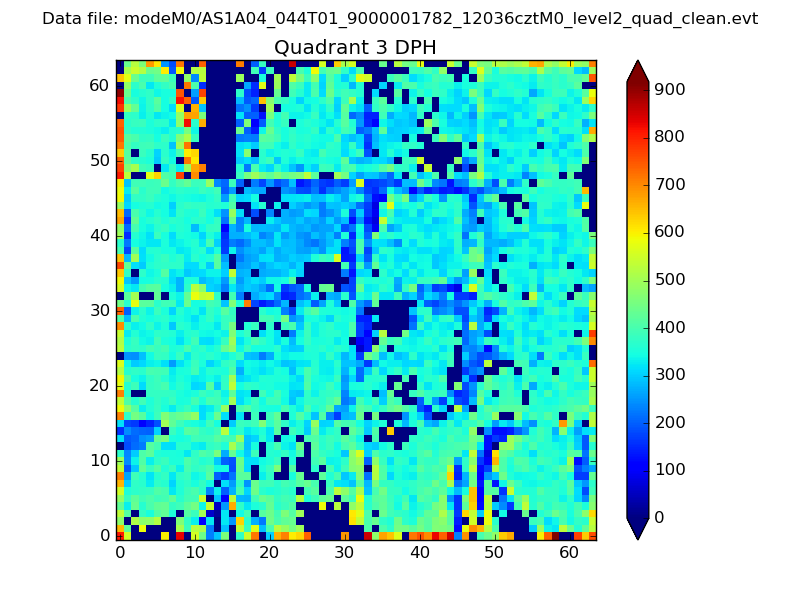 |
 |
Quadrant C |
| Plot type | Count rate plots | Images |
|---|---|---|
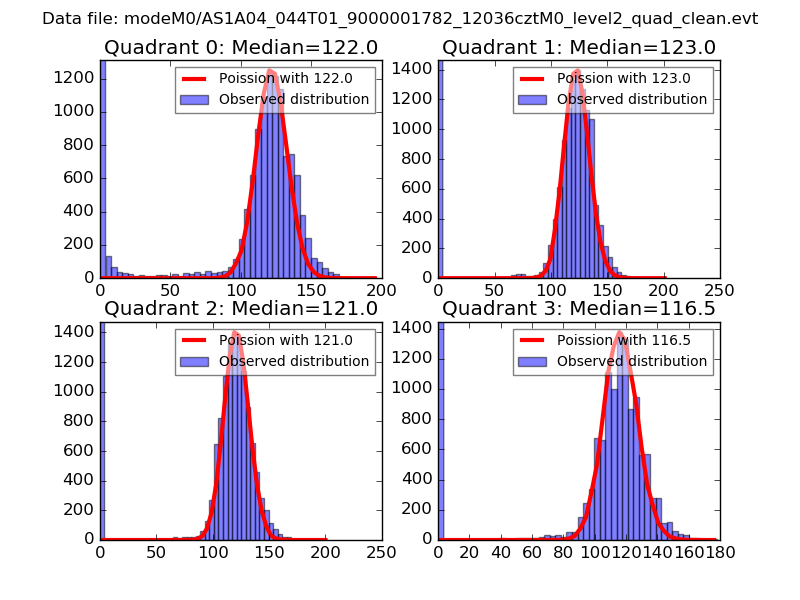
| Comparison with Poisson distribution Blue bars denote a histogram of data divided into 1 sec bins. Red curve is a Poisson curve with rate = median count rate of data. |
 |
 |
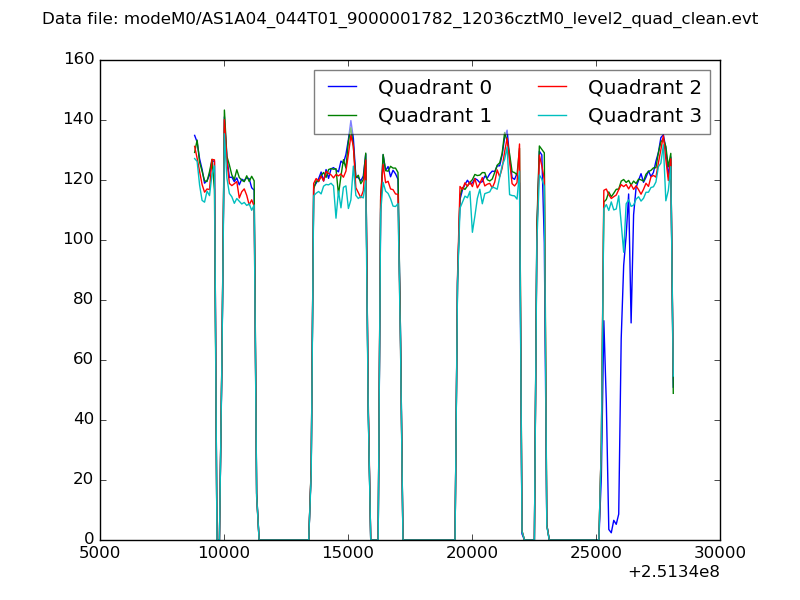
| Quadrant-wise count rates Data is divided into 100 sec bins |
 |
|
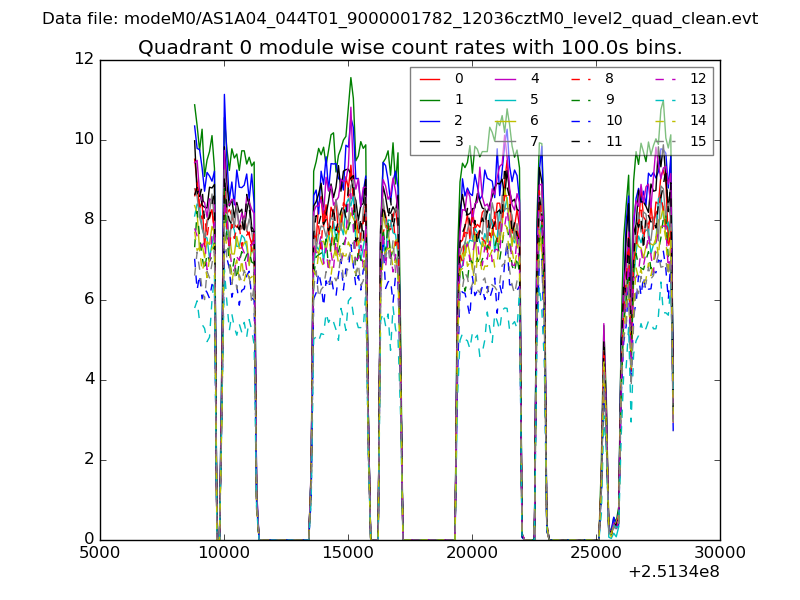
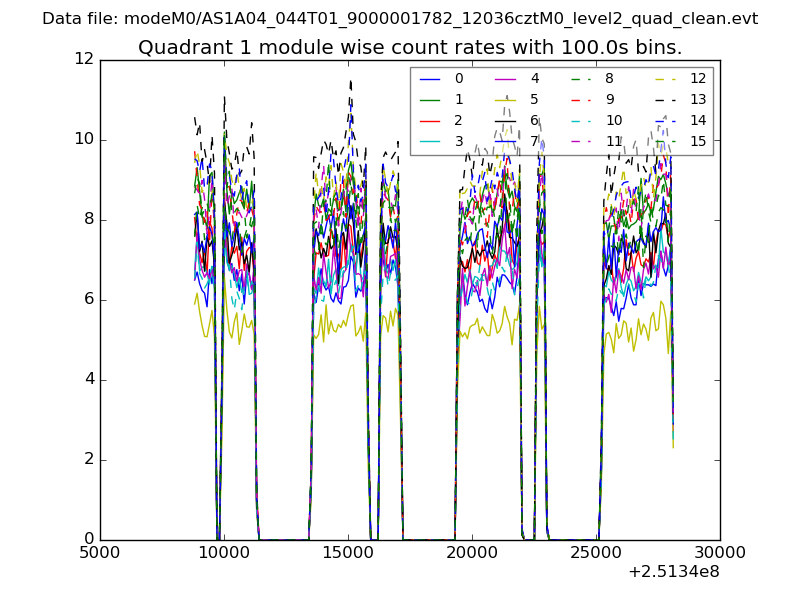
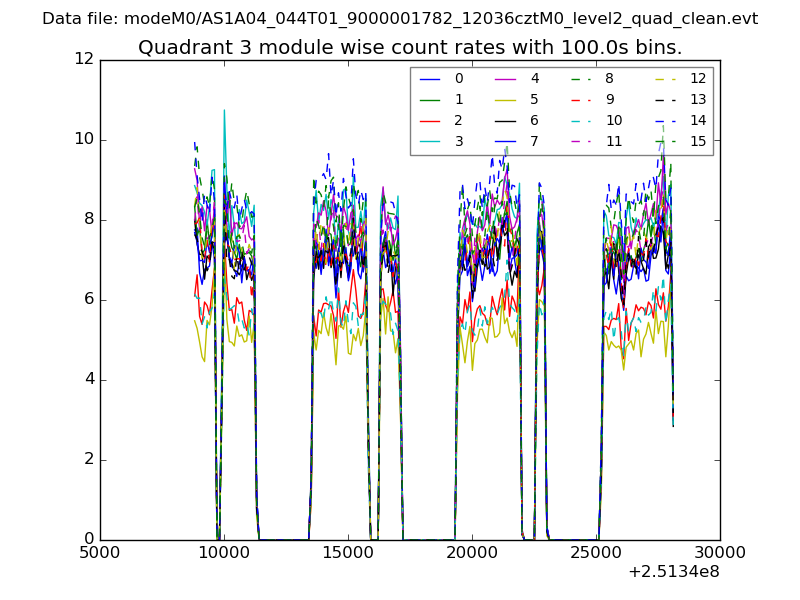
| Module-wise count rates for Quadrant A Data is divided into 100 sec bins |
 |
 |
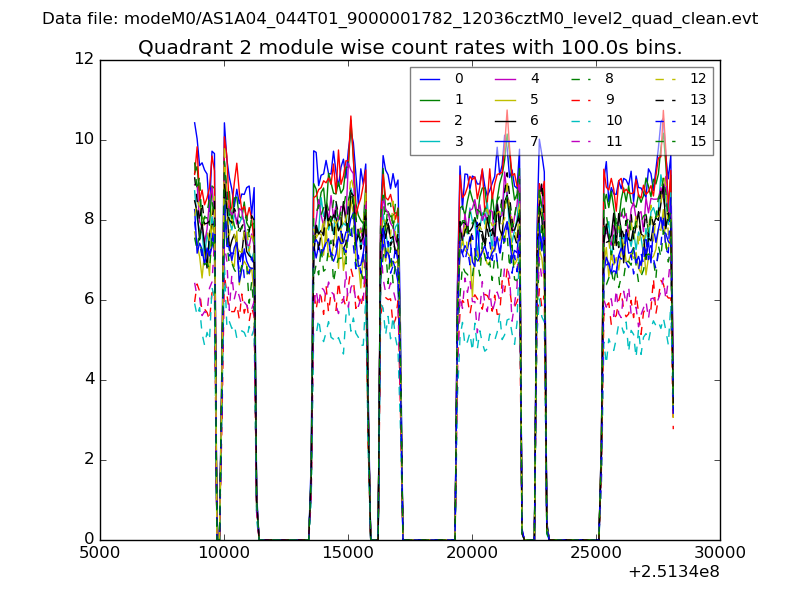
| Module-wise count rates for Quadrant B Data is divided into 100 sec bins |
 |
 |
| Module-wise count rates for Quadrant C Data is divided into 100 sec bins |
 |
 |
| Module-wise count rates for Quadrant D Data is divided into 100 sec bins |
 |
 |
| Parameter | Plot |
|---|---|
| CZT HV Monitor | 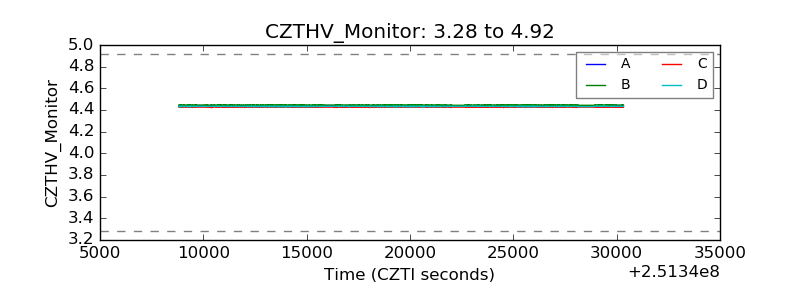 |
| D_VDD | 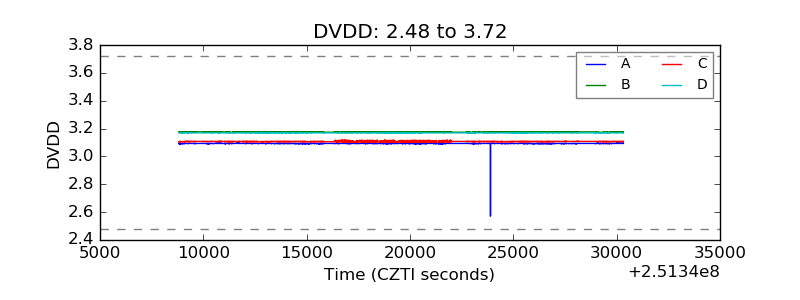 |
| Temperature 1 | 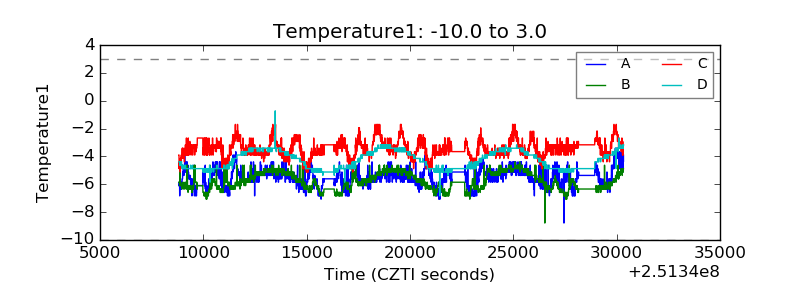 |
| Veto HV Monitor | 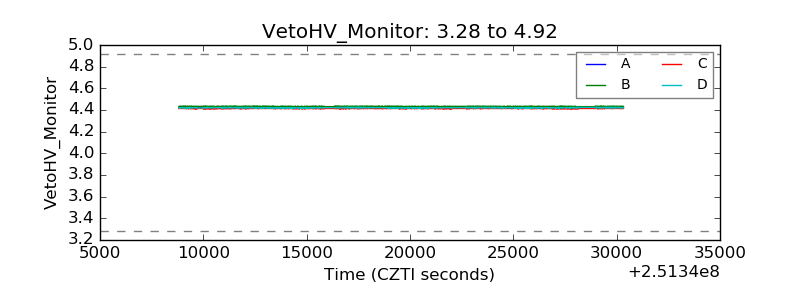 |
| Veto LLD | 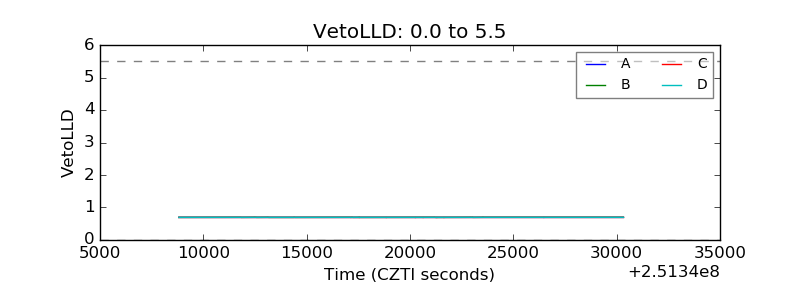 |
| Alpha Counter | 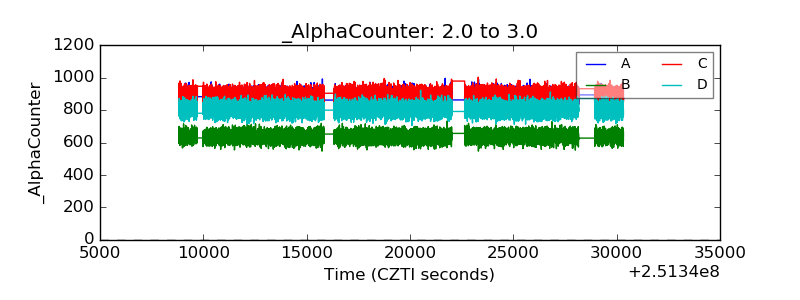 |
| _CPM_Rate | 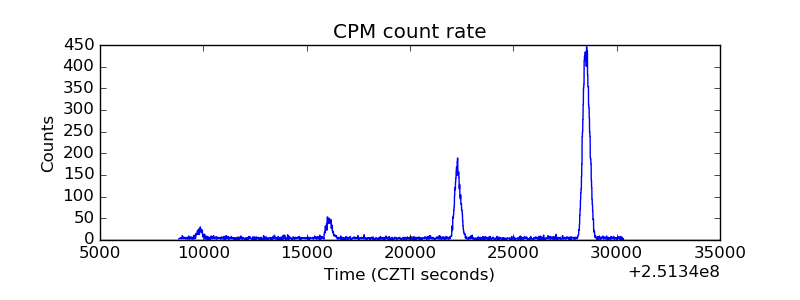 |
| CZT Counter | 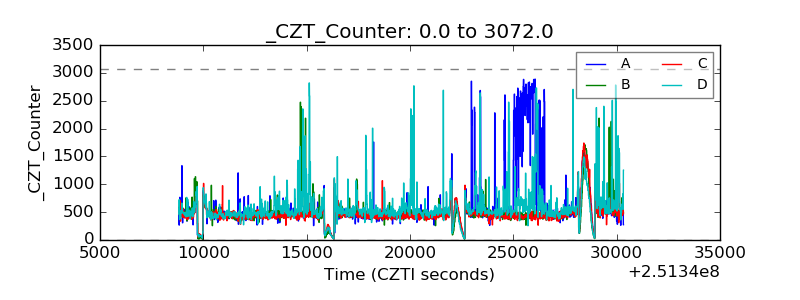 |
| +2.5 Volts monitor |  |
| +5 Volts monitor |  |
| _ROLL_ROT | 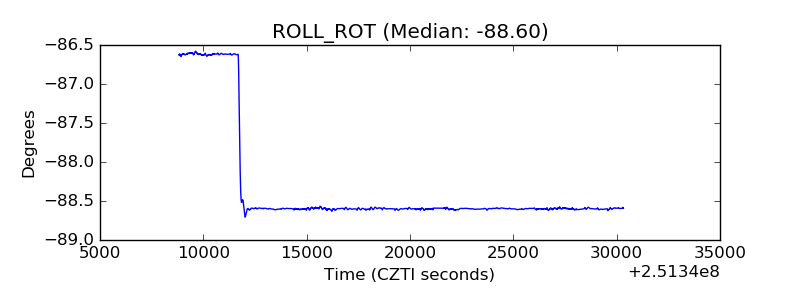 |
| _Roll_DEC | 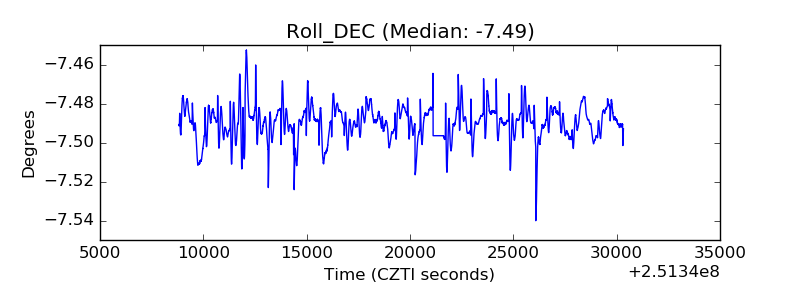 |
| _Roll_RA | 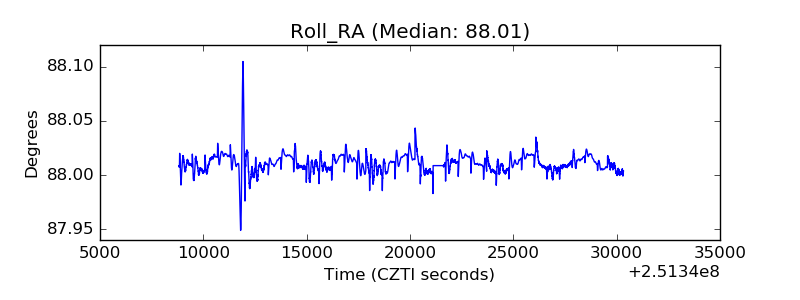 |
| Veto Counter | 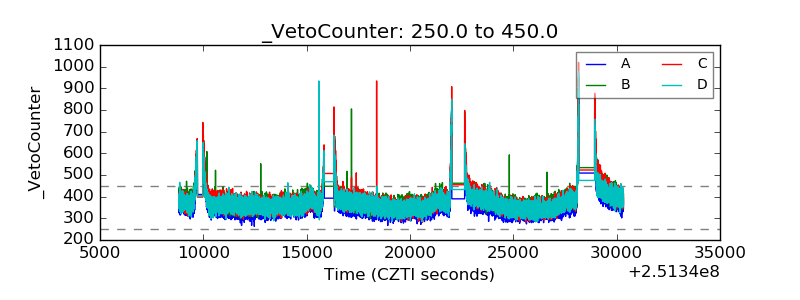 |