| Param | Original file | Final file |
|---|---|---|
| Filename | modeM0/AS1A04_044T01_9000001782_12037cztM0_level2.evt | modeM0/AS1A04_044T01_9000001782_12037cztM0_level2_quad_clean.evt |
| Size (bytes) | 771,330,240 | 72,060,480 |
| Size | 735.6 MB | 68.7 MB |
| Events in quadrant A | 3,642,465 | 452,051 |
| Events in quadrant B | 4,309,206 | 448,485 |
| Events in quadrant C | 3,548,612 | 445,534 |
| Events in quadrant D | 11,365,795 | 327,115 |
| Mode SS | |||
|---|---|---|---|
| Quadrant | BADHDUFLAG | Total packets | Discarded packets |
| A | 0 | 148 | 0 |
| B | 0 | 148 | 0 |
| C | 0 | 148 | 0 |
| D | 0 | 148 | 0 |
| Mode M0 | |||
|---|---|---|---|
| Quadrant | BADHDUFLAG | Total packets | Discarded packets |
| A | 0 | 15498 | 3 |
| B | 0 | 17644 | 2 |
| C | 0 | 15422 | 2 |
| D | 0 | 38763 | 2 |
| Mode M9 | |||
|---|---|---|---|
| Quadrant | BADHDUFLAG | Total packets | Discarded packets |
| A | 0 | 17 | 0 |
| B | 0 | 17 | 0 |
| C | 0 | 17 | 0 |
| D | 0 | 17 | 0 |
| Quadrant | Total seconds | Saturated seconds | Saturation percentage |
|---|---|---|---|
| A | 7296 | 137 | 1.877741% |
| B | 7296 | 270 | 3.700658% |
| C | 7296 | 125 | 1.713268% |
| D | 7296 | 2985 | 40.912829% |
Noise dominated data is calculated using 1-second bins in cleaned event files. If a bin has >2000 counts, and if more than 50% of those come from <1% of pixels, then it is considered to be noise-dominated and hence unusable.
| Quadrant | # 1 sec bins | Bins with >0 counts | Bins with >2000 counts | High rate bins dominated by noise | Noise dominated (total time) | Noise dominated (detector-on time) | Marked lightcurve |
|---|---|---|---|---|---|---|---|
| A | 9012 | 7297 | 2 | 2 | 0.02% | 0.03% |  |
| B | 9011 | 7296 | 62 | 62 | 0.69% | 0.85% | 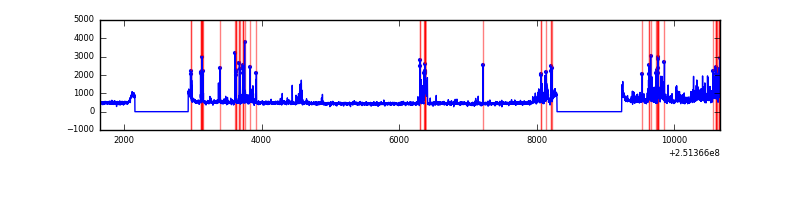 |
| C | 9012 | 7297 | 17 | 17 | 0.19% | 0.23% | 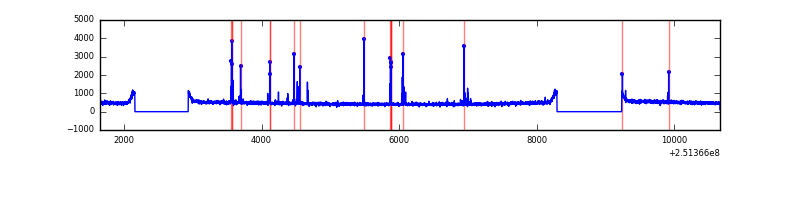 |
| D | 9011 | 7296 | 2839 | 2839 | 31.51% | 38.91% | 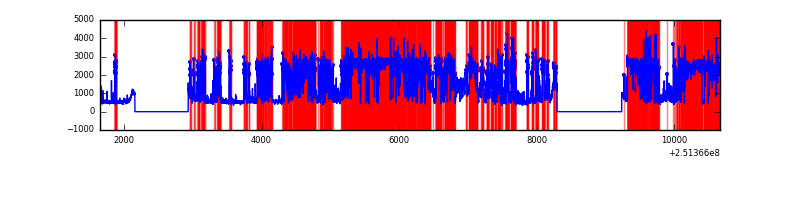 |
Top three noisy pixels from each quadrant. If the there are fewer than three noisy pixels in the level2.evt file, extra rows are filled as -1
| Pixel properties | Quadrant properties | ||||||
|---|---|---|---|---|---|---|---|
| Quadrant | DetID | PixID | Counts | Sigma | Mean | Median | Sigma |
| A | 1 | 162 | 62563 | 330.7 | 901 | 882 | 186.5 |
| A | 1 | 178 | 30840 | 160.62 | 901 | 882 | 186.5 |
| A | 1 | 161 | 27028 | 140.18 | 901 | 882 | 186.5 |
| B | 4 | 239 | 735708 | 4261.75 | 893 | 871 | 172.4 |
| B | 15 | 204 | 63706 | 364.42 | 893 | 871 | 172.4 |
| B | 0 | 85 | 21725 | 120.94 | 893 | 871 | 172.4 |
| C | 14 | 234 | 110034 | 531.44 | 882 | 886 | 205.4 |
| C | 13 | 61 | 6554 | 27.6 | 882 | 886 | 205.4 |
| C | 12 | 4 | 3072 | 10.64 | 882 | 886 | 205.4 |
| D | 1 | 52 | 8014577 | 48476.07 | 682 | 662 | 165.3 |
| D | 8 | 195 | 294583 | 1777.92 | 682 | 662 | 165.3 |
| D | 2 | 136 | 263233 | 1588.29 | 682 | 662 | 165.3 |
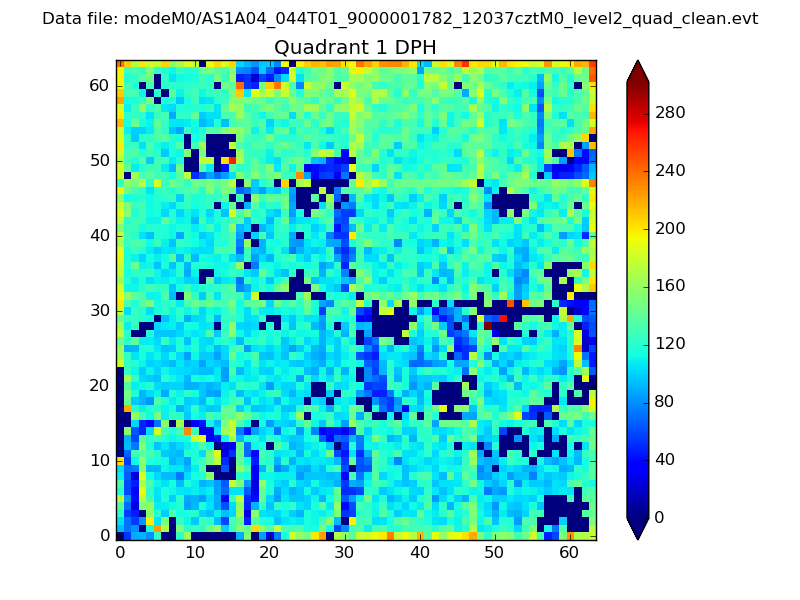
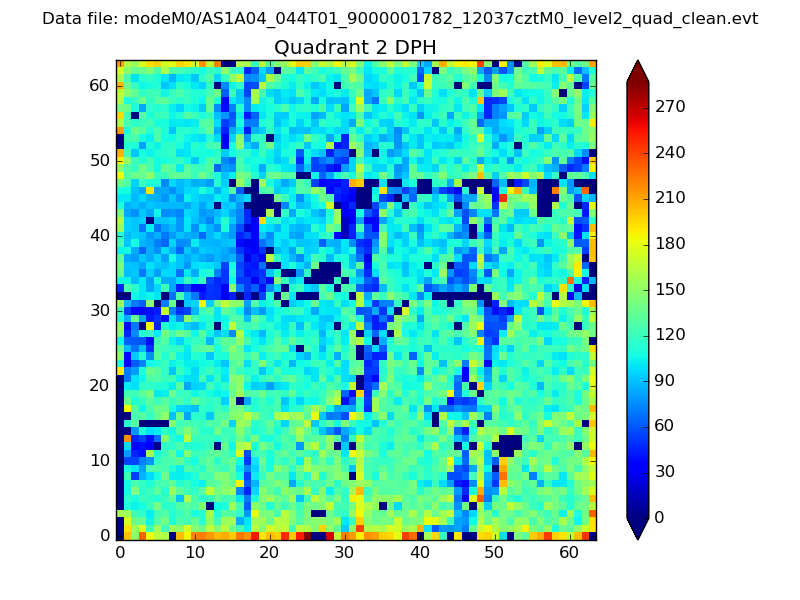
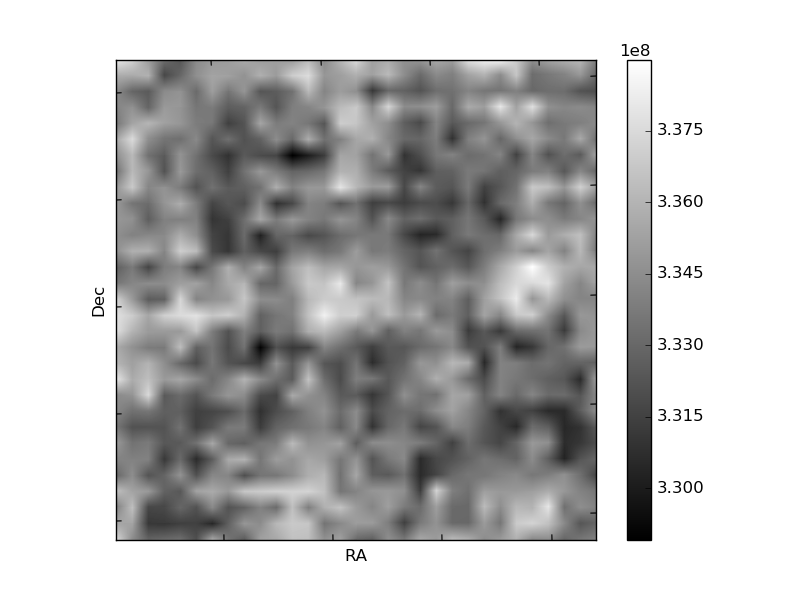
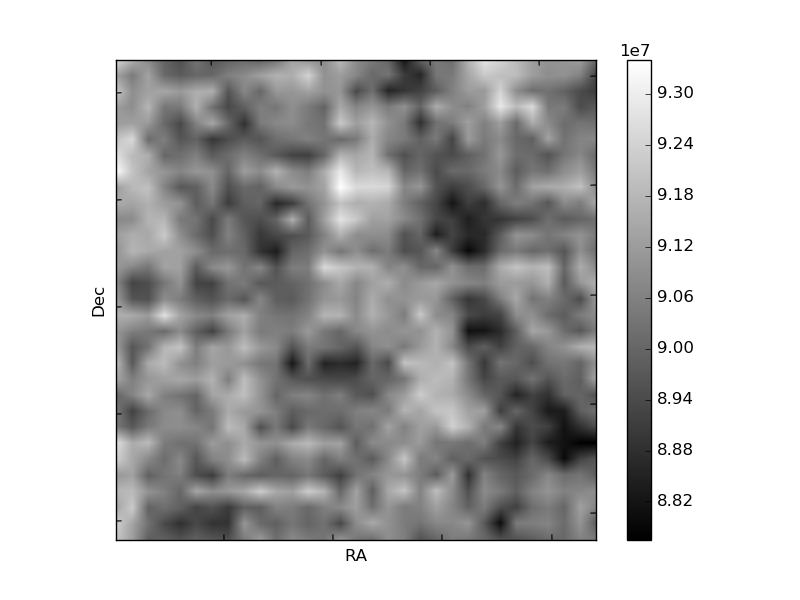
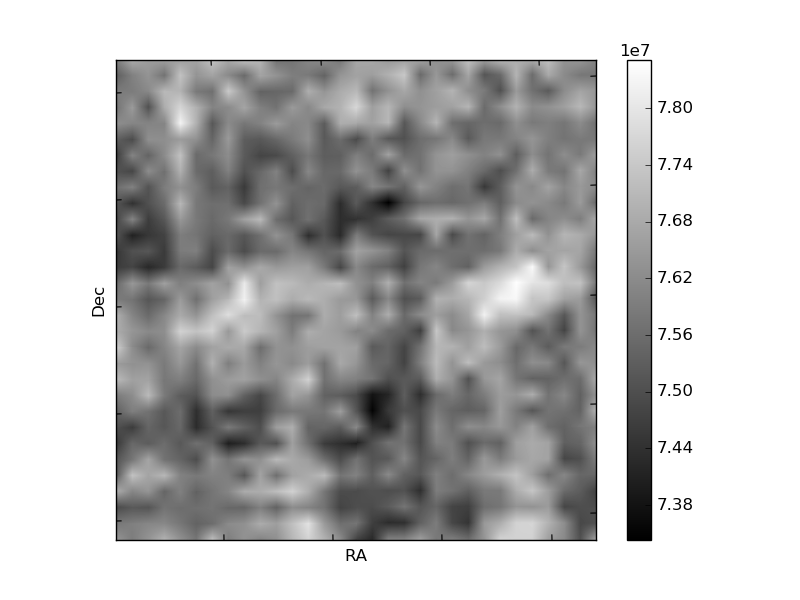
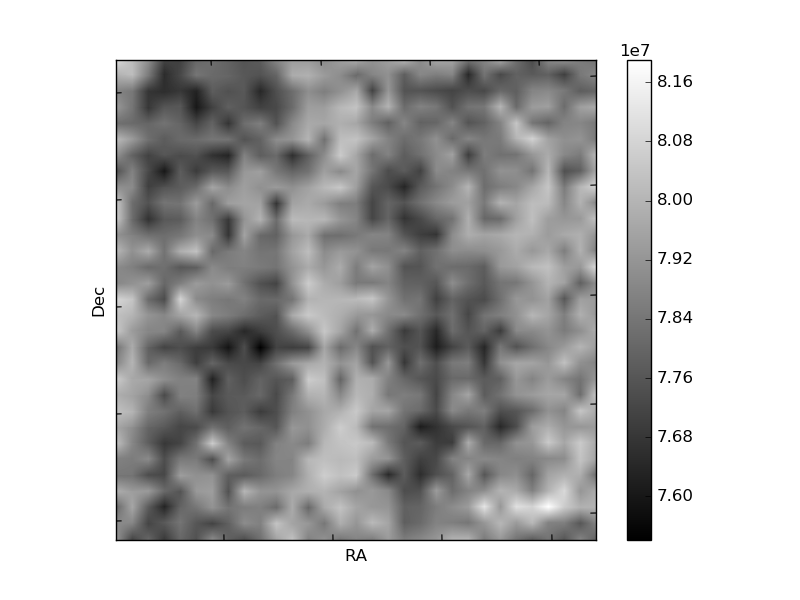
Histogram calculated using DETX and DETY for each event in the final _common_clean file
| Quadrant A | 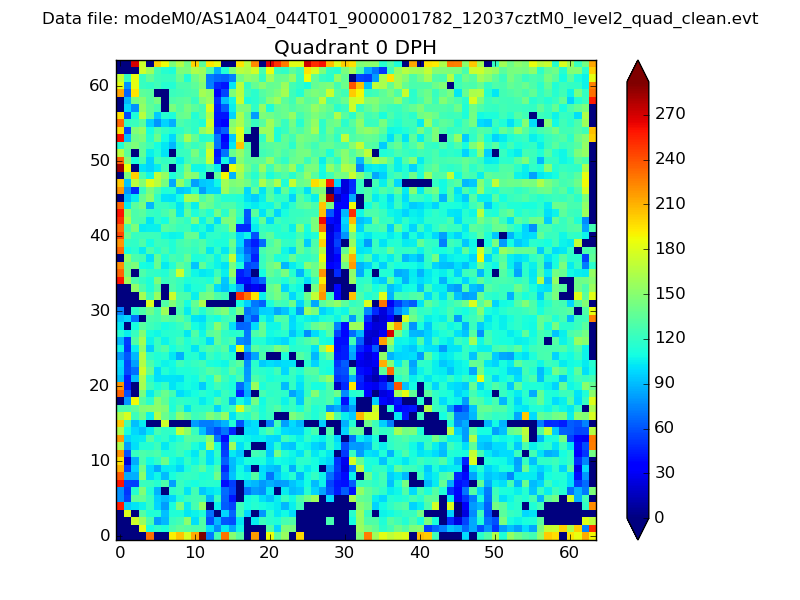 |
 |
Quadrant B |
|---|---|---|---|
| Quadrant D | 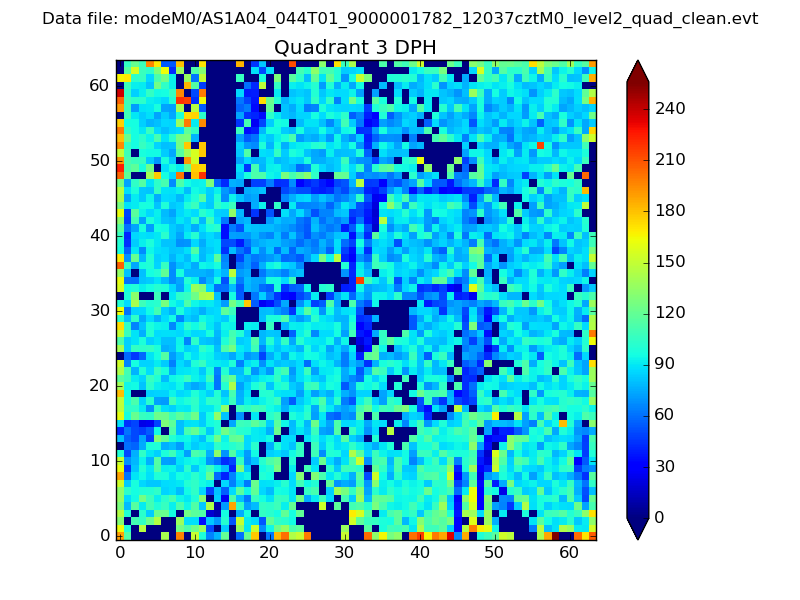 |
 |
Quadrant C |
| Plot type | Count rate plots | Images |
|---|---|---|
| Comparison with Poisson distribution Blue bars denote a histogram of data divided into 1 sec bins. Red curve is a Poisson curve with rate = median count rate of data. |
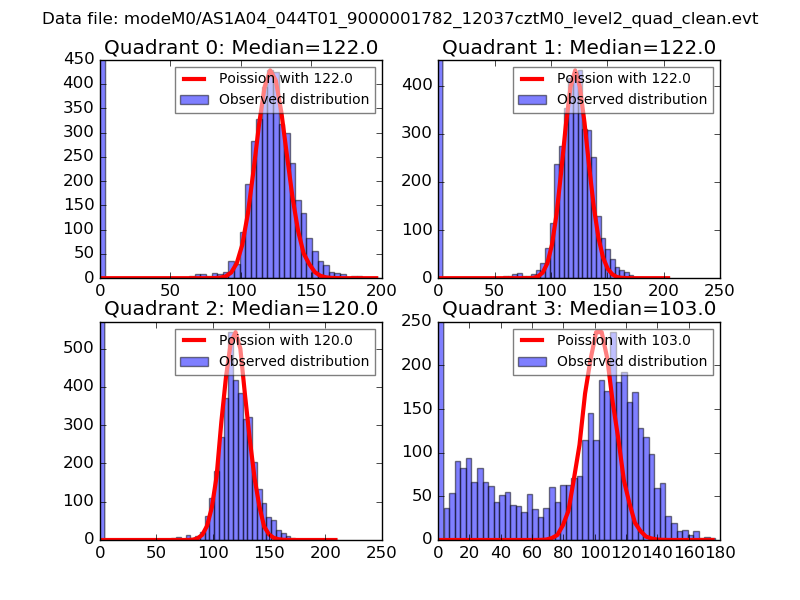 |
 |
| Quadrant-wise count rates Data is divided into 100 sec bins |
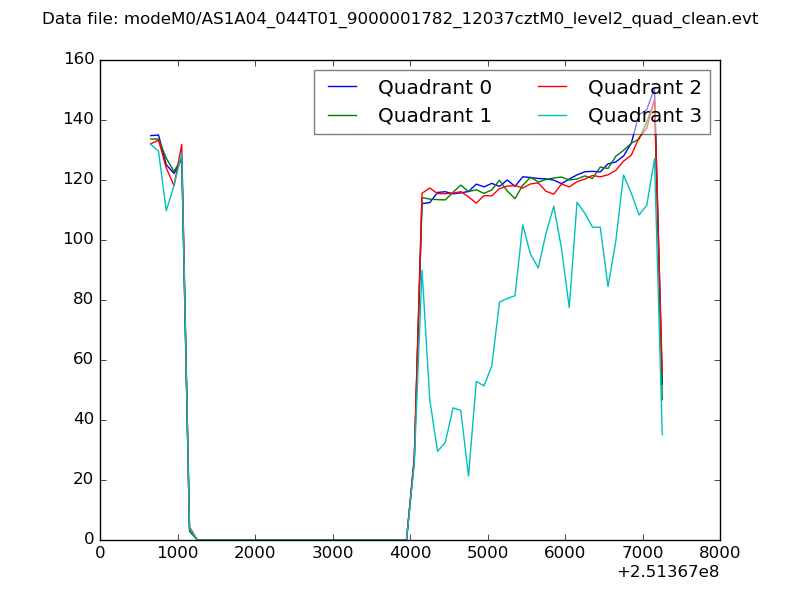 |
|
| Module-wise count rates for Quadrant A Data is divided into 100 sec bins |
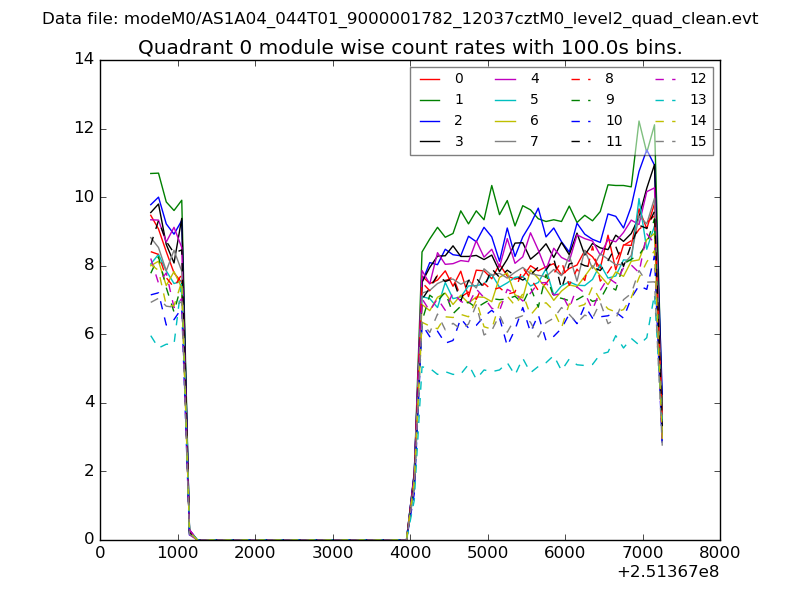 |
 |
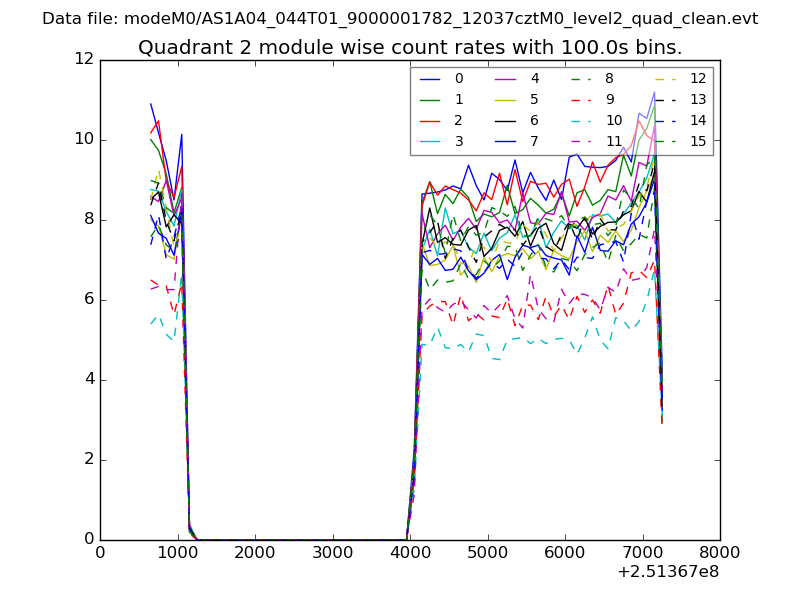
| Module-wise count rates for Quadrant B Data is divided into 100 sec bins |
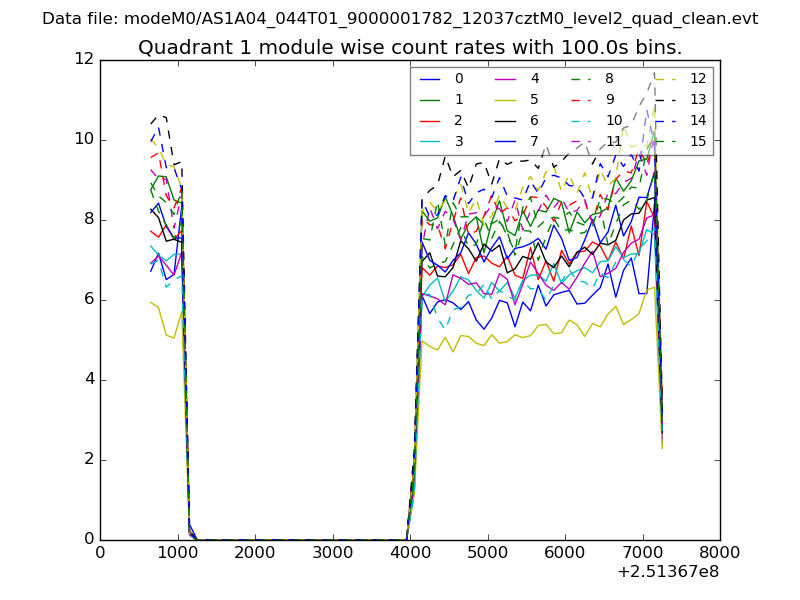 |
 |
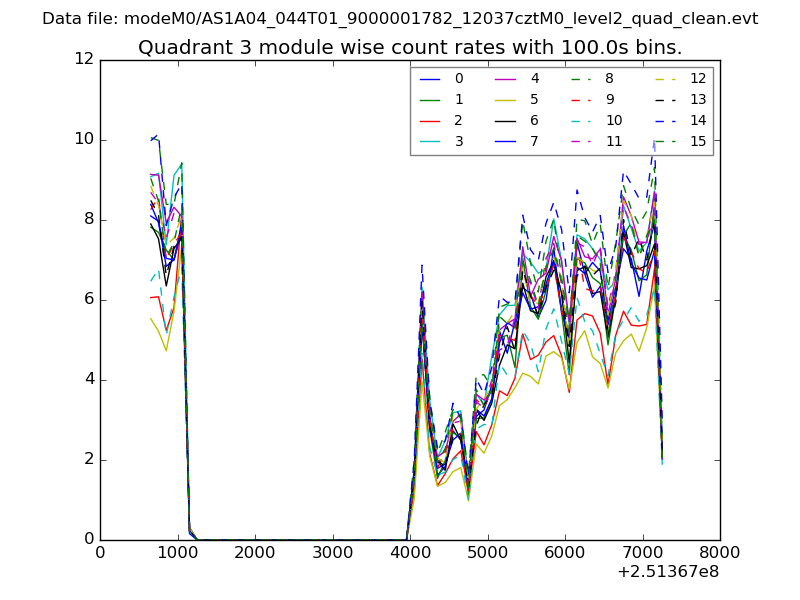
| Module-wise count rates for Quadrant C Data is divided into 100 sec bins |
 |
 |
| Module-wise count rates for Quadrant D Data is divided into 100 sec bins |
 |
 |
| Parameter | Plot |
|---|---|
| CZT HV Monitor | 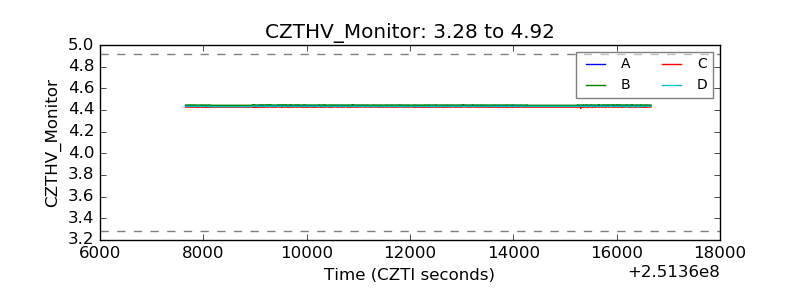 |
| D_VDD | 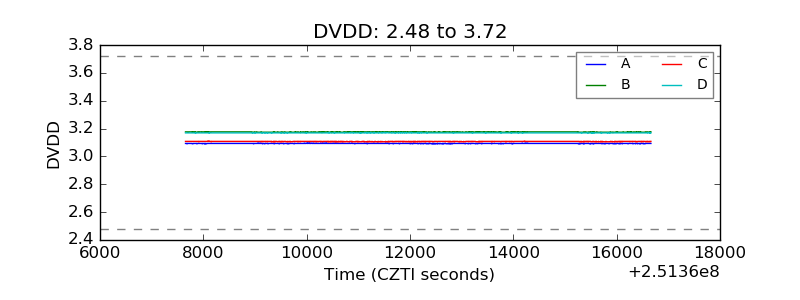 |
| Temperature 1 | 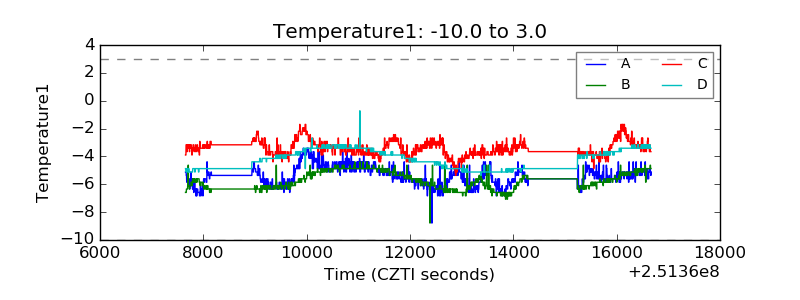 |
| Veto HV Monitor | 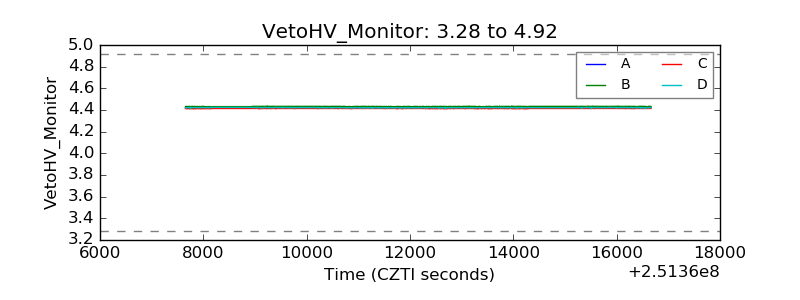 |
| Veto LLD | 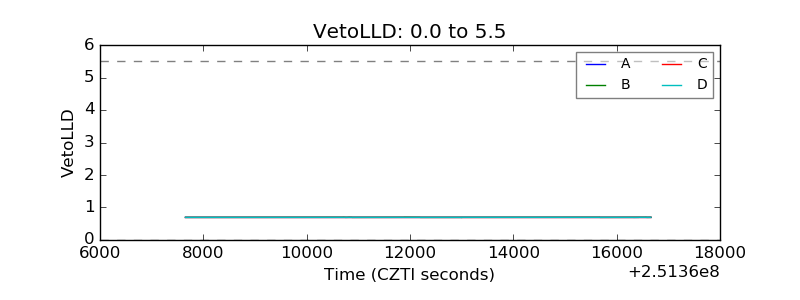 |
| Alpha Counter | 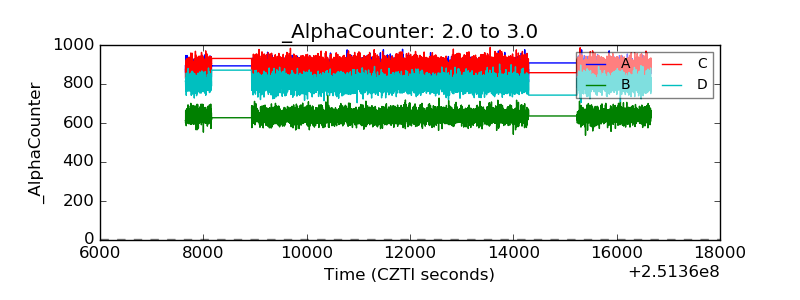 |
| _CPM_Rate | 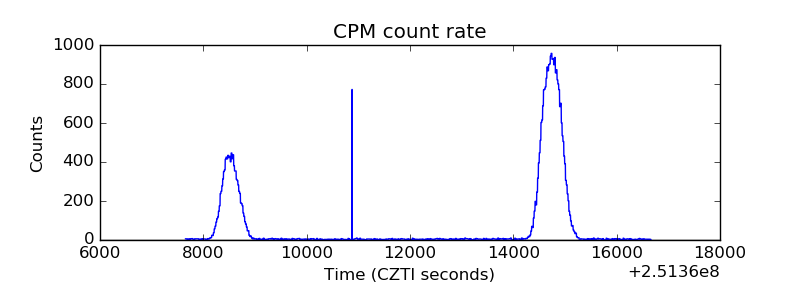 |
| CZT Counter | 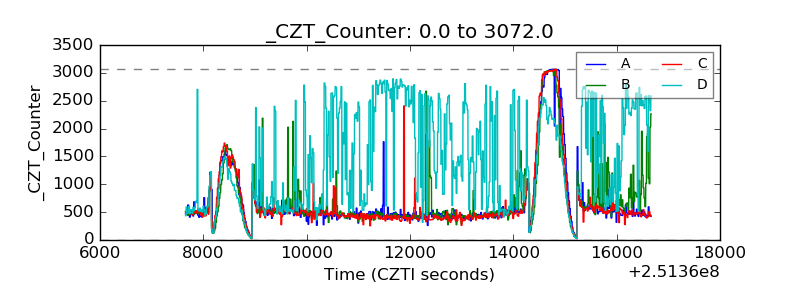 |
| +2.5 Volts monitor |  |
| +5 Volts monitor |  |
| _ROLL_ROT | 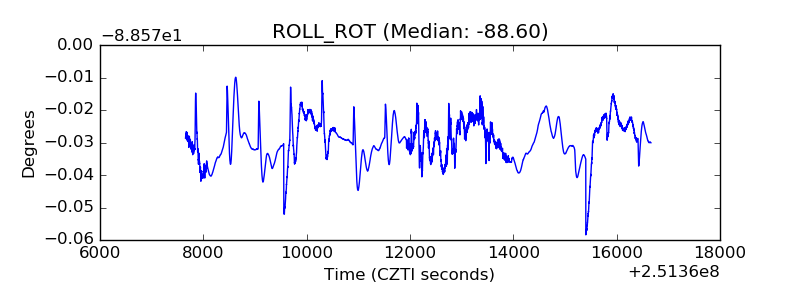 |
| _Roll_DEC | 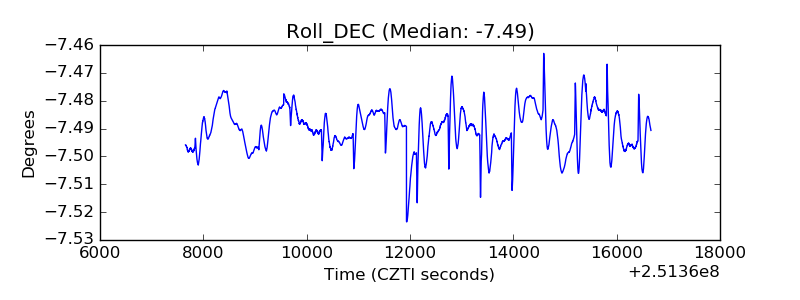 |
| _Roll_RA | 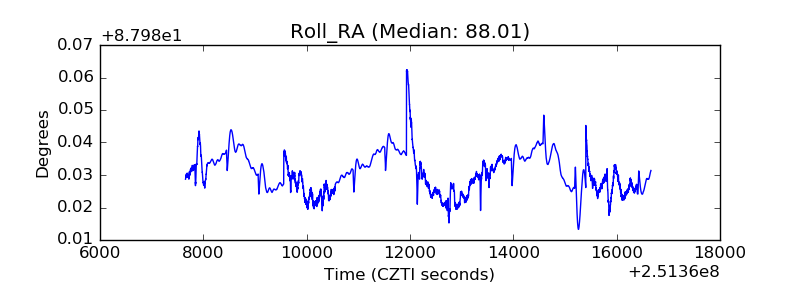 |
| Veto Counter | 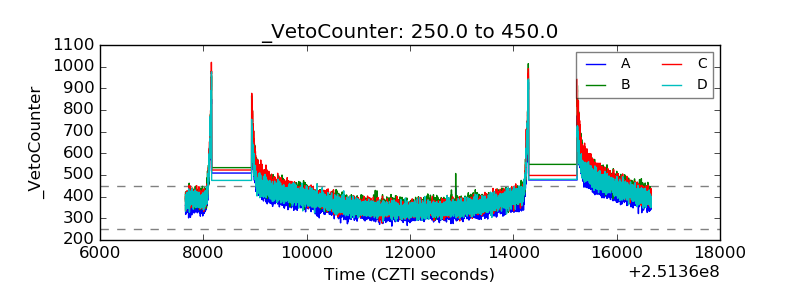 |