| Param | Original file | Final file |
|---|---|---|
| Filename | modeM0/AS1A04_044T01_9000001782_12039cztM0_level2.evt | modeM0/AS1A04_044T01_9000001782_12039cztM0_level2_quad_clean.evt |
| Size (bytes) | 383,857,920 | 29,522,880 |
| Size | 366.1 MB | 28.2 MB |
| Events in quadrant A | 1,595,791 | 183,574 |
| Events in quadrant B | 2,359,124 | 182,504 |
| Events in quadrant C | 1,547,736 | 181,464 |
| Events in quadrant D | 5,898,630 | 112,349 |
| Mode SS | |||
|---|---|---|---|
| Quadrant | BADHDUFLAG | Total packets | Discarded packets |
| A | 0 | 66 | 0 |
| B | 0 | 66 | 0 |
| C | 0 | 66 | 0 |
| D | 0 | 66 | 0 |
| Mode M0 | |||
|---|---|---|---|
| Quadrant | BADHDUFLAG | Total packets | Discarded packets |
| A | 0 | 6874 | 1 |
| B | 0 | 9289 | 1 |
| C | 0 | 6819 | 1 |
| D | 0 | 19780 | 1 |
| Mode M9 | |||
|---|---|---|---|
| Quadrant | BADHDUFLAG | Total packets | Discarded packets |
| A | 0 | 8 | 0 |
| B | 0 | 8 | 0 |
| C | 0 | 8 | 0 |
| D | 0 | 9 | 0 |
| Quadrant | Total seconds | Saturated seconds | Saturation percentage |
|---|---|---|---|
| A | 3279 | 26 | 0.792925% |
| B | 3279 | 190 | 5.794450% |
| C | 3279 | 19 | 0.579445% |
| D | 3279 | 1855 | 56.572126% |
Noise dominated data is calculated using 1-second bins in cleaned event files. If a bin has >2000 counts, and if more than 50% of those come from <1% of pixels, then it is considered to be noise-dominated and hence unusable.
| Quadrant | # 1 sec bins | Bins with >0 counts | Bins with >2000 counts | High rate bins dominated by noise | Noise dominated (total time) | Noise dominated (detector-on time) | Marked lightcurve |
|---|---|---|---|---|---|---|---|
| A | 3280 | 3280 | 0 | 0 | 0.00% | 0.00% | 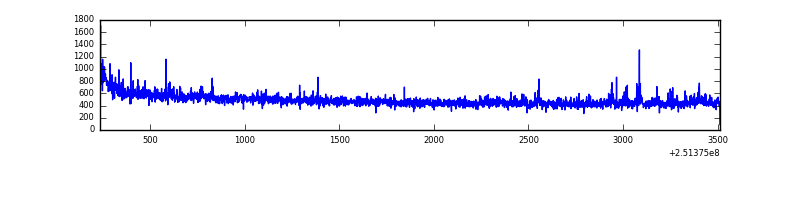 |
| B | 3280 | 3280 | 102 | 102 | 3.11% | 3.11% | 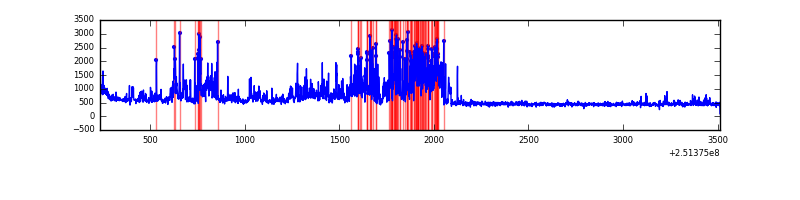 |
| C | 3280 | 3280 | 7 | 7 | 0.21% | 0.21% | 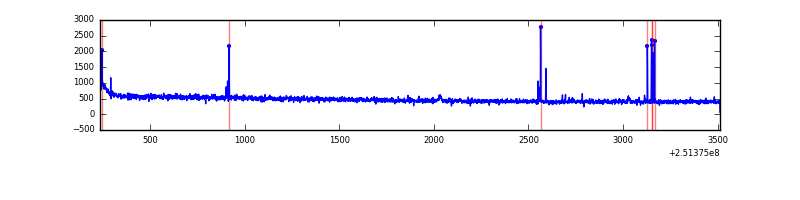 |
| D | 3279 | 3279 | 1789 | 1789 | 54.56% | 54.56% | 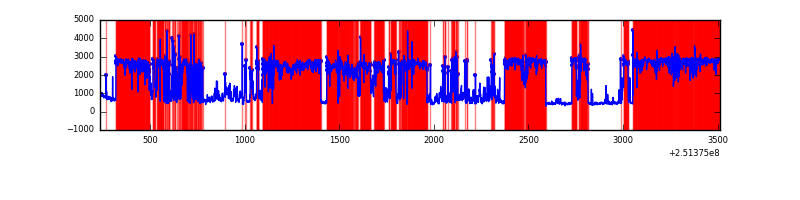 |
Top three noisy pixels from each quadrant. If the there are fewer than three noisy pixels in the level2.evt file, extra rows are filled as -1
| Pixel properties | Quadrant properties | ||||||
|---|---|---|---|---|---|---|---|
| Quadrant | DetID | PixID | Counts | Sigma | Mean | Median | Sigma |
| A | 1 | 162 | 24553 | 292.17 | 398 | 389 | 82.7 |
| A | 1 | 178 | 12382 | 145.01 | 398 | 389 | 82.7 |
| A | 1 | 161 | 10847 | 126.45 | 398 | 389 | 82.7 |
| B | 4 | 239 | 781413 | 10178.46 | 392 | 382 | 76.7 |
| B | 15 | 204 | 36134 | 465.92 | 392 | 382 | 76.7 |
| B | 0 | 85 | 13934 | 176.61 | 392 | 382 | 76.7 |
| C | 14 | 234 | 29755 | 323.66 | 388 | 391 | 90.7 |
| C | 0 | 207 | 4891 | 49.6 | 388 | 391 | 90.7 |
| C | 13 | 61 | 2870 | 27.32 | 388 | 391 | 90.7 |
| D | 1 | 52 | 4817630 | 84315.89 | 233 | 226 | 57.1 |
| D | 8 | 195 | 94939 | 1657.7 | 233 | 226 | 57.1 |
| D | 5 | 222 | 64801 | 1130.21 | 233 | 226 | 57.1 |
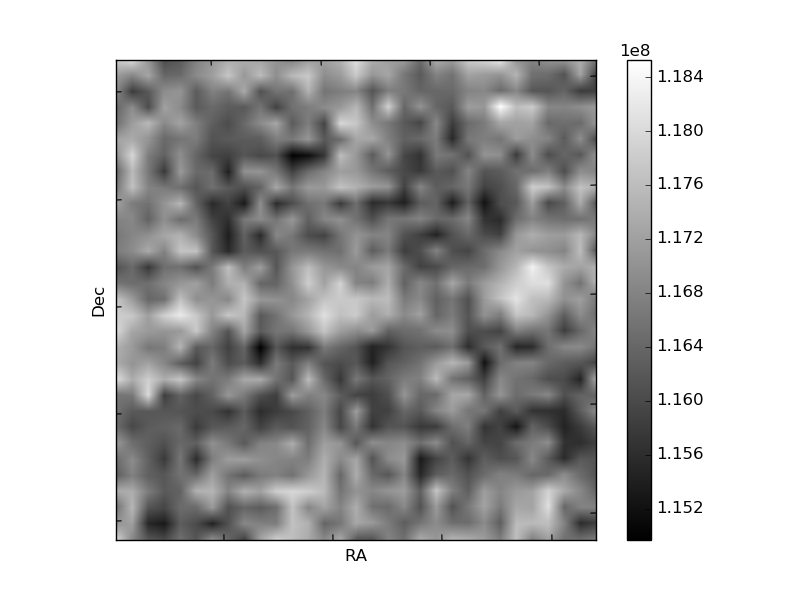
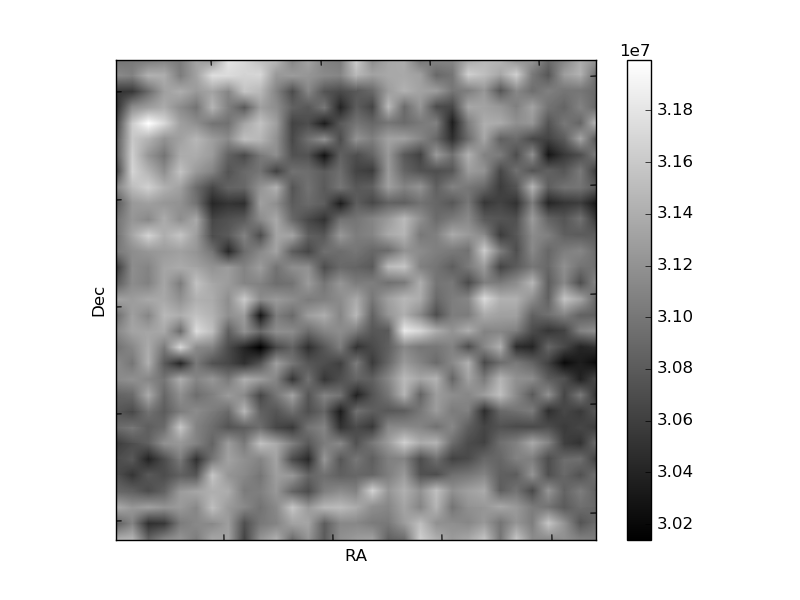
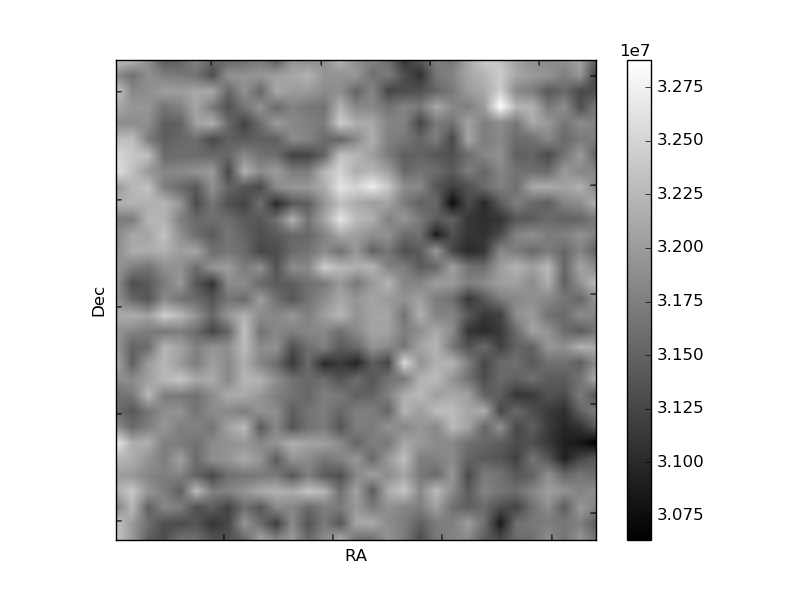
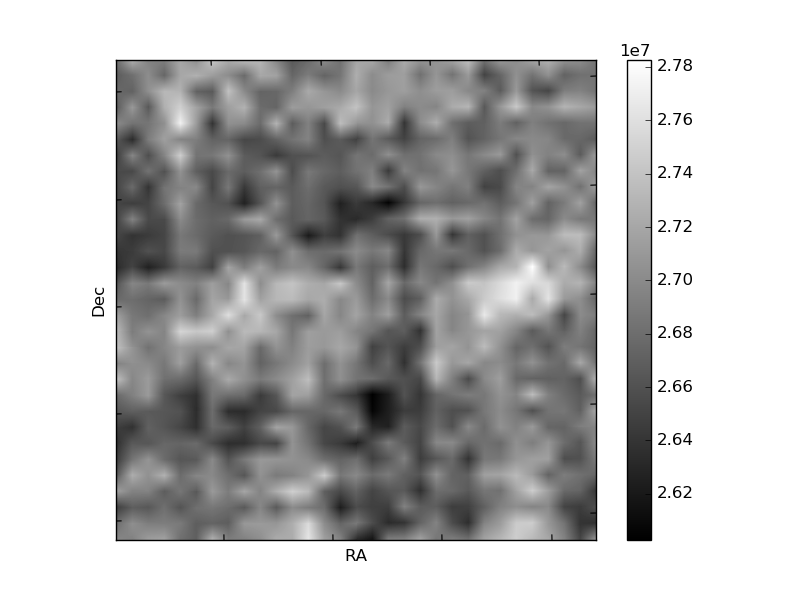
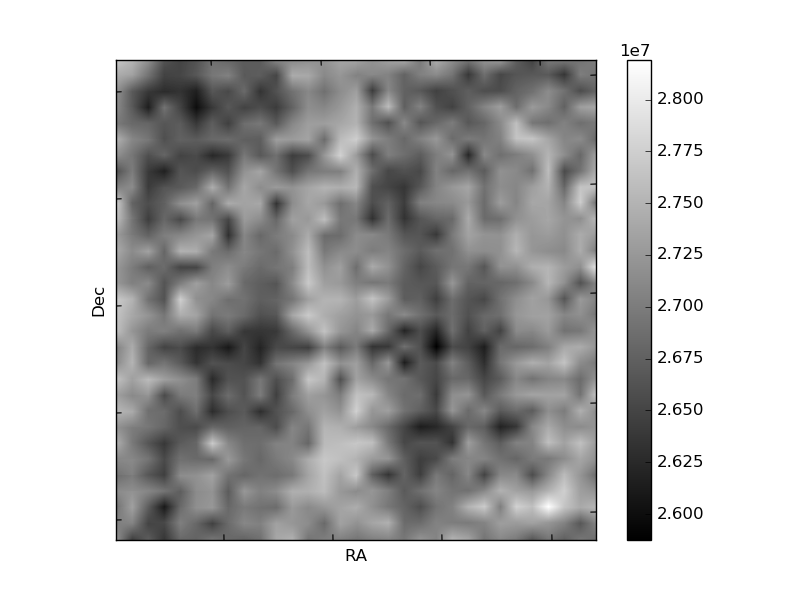
Histogram calculated using DETX and DETY for each event in the final _common_clean file
| Quadrant A | 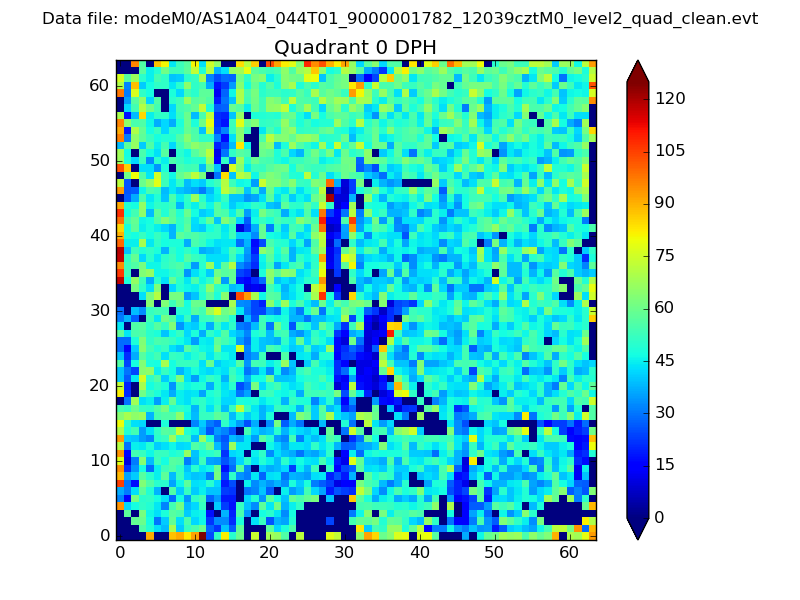 |
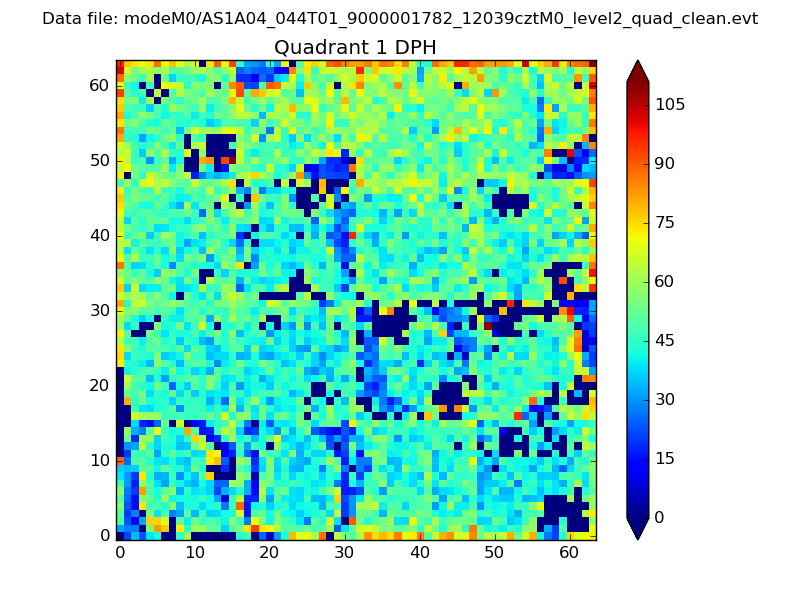 |
Quadrant B |
|---|---|---|---|
| Quadrant D | 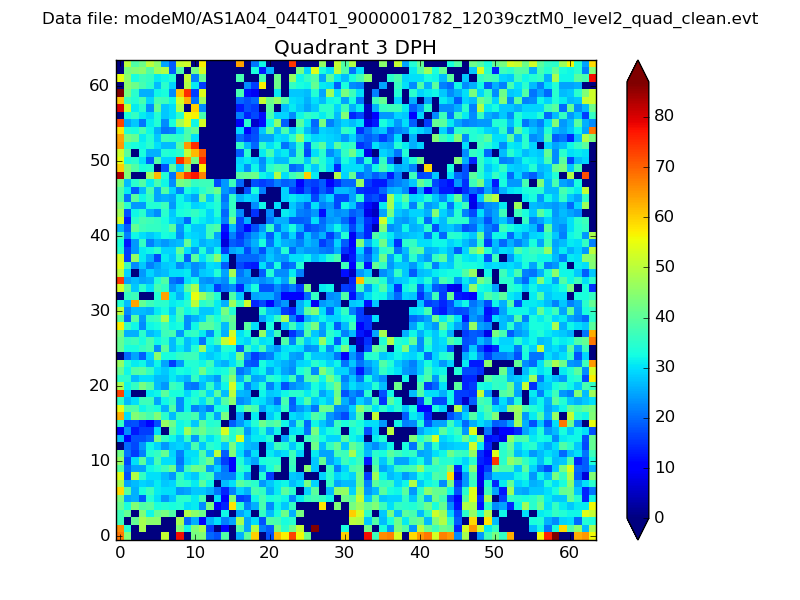 |
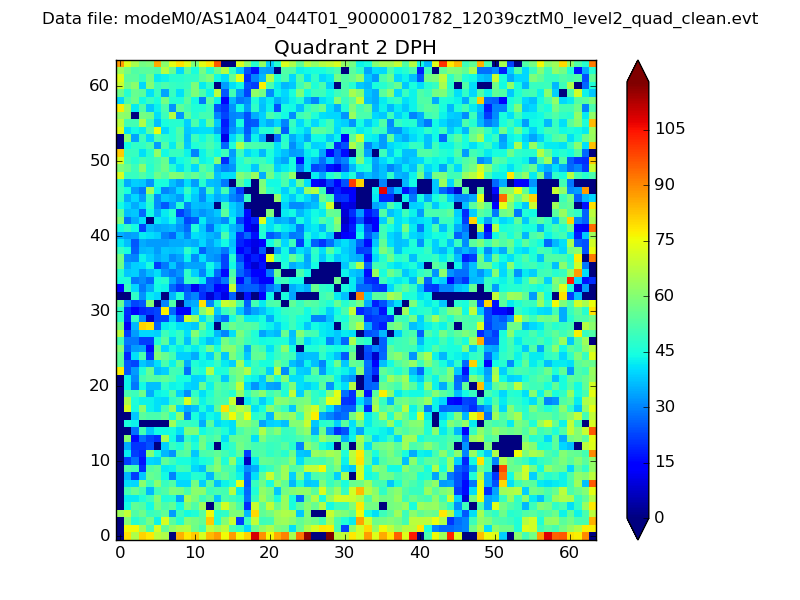 |
Quadrant C |
| Plot type | Count rate plots | Images |
|---|---|---|
| Comparison with Poisson distribution Blue bars denote a histogram of data divided into 1 sec bins. Red curve is a Poisson curve with rate = median count rate of data. |
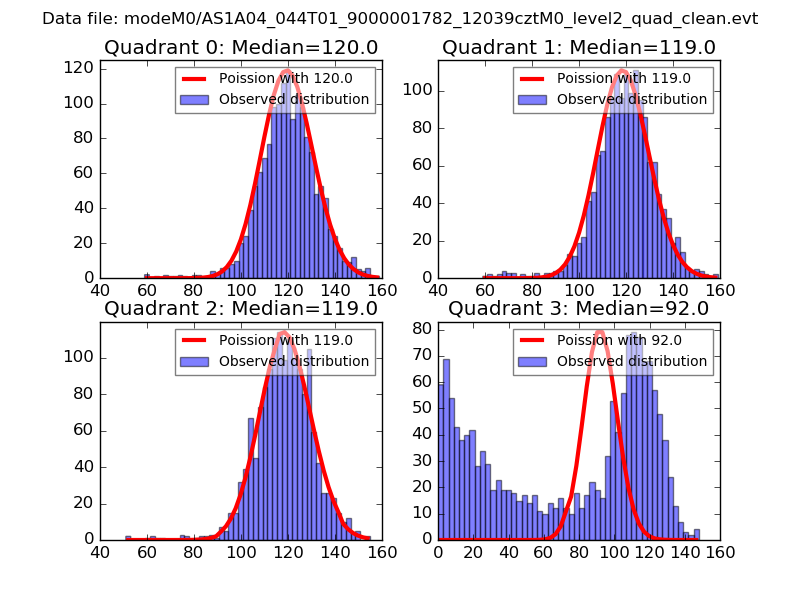 |
 |
| Quadrant-wise count rates Data is divided into 100 sec bins |
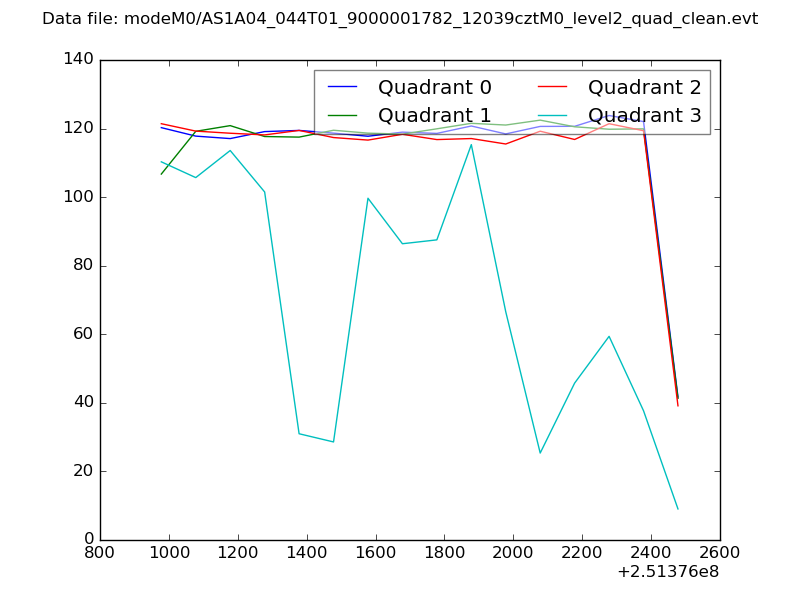 |
|
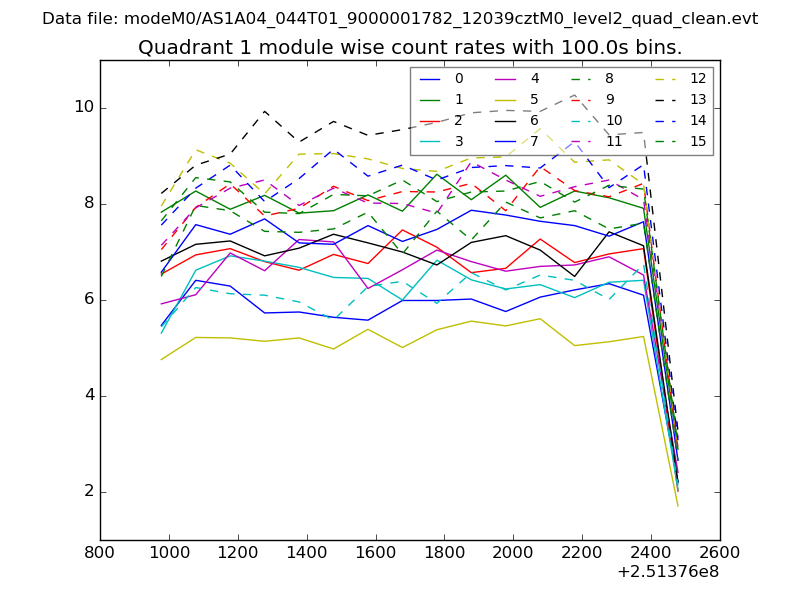
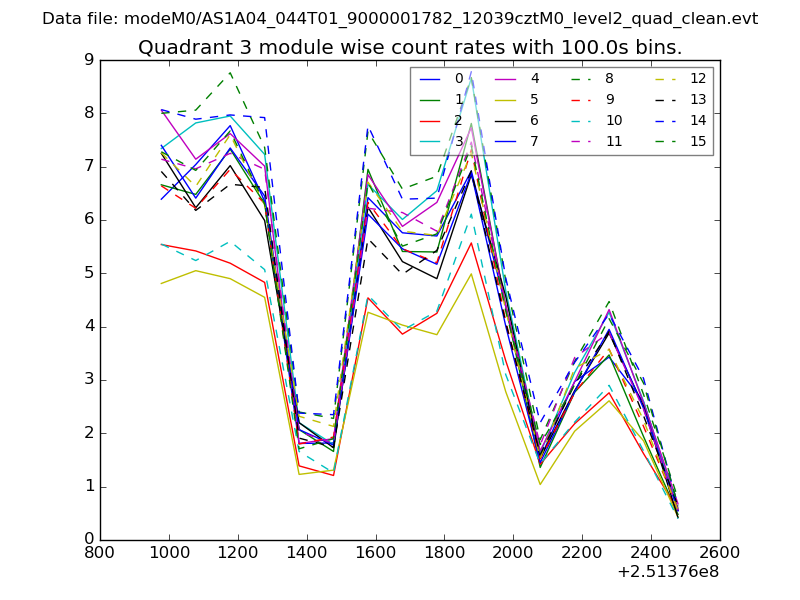
| Module-wise count rates for Quadrant A Data is divided into 100 sec bins |
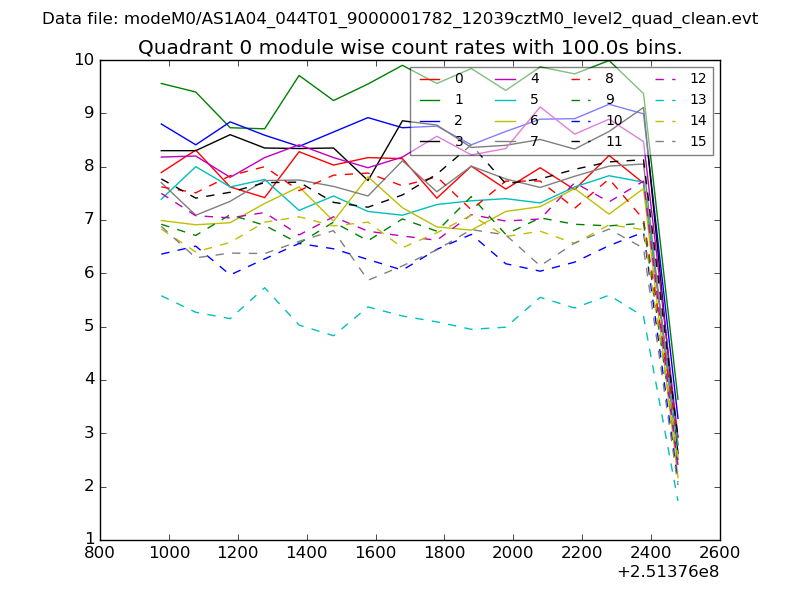 |
 |
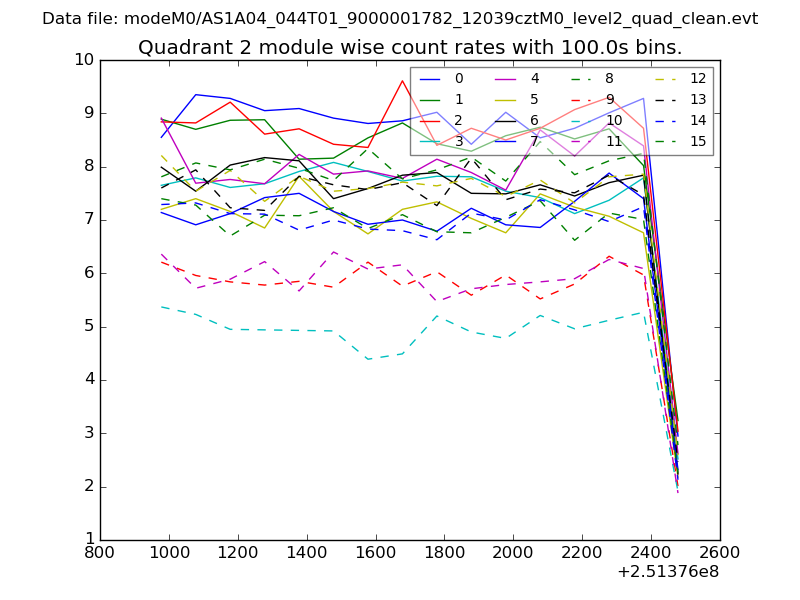
| Module-wise count rates for Quadrant B Data is divided into 100 sec bins |
 |
 |
| Module-wise count rates for Quadrant C Data is divided into 100 sec bins |
 |
 |
| Module-wise count rates for Quadrant D Data is divided into 100 sec bins |
 |
 |
| Parameter | Plot |
|---|---|
| CZT HV Monitor | 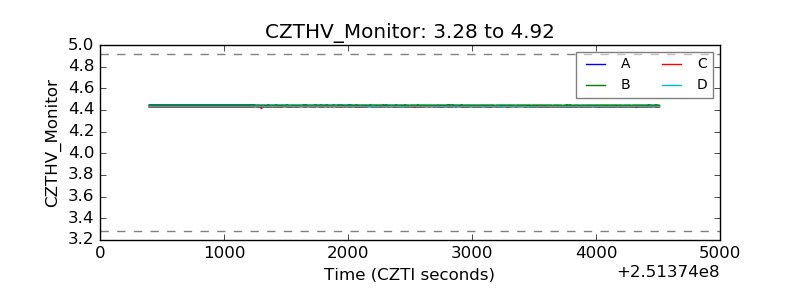 |
| D_VDD | 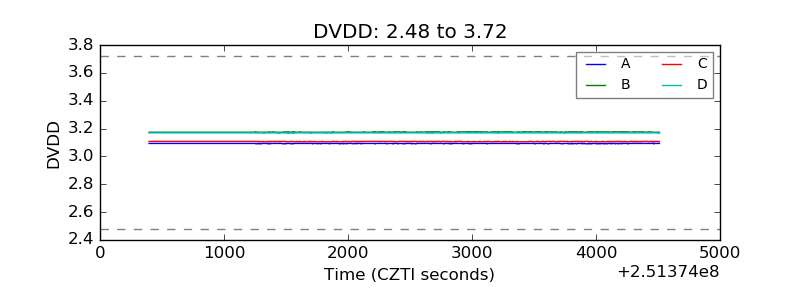 |
| Temperature 1 | 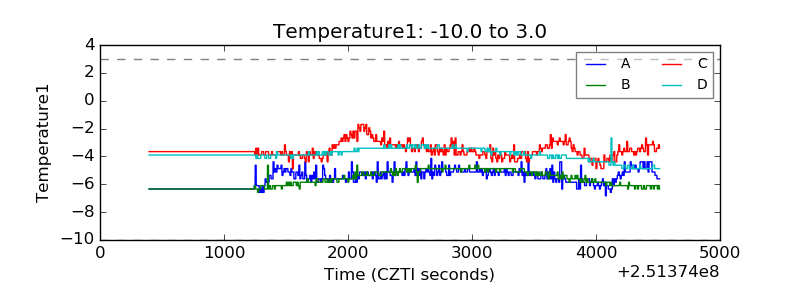 |
| Veto HV Monitor | 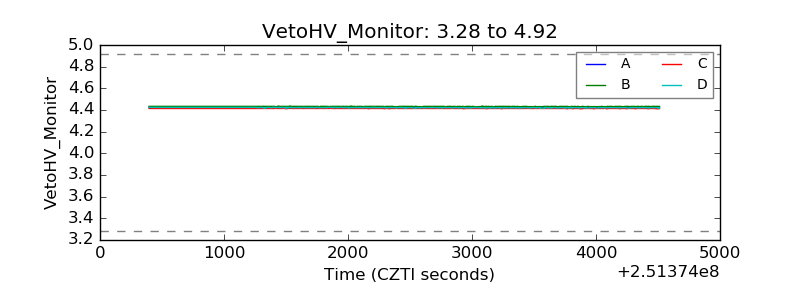 |
| Veto LLD | 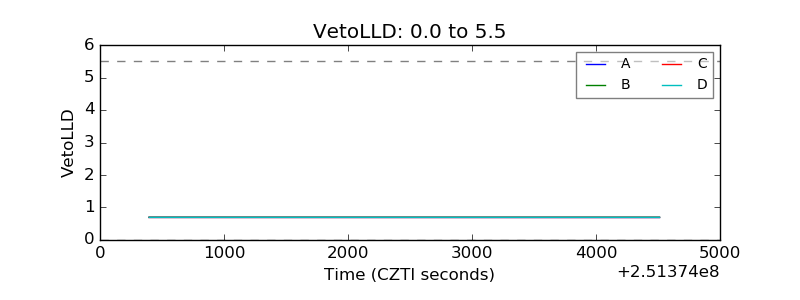 |
| Alpha Counter | 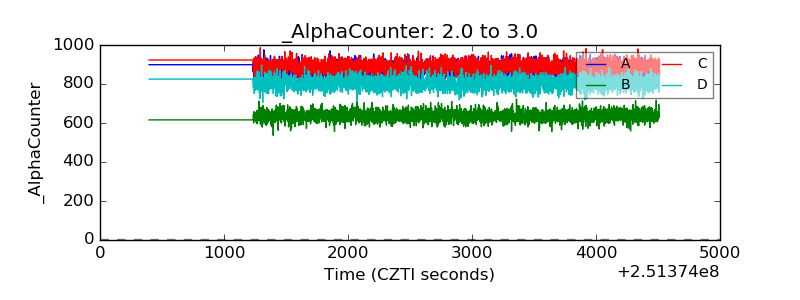 |
| _CPM_Rate | 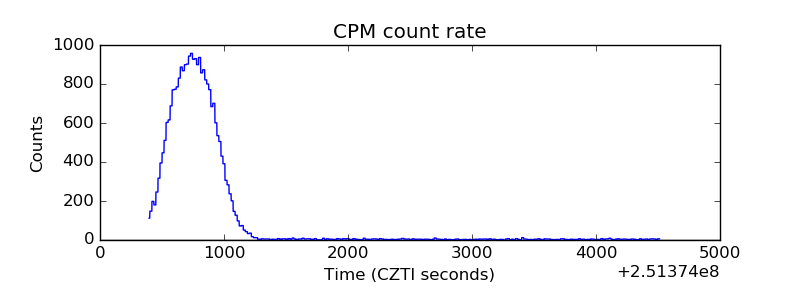 |
| CZT Counter | 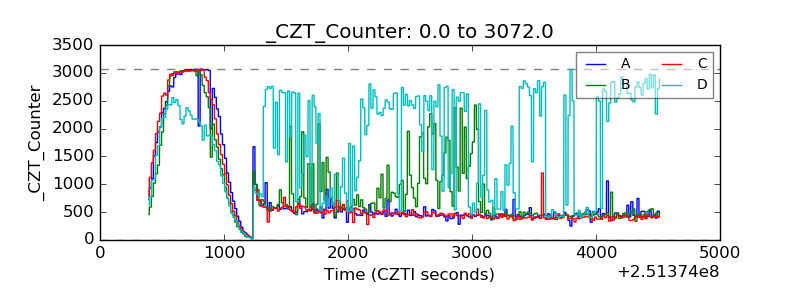 |
| +2.5 Volts monitor | 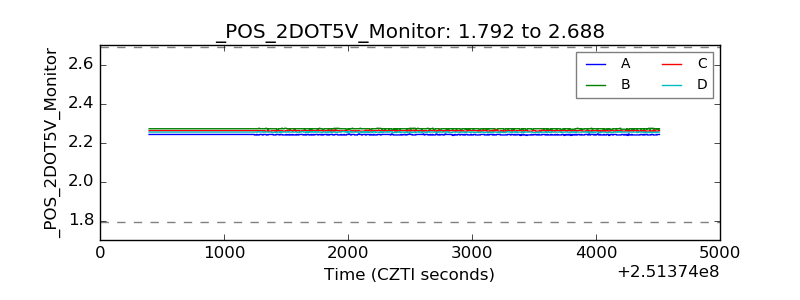 |
| +5 Volts monitor | 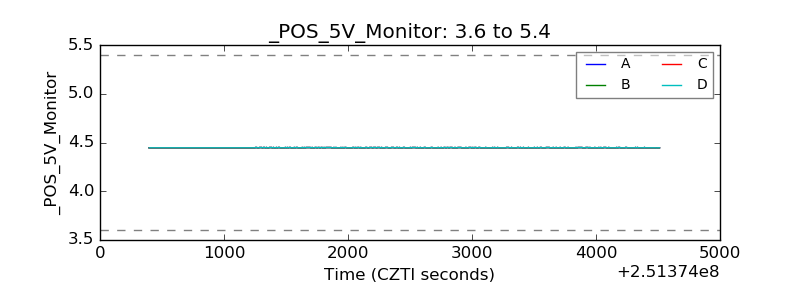 |
| _ROLL_ROT | 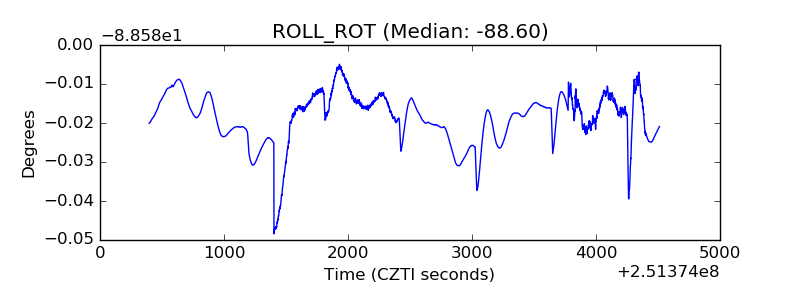 |
| _Roll_DEC | 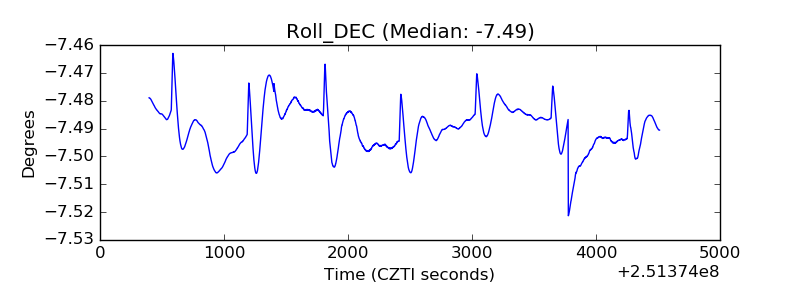 |
| _Roll_RA | 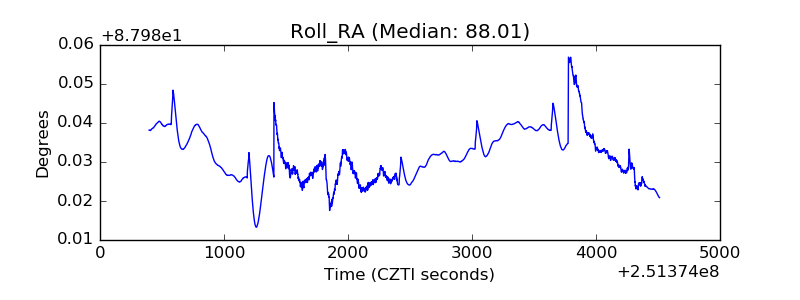 |
| Veto Counter | 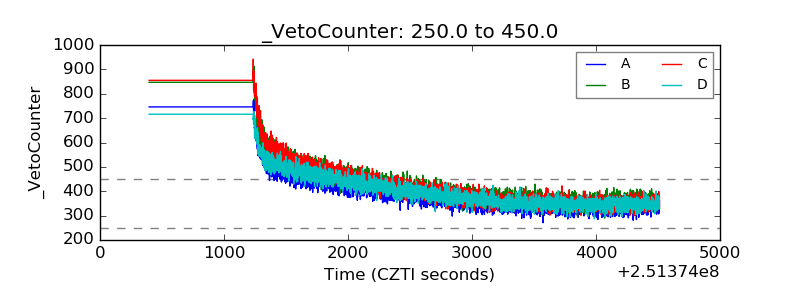 |