| Param | Original file | Final file |
|---|---|---|
| Filename | modeM0/AS1A04_075T03_9000001780cztM0_level2.fits | modeM0/AS1A04_075T03_9000001780cztM0_level2_quad_clean.evt |
| Size (bytes) | 72,394,560 | 79,182,720 |
| Size | 69.0 MB | 75.5 MB |
| Events in quadrant A | 447,046 | 501,313 |
| Events in quadrant B | 420,040 | 477,349 |
| Events in quadrant C | 437,726 | 469,904 |
| Events in quadrant D | 370,714 | 431,977 |
| Mode M9 | |||
|---|---|---|---|
| Quadrant | BADHDUFLAG | Total packets | Discarded packets |
| A | 0 | 18 | 0 |
| B | 0 | 18 | 0 |
| C | 0 | 18 | 0 |
| D | 0 | 18 | 0 |
| Mode SS | |||
|---|---|---|---|
| Quadrant | BADHDUFLAG | Total packets | Discarded packets |
| A | 0 | 152 | 0 |
| B | 0 | 152 | 0 |
| C | 0 | 152 | 0 |
| D | 0 | 152 | 0 |
| Mode M0 | |||
|---|---|---|---|
| Quadrant | BADHDUFLAG | Total packets | Discarded packets |
| A | 0 | 16241 | 0 |
| B | 0 | 20055 | 0 |
| C | 0 | 15461 | 0 |
| D | 0 | 19205 | 0 |
| Quadrant | Total seconds | Saturated seconds | Saturation percentage |
|---|---|---|---|
| A | 7429 | 148 | 1.992193% |
| B | 7429 | 503 | 6.770763% |
| C | 7429 | 83 | 1.117243% |
| D | 7429 | 322 | 4.334365% |
Noise dominated data is calculated using 1-second bins in cleaned event files. If a bin has >2000 counts, and if more than 50% of those come from <1% of pixels, then it is considered to be noise-dominated and hence unusable.
| Quadrant | # 1 sec bins | Bins with >0 counts | Bins with >2000 counts | High rate bins dominated by noise | Noise dominated (total time) | Noise dominated (detector-on time) | Marked lightcurve |
|---|---|---|---|---|---|---|---|
| A | 8563 | 7426 | 0 | 0 | 0.00% | 0.00% | 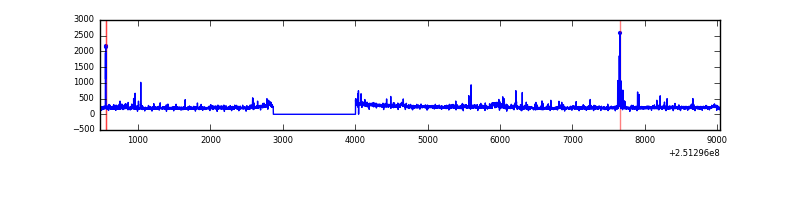 |
| B | 8563 | 7413 | 0 | 0 | 0.00% | 0.00% |  |
| C | 8563 | 7427 | 0 | 0 | 0.00% | 0.00% |  |
| D | 8563 | 7427 | 0 | 0 | 0.00% | 0.00% | 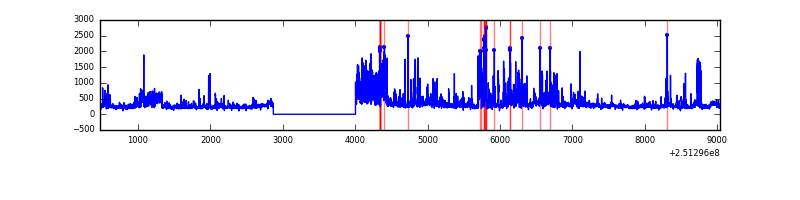 |
Top three noisy pixels from each quadrant. If the there are fewer than three noisy pixels in the level2.evt file, extra rows are filled as -1
| Pixel properties | Quadrant properties | ||||||
|---|---|---|---|---|---|---|---|
| Quadrant | DetID | PixID | Counts | Sigma | Mean | Median | Sigma |
| A | 14 | 188 | 448 | 11.11 | 116 | 110 | 30.4 |
| A | 0 | 29 | 429 | 10.48 | 116 | 110 | 30.4 |
| A | 14 | 204 | 359 | 8.18 | 116 | 110 | 30.4 |
| B | 2 | 9 | 357 | 10.64 | 111 | 106 | 23.6 |
| B | 14 | 254 | 273 | 7.08 | 111 | 106 | 23.6 |
| B | 10 | 128 | 271 | 6.99 | 111 | 106 | 23.6 |
| C | 9 | 242 | 304 | 6.08 | 115 | 108 | 32.2 |
| C | 4 | 254 | 303 | 6.05 | 115 | 108 | 32.2 |
| C | 2 | 191 | 301 | 5.99 | 115 | 108 | 32.2 |
| D | 3 | 159 | 276 | 6.11 | 105 | 96 | 29.5 |
| D | 3 | 14 | 273 | 6.0 | 105 | 96 | 29.5 |
| D | 7 | 5 | 267 | 5.8 | 105 | 96 | 29.5 |
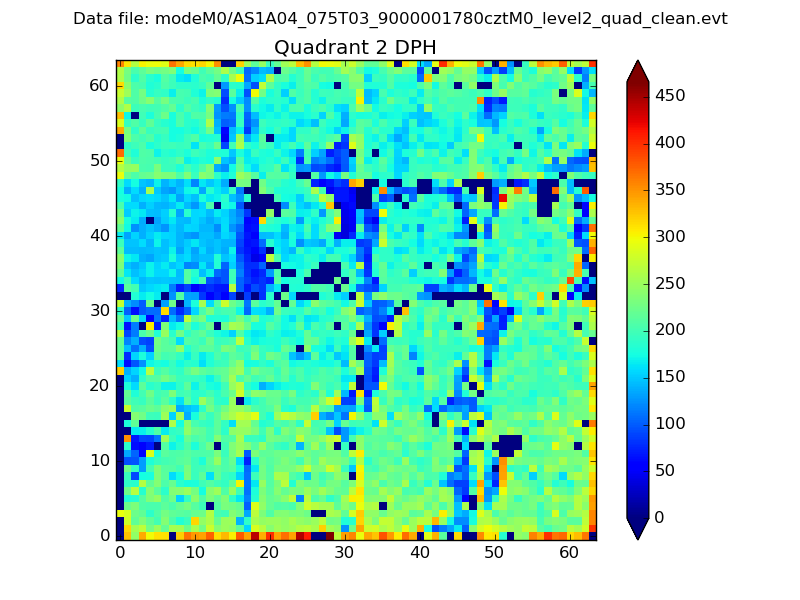
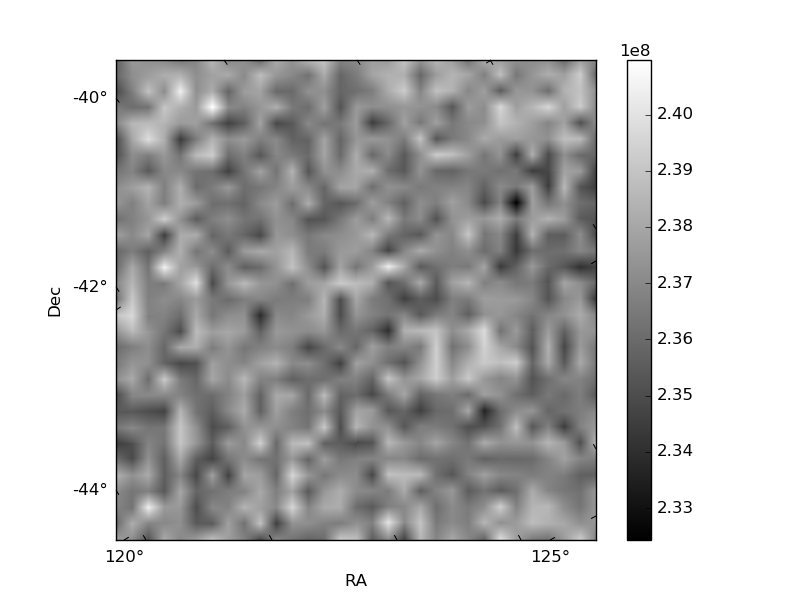
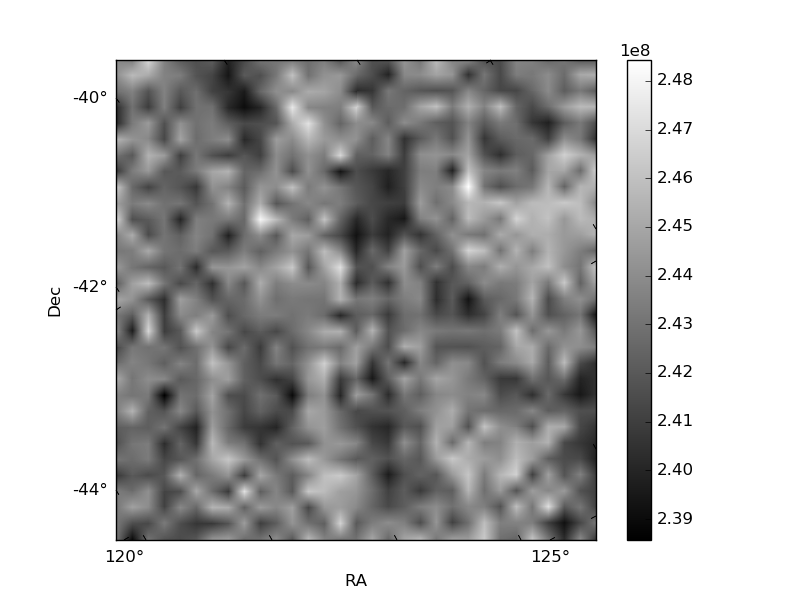
Histogram calculated using DETX and DETY for each event in the final _common_clean file
| Quadrant A | 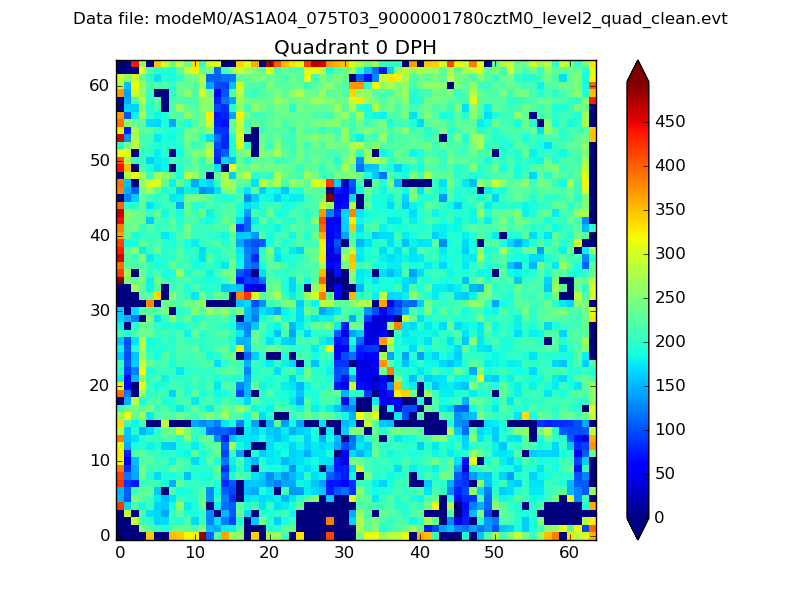 |
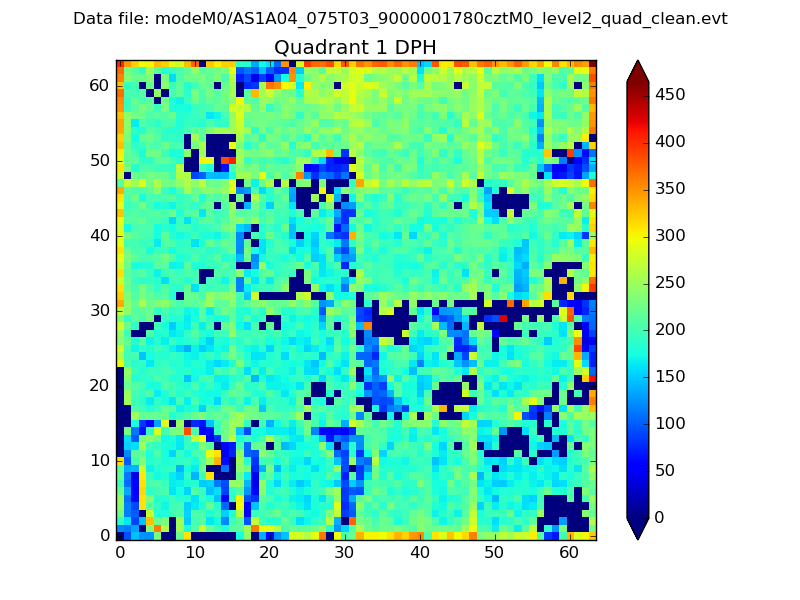 |
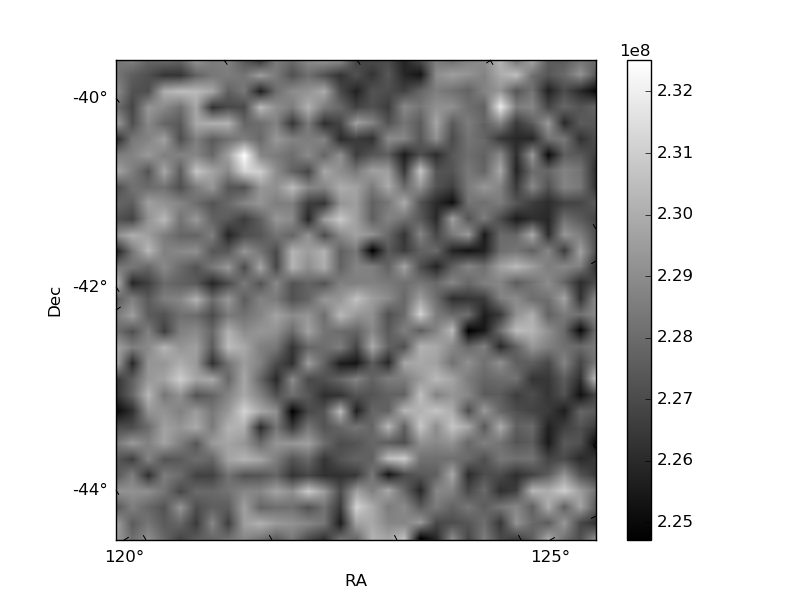
Quadrant B |
|---|---|---|---|
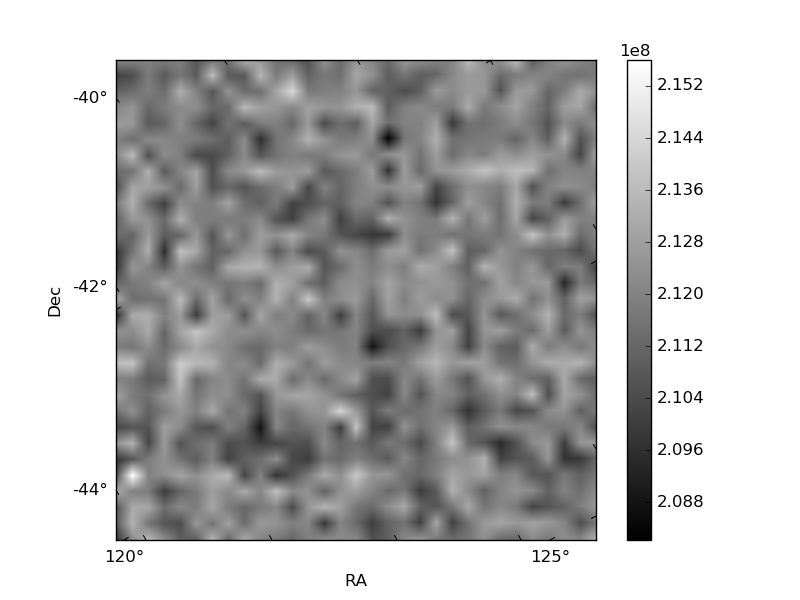
| Quadrant D | 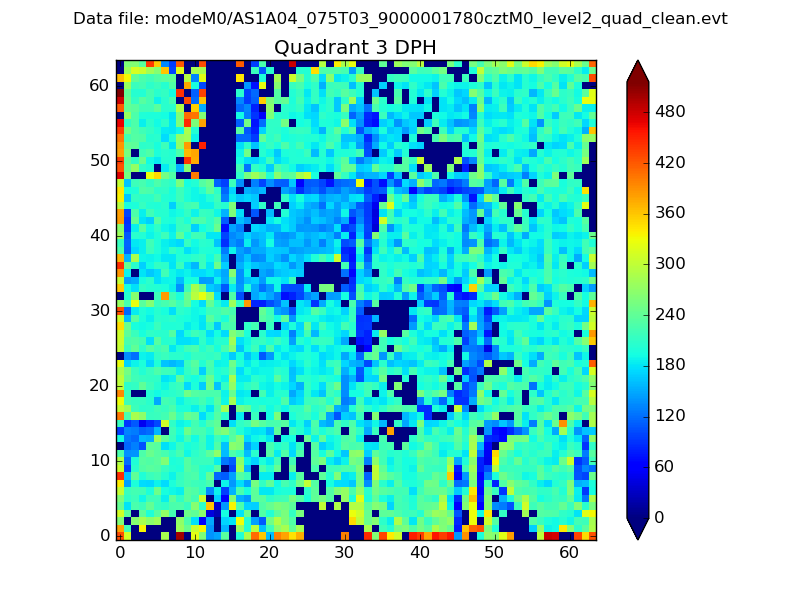 |
 |
Quadrant C |
| Plot type | Count rate plots | Images |
|---|---|---|
| Comparison with Poisson distribution Blue bars denote a histogram of data divided into 1 sec bins. Red curve is a Poisson curve with rate = median count rate of data. |
 |
 |
| Quadrant-wise count rates Data is divided into 100 sec bins |
 |
|
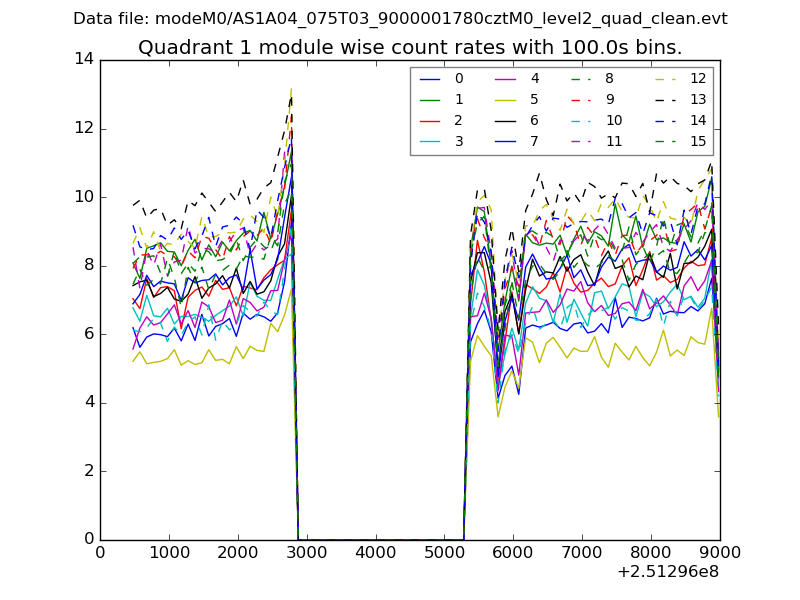
| Module-wise count rates for Quadrant A Data is divided into 100 sec bins |
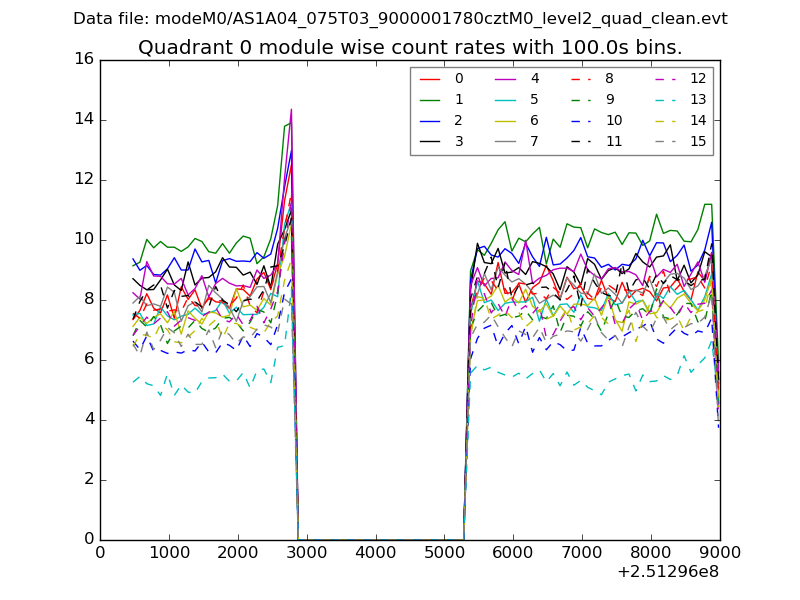 |
 |
| Module-wise count rates for Quadrant B Data is divided into 100 sec bins |
 |
 |
| Module-wise count rates for Quadrant C Data is divided into 100 sec bins |
 |
 |
| Module-wise count rates for Quadrant D Data is divided into 100 sec bins |
 |
 |
| Parameter | Plot |
|---|---|
| CZT HV Monitor | 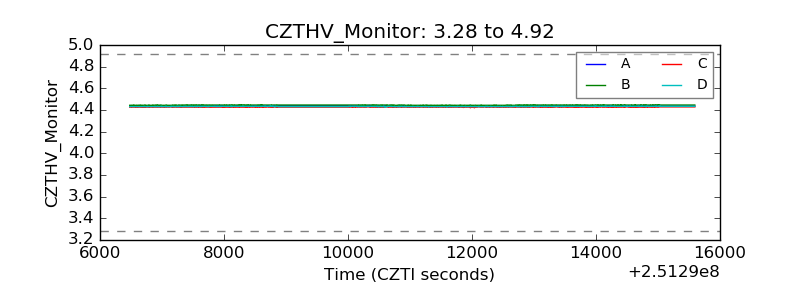 |
| D_VDD | 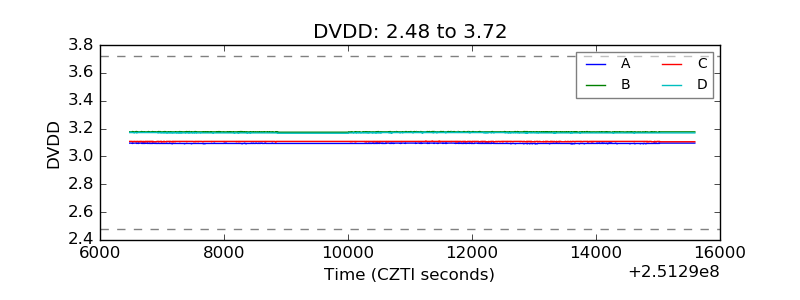 |
| Temperature 1 | 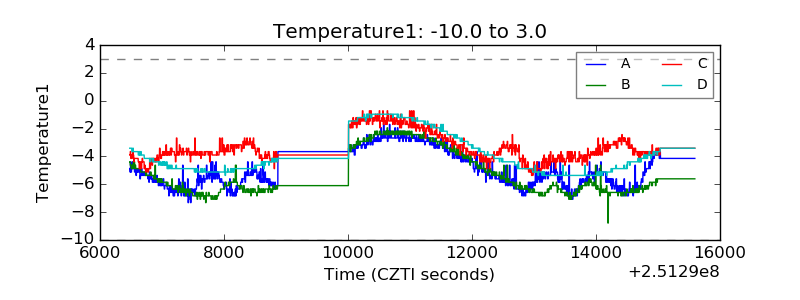 |
| Veto HV Monitor |  |
| Veto LLD | 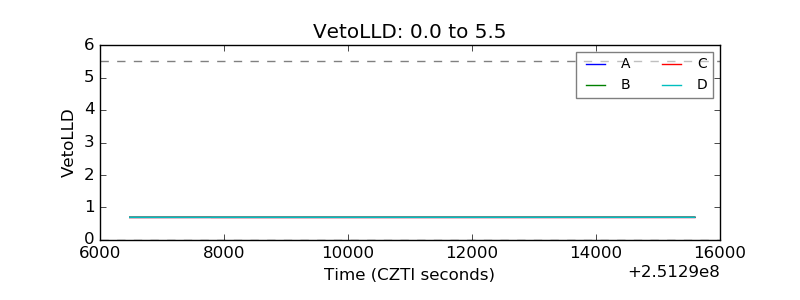 |
| Alpha Counter |  |
| _CPM_Rate | 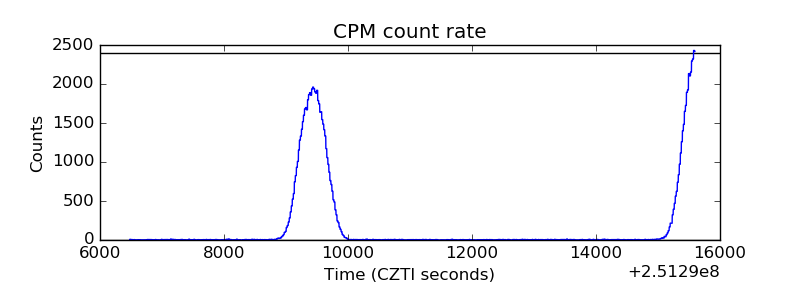 |
| CZT Counter | 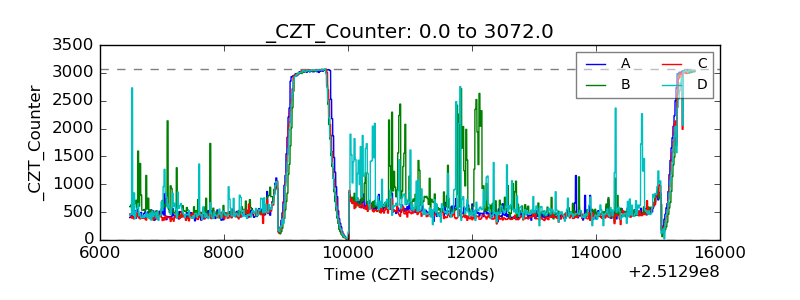 |
| +2.5 Volts monitor |  |
| +5 Volts monitor |  |
| _ROLL_ROT | 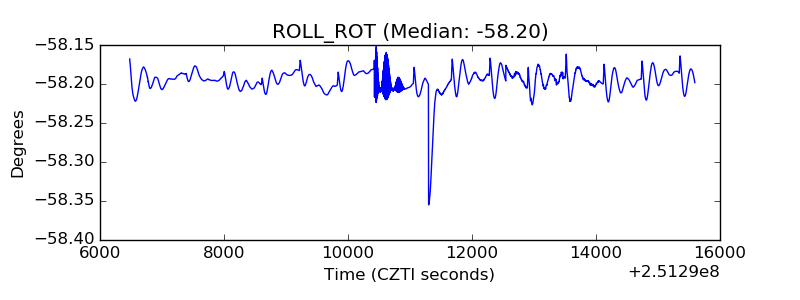 |
| _Roll_DEC | 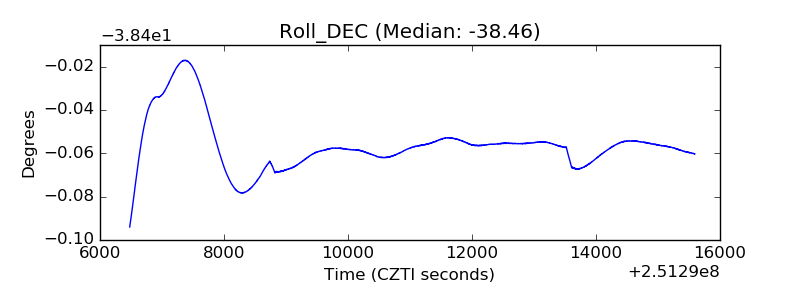 |
| _Roll_RA | 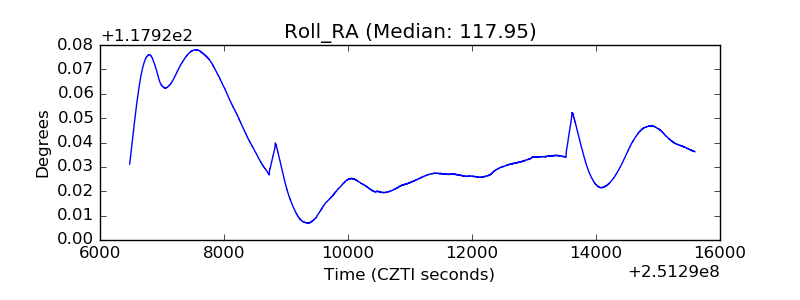 |
| Veto Counter |  |